Towards a Digital Blueprint: data, technology and collaboration at the core of HS2
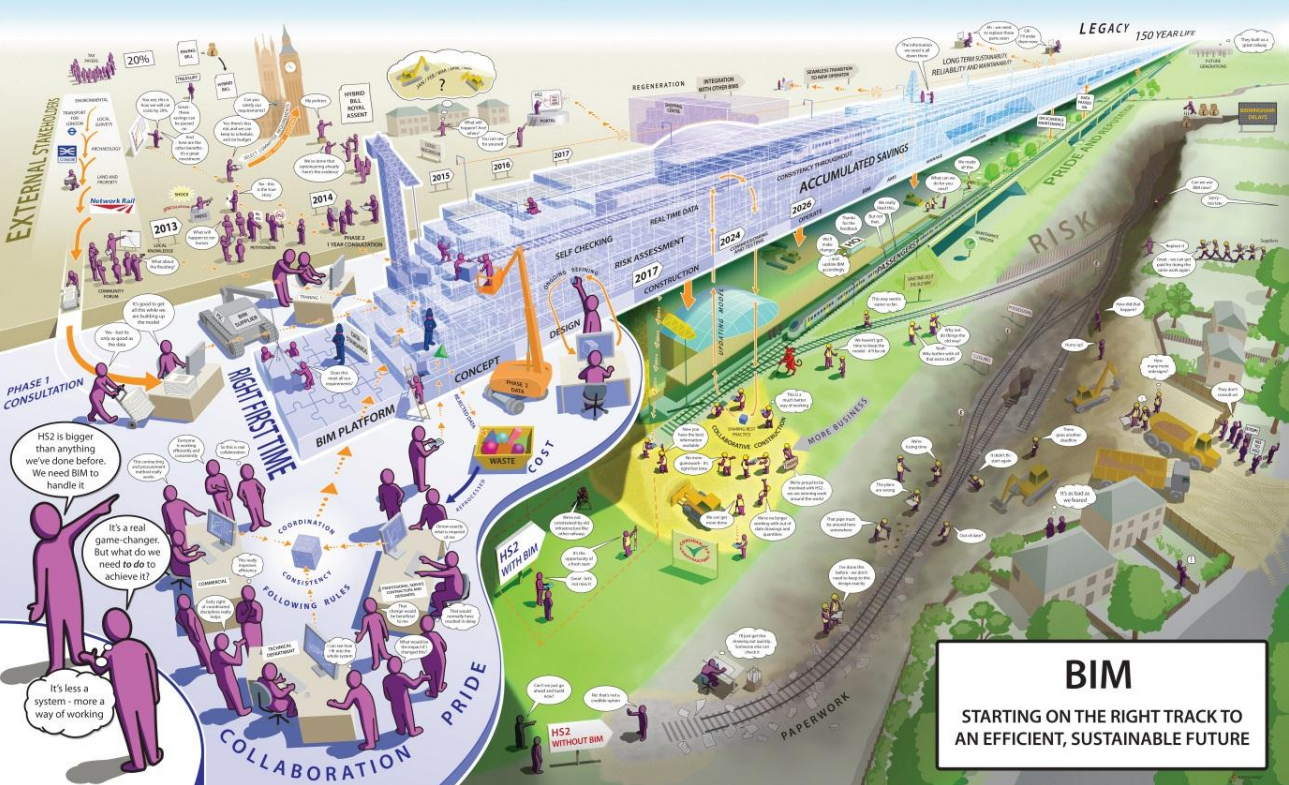
This project is one of the most complex and challenging railway initiatives the United Kingdom has ever undertaken. Tasked with saving the government £500 million in digital efficiencies, HS2 is committed to applying global best practice in design and construction, setting strict data and modelling requirements in accordance with Government BIM (Building Information Modelling) standards.
Driven by HS2 Ltd’s strong commitment to harness the power of BIM to design, construct and maintain assets digitally, the integrated team of designers and contractors within the SCS JV contract is trying to push the boundaries of innovation and achieve a very high degree of control over all produced information, to meet very demanding requirements, and putting BIM at the front and centre.
In this journey from the tender – the “Digital Rehearsal” used as an opportunity to test processes and methods – to the current construction stage, the SCS BIM Team integration and the collaborative engagement between designers and contractors during the early contractor involvement phase has been key, with all teams working under one team and goal.
A BIM strategy has been developed and executed that enhances the industry existing standards to be able to deliver this mega-project, across the entire suite of digital engineering ranging from 4D construction management, 5D cost and carbon estimation, business intelligence and system architecture, GIS and mobile technology.
In this paper SCS shares its experience in this project, on innovative methodologies in a complex digital environment, making project information accessible for all and overcoming the usual cultural challenges. All with the formidable goal of changing the face of the industry, by creating a legacy, a “Digital Blueprint” of what BIM in large infrastructure projects could look like.
- Written by
-
Roberto Alberola (SCS/TYPSA Ltd)

-
Peter Ruff (SCS/Costain)

- Resource type
- Resource type: Technical Paper
Introduction
HS2 Ltd, as the client, has outlined from the start of the project a strong commitment to harnessing the power of BIM to build and operate the railway, designing, constructing and maintaining all assets digitally, using both graphical and non-graphical information to provide real-time access to reliable and accurate data. This “BIM vision” is stated by HS2 as the force driving the employer’s requirements, which makes them hugely challenging, as their ultimate aim is to actually achieve an unprecedented BIM maturity level.
At the time of writing, the project has completed the ECI (Early Contractor Involvement) phase of the HS2 contract and commenced Stage 2 detailed design and construction. ECI has required the designers and the contractors to work together to reach a design with a confidently obtained price and timeline, working as one single integrated team, with the same objectives and the same BIM culture.
This gave an opportunity for the teams to come together at an early stage to discuss data structures, strategies, systems and procedures as a holistic workflow rather than considering design and construction separately. On more traditional projects, construction teams can find it difficult to utilise design information effectively as it has not been produced with construction activities in mind and has not been structured effectively for upstream processes. The ECI phase helped to mitigate these issues from the past and has enabled much of the work done to date.
The SCS Integrated Project Team is responsible for the southern section of High Speed Two (HS2) Phase One – Lots S1 and S2 (Area South) – which includes the Northolt Tunnels and the Euston Tunnel and Approaches.
Lots S1 and S2 span the first 26km of the route, starting from a renewed Euston Station, in central London. It is a very complex part of the project with lots of interfaces through Central London with other HS2 contracts and existing infrastructure such as Network Rail, London Underground, TFL and utilities. The route includes 20km of twin bored tunnels, six ventilation shafts, five bridges, two portals and around 5km of open route, before transitioning into the central HS2 Phase One Main Works Civils Contracts (MWCCs) Lots C1-C3.
The nature of the project, and the push from the client for all joint ventures to operate in a collaborative manner with a “One Team” mentality, created the rich background for all this innovation to happen. Even though the core project office in London, the SCS and Design House teams comprise six companies from four different countries working from seven project offices around the world, with more than 59 nationalities being represented in the workforce. The challenge is to make us all speak in the same language, and that language is BIM.
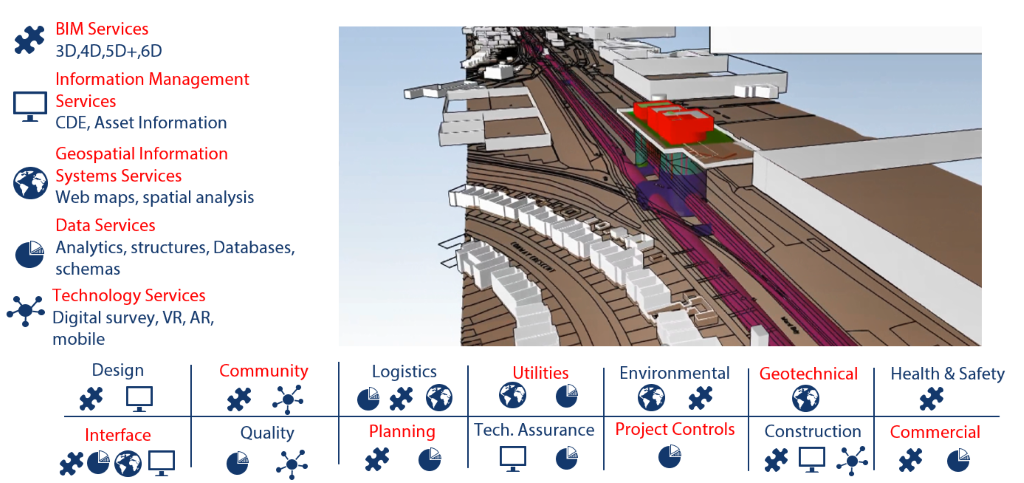
The services that the BIM Team is carrying out for the project (figure 1) include traditional information modelling tasks such as 4D and 5D, digital information management tasks such as set up and configuration of the common data environments, data reporting and analytics, Geospatial information systems or GIS on the project and then emerging technology such as mobile devices and applications, and augmented reality.
On previous projects the team has used one or two of these workstreams, but due to the size and the commitment of HS2 to digital, this allowed a team to be built with capabilities to enhance the processes of most of the project functions. This covers more traditional disciplines such as design and construction but includes members from the community engagement teams where the use of VR and 4D has assisted stakeholders in understanding the works and quality where the use of mobile databases has improved their collection of data from site.
The highly specialised BIM Team has successfully adopted an integrated approach between the designers and the contractors BIM Teams. Each one has different responsibilities, giving support to their own organisations, but working as a single unified integrated team. Promoting such a collaborative culture has been key to developing and implementing this beneficial digital approach. On the project, the term BIM has become synonymous with digital transformation, and thus goes beyond the BIM framework in many cases.
BIM framework and beyond
This project is carried out within the AEC (Architectural Engineering and Construction) industry framework established when, in 2016, the UK Government Construction Strategy [1], also known as the “BIM Mandate” was put in place. This strategy was launched with the aim of reducing the infrastructure or building costs throughout their whole lifecycle, placing the spotlight on the operation expenses – Opex – which is where the costs (and therefore, the potential savings from using this methodology) are higher. This government initiative mandates that all projects managed by the public administration must be developed in a collaborative manner, based on information models, and complying with what is stipulated as Level 2 BIM Maturity.
Although there is still ongoing debate within the industry as to what exactly Level 2 BIM Maturity means, there is general consensus around the core principles:
- originators produce and control information models using discipline-based software and proprietary databases;
- the information exchange process and protocol must be agreed in advance, developed in accordance to the available guidance (such as PAS 1192:2).[2];
- the Employer Information Requirements have to be clear and should help the suppliers understand their needs;
- there should be a BIM Protocol, a BIM Execution Plan and a Common Data Environment, all to deliver a coordinated graphical and non-graphical project information model to the employer for use in asset management.
Inception
Looking back to 2016, during the tender stage of the project, all of the bidding joint ventures were asked to provide evidence of their BIM approach by developing one exemplar project per lot to a scheme design definition, using BIM models as vehicles for the design, and treating them as robustly as an actual project. This gave the SCS and Design House combined BIM Team the chance to perform a “Digital Rehearsal”: testing systems, processes, procedures, exploring the capabilities of interconnected pieces of software, and pushing the limits of what had been done in the past. This pool of ideas and past experiences, together with the will to change the industry is what caused the spark.
After it was all done and the dust settled and prior to contract award, several full-day sessions of lessons learnt were held with people from very varied backgrounds within the project team (spanning from BIM modellers to designers, from project managers to planners and estimators) with the intention of coldly looking at the methods used, not taking anything for granted, and going even further on the next stages of the project.
The work begins
After the contract award, one of the first steps of this continuing process was to exhaustively process the Employer Information Requirements, ample and demanding as they were, and translate them into a set of measurable and enforceable objectives. This was done through long hours of planning and, basically, writing everything down:
- a BIM execution plan to agree, plan and record all the methods and processes for their implementation across the project team.
- a Model Production and Delivery Table (MPDT) to plan and describe what model elements will be delivered, when, by whom (and to what level of development) and the mechanisms by which data is transferred between parties.
- a solid model breakdown strategy aligned with the projects asset structure that follows the common principle “model as you will build” while allowing for a more efficient management of the modelled information.
- a content plan that drives the bespoke library available for the project, to ensure that the modelled elements are consistent across all teams.
- a Managed Workspace within ProjectWise to ensure that the models are created in a consistent way full of data, considering every modelled object as a row of data on our database.
- a LOD Definition Matrix to describe the agreed Level of Development (graphical detail and non-graphical information) and, aligned to the design programme, capture and record the progressive development of the models to inform the wider teams.
- all these concepts are captured, developed and explained in the project BIM guidelines, the reference document that ensures a consistent approach to modelling and information management right first time.
The complexity of the information requirements demands a very high level of control of the technical outputs (models, drawings, databases, etc), so the “traditional” approach – using standardised content, trusting existing or external databases, going with software defaults –wouldn’t suffice. A totally custom live working environment for the tools to be used was created. This ensures that the user creating the models can only pick elements approved by a dedicated part of the BIM Team, in charge of content. This team has procedures put in place to agree on what information exists in the model elements and how it is going to be consumed.
A plan was set out to incrementally add information to the model elements, so that at given milestones, everyone in production (upstream) is aware of what information needs to be in the model, and everyone that consumes the data (downstream) is aware of what information exists and where, and what can and cannot be done with it.
This simultaneous high-level and low-level approach was implemented because it ensured consistency. The data informs and powers all processes that were agreed at the beginning, because it is absolutely consistent, coherent and advanced incrementally throughout the project. This was the driving factor when designing the system, setting out the processes, and building our workspace.
Building the machine
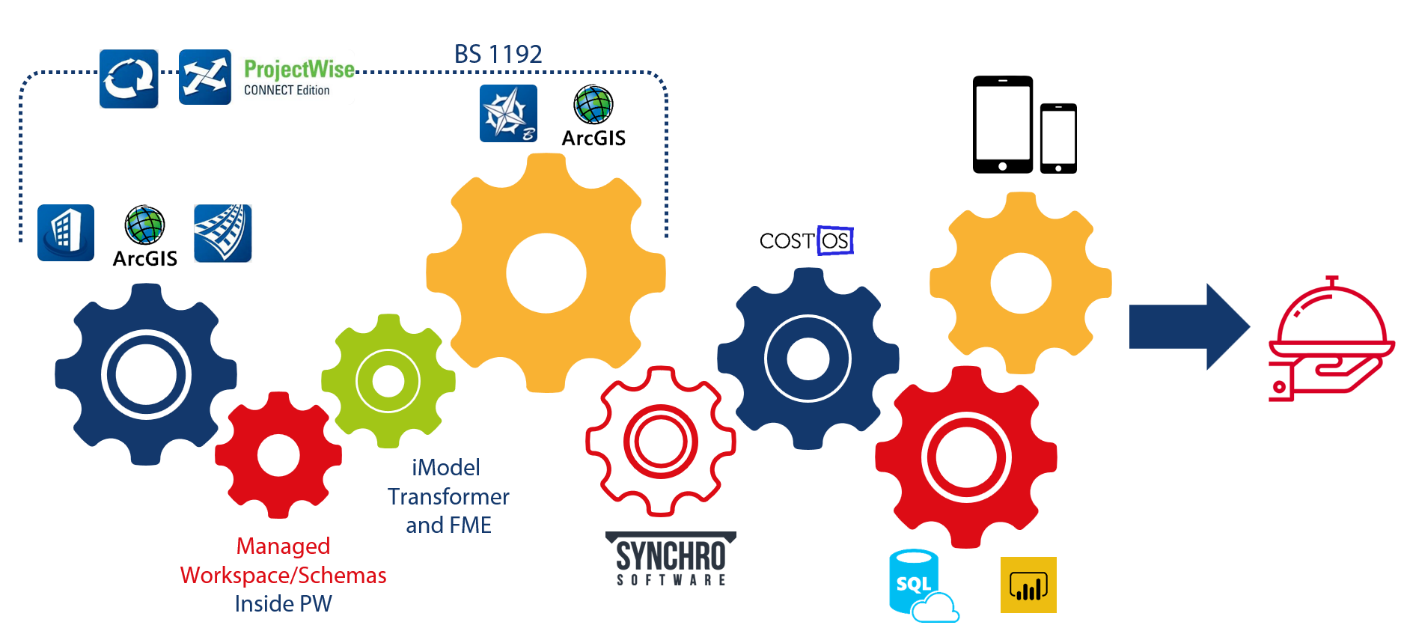
Consistency was also a very important driver when selecting the pieces for the software “machinery” of the project. The use of Bentley software family for production allows the tools to share their supporting environments and workspaces and store all live information in the central document system managed by ProjectWise.
The models then go through automated processes with the help of I-model Transformer, to be consumed later by Synchro (to connect design models and the P6 programme) and CostOS (to extract quantities and effectively estimate from the models). Producing all design models from the same software suite ensures exchange formats and conversions can be avoided, which are usually very difficult to deal with while preserving high levels of information consistency and allow the team to have an invaluable control over the outputs.
Cold hard numbers and the BIM data lake
Moving from a traditional to a more data-centric way of working means that storing the data generated becomes more critical. Whilst large excel files were originally used on the project – these quickly became unsustainable and unmanageable with errors being found when merging and other queries were being completed. Most other industries (finance, automotive, aerospace, retail, etc) utilise relational databasing software to manage vast datasets – so this seemed the logical choice on the project.
Although the use of databases outside of specific software is not common on construction projects, this project has invested heavily on IT to support the delivery and that infrastructure was able to be leveraged for this task. Using an Azure SQL instance improved reliability and accessibility greatly. To manage the data, a few differing ETL (extract, transform, load) tools have been utilised, which include the I-model transformer and FME (Feature Manipulation Engine).
The BIM Data Lake contains all of the model data which is delivered from the design, including all revisions (to allow comparisons) in two separate flat tables – one for Work in Progress (WIP) information and one for assured information. This partition was important and added once the project realised that only the highest quality approved information should be present in the Production Datasource due to the integration that was planned into various other systems in the IT architecture. Any errors in the data would compromise other systems and activities.
Whilst the use of flat tables is not the most efficient from a data point of view, the performance to date has been highly acceptable with nearly 100,000 data entries and around 7 million data points currently. This is expected to grow to around 500,000 entries for detailed design and construction. The benefits of the flat tables include easy to mine and generate reports, and a simplified data modelling structure for internal teams and external vendors.
The integration with other systems and applications becomes much simpler. The team effectively does this complex step for the vendor in question and then all that is required is connections into SQL tables – something that is a very common and simple process from an IT point of view. From a resourcing point of view, it is important to have team members with the relevant skills. Traditionally, SQL or DBA skills would exclusively reside in the IT teams, whilst now with newer graduates doing digital engineering degrees or similar, these types of skills are more available. It is important to realise the value that one or two of these skills can bring to an entire team or project, and more should be done to elevate these skills in the industry.
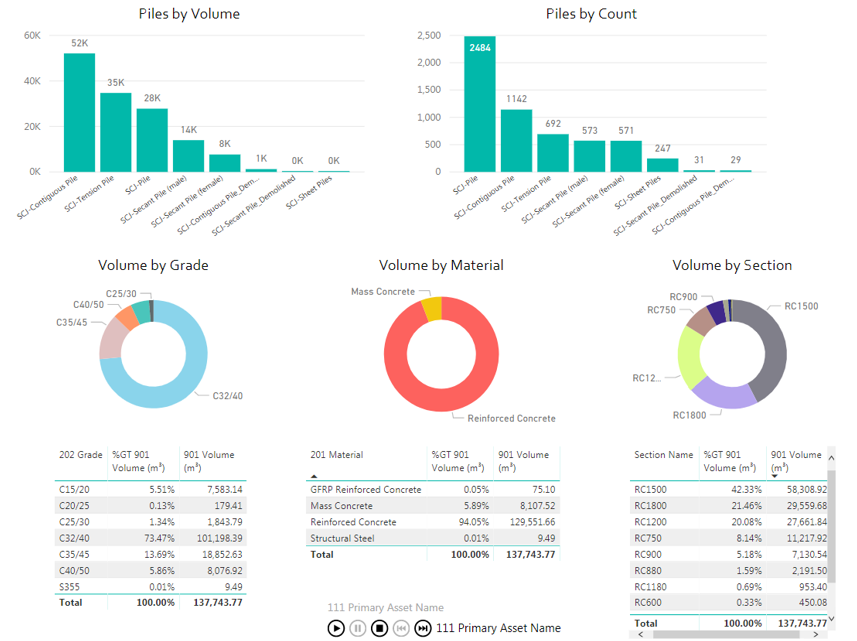
The project has utilised data analysis tools such as PowerBI (see figure 5) to turn this vast amount of data into useful information – a window to the cold hard numbers behind the design. Everyone is able to consume the design information (that originally lives within the models) with the simple access to tailored dashboards that present the data in a very clear and structured way. Therefore, things like understanding all about the piles in an asset (including length, number, diameter, material, reinforcement and grade, amongst others), the volume of excavated material per location, or the amount of reinforced concrete in a given area (per construction element and type), become business as usual.
The team has found the use of PowerBI to be a great asset as it is highly intuitive and scalable – information can be viewed at the project level and then drilled down into individual items as necessary. This macro and micro view of information allows decisions to be made much faster than before and using information which is near real-time.
With the use of PowerBI and the Data Lakes adopted by the BIM Team, these concepts have started to be adopted into many other departments within the project such as Commercial Reporting, Procurement and Planning. It is an example of where the digital teams act as the pioneers of using new and emerging technologies which can be seen to add value and benefit for other teams to embrace.
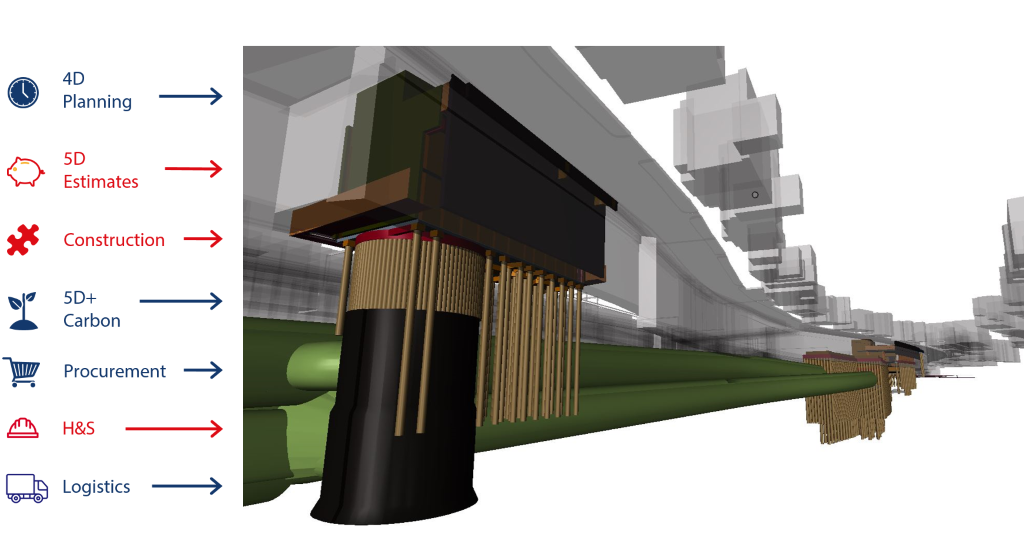
Adding time and cost – the 5D+ concept
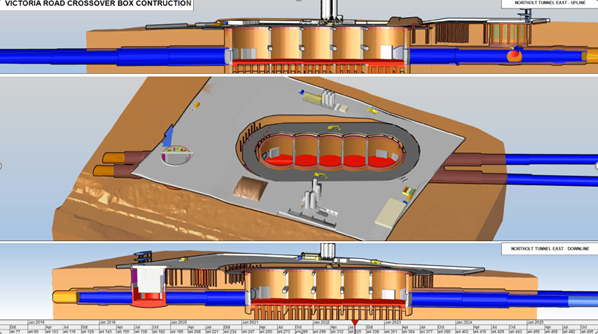
Following the same logic, the models are structured and segregated just like the actual asset is going to be built, which has allowed analysis of the construction timeline using 4D sequencing (see figure 6) to a deep level of detail, identifying future clashes and issues months before hitting the site, and facilitating timely design decision making, avoiding difficulties in the future.
To assist with integration of various data sets across the project (e.g. design, program and cost) it was necessary for the BIM Team to be present and consult other teams when setting up of their data structures. It is common on projects to have misaligned mappings between data structures and this means that data integration becomes incredibly difficult if not impossible. As such, the BIM Team was fundamental in the setup of the project Work Breakdown Structure (WBS) with the planning team and the Cost Breakdown Structure (CBS) with the estimators. This was done within the Project Controls function – where the alignment of BIM and project data synergises well with being involved at the early stage with these teams and being seen as the ‘custodian’ of any work done around data structures has helped the project with its integration. As the project moves into construction the use of these tools and the data will be leveraged to ensure that the project is progressing on time and on budget.
In addition, having consistent information at the centre of the process enables a direct correlation between areas of the project that traditionally remained isolated, working from different sets of information. Typically, the teams in charge of design, cost and carbon footprint will work in a siloed approach, with their assumptions and their baseline information invisible to each other. Ensuring all these processes are powered by the design data and making it easy for the teams to use and communicate with has enabled a streamlined and efficient 5D+ approach.
The effective use of 5D (extracting cost and quantity data from the models) on the project was something that was identified as a major use case at the tender stage. Not only was 5D required as part of the works information, it was also an area in that the parent companies had been putting a lot of effort and development into as well. HS2 was chosen at an early stage to develop the processes and tools. The 5D process requires models of the highest quality in order to work effectively. As the estimate and, subsequently, the price is intrinsically linked to the information models, any errors that are found within them would be enhanced and can mean the estimate is incorrect.
Estimating as a whole is quite traditional in its approach, therefore, any issues or errors were highlighted in more detail than other errors in information. It took many months to gain the trust of the estimating function to rely on the models rather than the traditional drawings. This trust was gained by embedding BIM resource into the commercial function, so that they were in control of the process and the resources and by proving time and again that the quantities extracted were highly accurate , the bills could be generated very quickly, which was important as the estimating function was under huge time constraints. Over a period of around 6 months the estimators became more comfortable with this newer way of working – but it was a slow process to change the traditional approach.
Although in the final iterations the process was not fully optimised, the estimating on the whole was still done outside of the chosen software platform. The bills were exported out of CostOS into CANDY for pricing. This introduced extra time and extra risk from a quality point of view. Even with this inefficiency, it was estimated that the 5D approach saved 80% less in terms of time and resources. The direct works were able to be estimated with a team of two people, when a team of 12 had been earmarked at the beginning of the project – a large saving in terms of people.
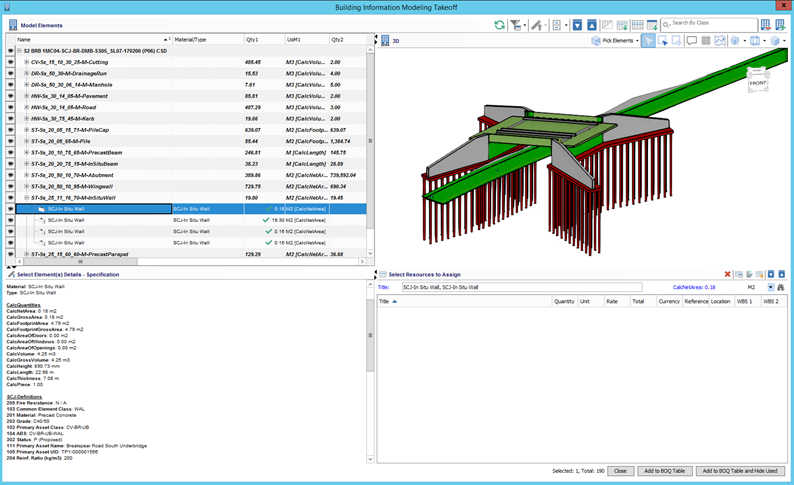
To estimate effectively from the models, a slightly different approach had to be adopted. Firstly, CostOS was chosen as a centralised platform for all take offs and BoQ (Bill of Quantities) generation. Traditionally, estimating functions do not enjoy working in a common platform as they use specific idiosyncrasy in their work which is understandable but not conducive to estimating in a large team and project. The adoption of a single platform enabled a common resource library to be worked from and as a cloud based system – allowing multiple users to work with updates fed between collaborators in near real time.
From the pure take-off side, an object based approach was taken rather than a trade based one, allowing information to be extracted from the model objects effectively (see figure 7). A lot of scripting within the system was done at the start to enable quantities and bill to be generated quickly. The standardised schema and custom definitions allowed for these scripts to be used on any element from any model. Automation is highly reliant on data quality and the estimating process was a key element on requiring a standardised schema on the job. The scripting relied on a few key attributes to ‘trigger’ a component take-off which was embedded within the CostOS system.
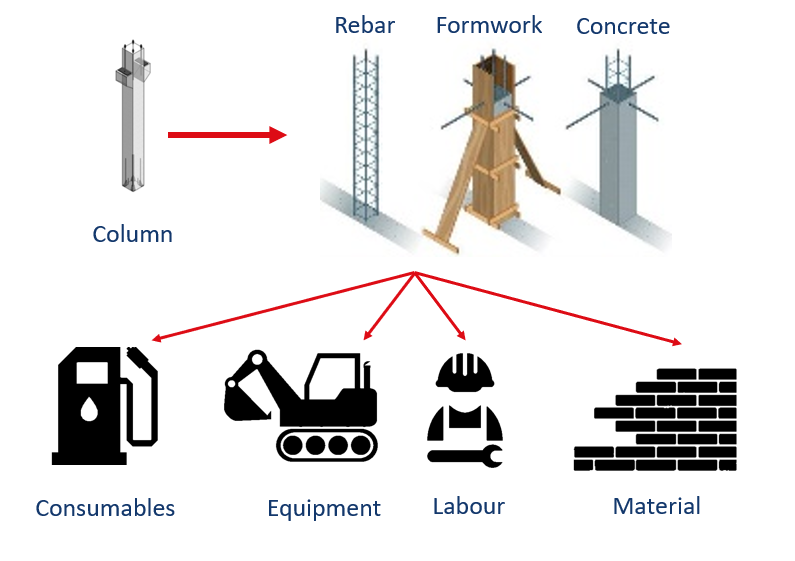
Take for example a slab element, the system would recognise that the slab element was that from the Uniclass classification code present in the attributes – this would then trigger a take-off of a slab element where the formulas would work out formwork, volumes, etc, required from geometry attributes, the material, reinforcement ratio and grade from design attributes and the asset classification and codes from the common attributes. The CESMM (Civil Engineering Standard Method of Measurement) code was applied within the system with a mapping between Uniclass 2015 and CESMM. As such, not everything needed to be present inside the model as information. A few key attributes were relied upon and ensured that they were as consistent as possible.
The 5D+ approach was adopted as it was understood at an early stage that carbon could be estimated effectively from the consistent bills that had been produced. The + was adopted rather than in other cases where carbon estimating can be referred to as 7D or another dimension. From the SCS perspective this adds to the estimating process – hence the ‘+’.
Similarly to the estimating method, this was approached with scripting, alignment of libraries and formulas rather than embedding many more properties and attributes within modelled objects. With the mapping of the three core classification schemas: Uniclass 2015 for design, CESMM for estimating and the Carbon library (based on HS2 data supplemented with the University of Bath carbon dataset) allowed the information to flow between these discreet disciplines and for impacts and analysis to be generated quickly.
Whilst the approach and methodology of the carbon estimating could be further improved over time – even with a non-optimised process, the carbon estimating was able to be produced in around 75% less time than the traditional approach with far fewer errors, so it can be seen as an effective process. Carbon calculations are normally only possible using highly skilled and rare resources within the industry – so again optimising the process is important due to the scarcity of good people available in the industry.
GIS – location is the common language
Geospatial Information Systems or Science (GIS) has been used on the project since the tender and makes up a core component of the digital domain on the project. The parent companies from both a design and construction point of view have been investing heavily in GIS over the last eight years, and therefore had the capability and the resources to support GIS on a project of this scale. As with the BIM domain, the GIS processes are split dependent on the design or contractor tasks that are at hand. The designers have been using GIS for specific tasks to enable the design of the route – this included the use of analysing utility and building GIS datasets provided by the utility owners in the production of the Ground Movement Assessment (GMA) reports for the settlement of the tunnelling activities. Due to the number of assets affected and the extent of the route, this was a highly efficient process – originally deployed on Crossrail and optimised on HS2.
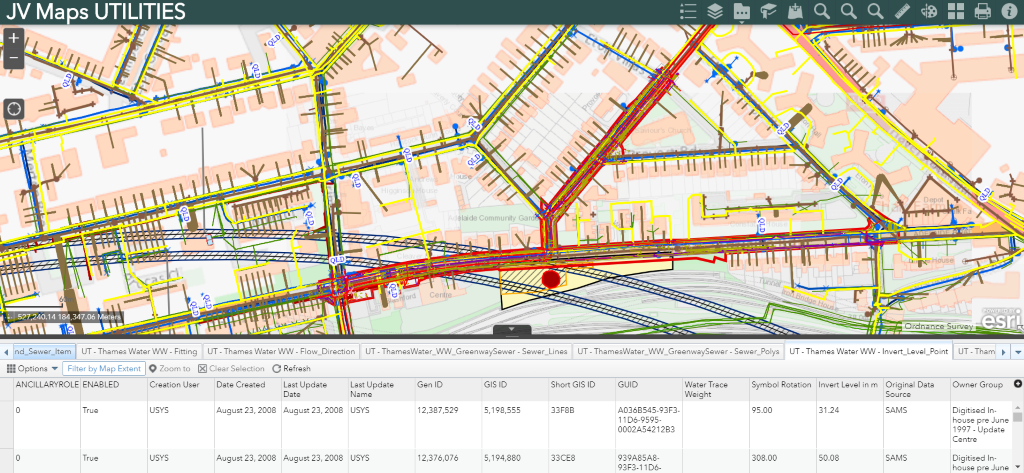
The Contractors GIS team is responsible for the administration and upkeep of the main GIS platform on the project – JV maps which is an Esri Arc GIS enterprise solution. Multiple web maps (see figure 9) have been deployed, each with a specific theme, with tailored datasets dependent on the function. Currently there are web maps for Community Engagement, Logistics, Utilities, Environment, Geology, Third Party Assets and a General web map. The use of the web maps has been a major success on the project due to its ease of use. Whilst some members of the team struggle to utilise modelling review tools or analytical tools such as Power BI, the Arc GIS interface and the familiarity with other GIS software (e.g. Google Maps) have made it very easy to use and interact with. As such, the web maps have around 500 active users as the information presented is useful across all project teams rather than just for engineering and construction.
The transformation of the utilities team over the course of the project has been an interesting one to observe – and this has been correlated with the adoption of GIS into the team. This area of the project has a huge challenge with interfaces with roughly 7000 utility assets from 12 different utility suppliers. Whilst information management has been improved over the last five years from the utilities point of view – it still remains a traditional discipline at its core.
At the beginning of the project the team were one of the lowest in terms of adoption of any digitisation techniques. With the aforementioned GMA’s being produced in GIS however, it forced the team into looking at the information from those assessments in a different light. And once the team realised that this new method was in fact simple to use, required no real training and was faster than the traditional approach the team moved to using GIS for nearly all of their day-to-day work. This adoption was accelerated with a member of the BIM Team who was embedded for approximately 18 months in the utilities team. This member could help with solving issues, but from a wider digital point of view – assisting using BIM, GIS and other digital manipulation tools.
This notion of team embedment to bring adoption seems to be an effective way rather than having dedicated ‘BIM’ or ‘Digital’ teams based on the use cases that SCS has experienced. With the widespread adoption of GIS in the utility team, it now forms an integral part of the day-to-day work and have built internal processes such as the Digital Permit to Dig solution which uses GIS data and Esri mobile applications at its core to run. This solution would not have been possible to implement until the utility team changed their previous methods and moved to a more data-centric way of working.
Mobile technology for digitisation of inspection and test plans
From the earliest stages of the tender it was known that the team wanted to digitise the Inspection and Test Plan (ITP) procedure and associated quality check sheets. The notion of using mobile technology to gather information from site is nothing new and has been adopted on multiple projects through the years. However, HS2 offered up an opportunity for the team to integrate how this was done much more effectively with the data model – this concept had not been tested to any detail previously.
The quality team created a detailed set of requirements and processes which the chosen software solution was to operate to – and it quickly became apparent that there were no solutions on the market that would satisfy the vison or requirements (see figure 10). As such, a lengthy procurement program was put together with several vendors being asked to present a ‘Case Study’. A pitch then followed from a shortlist, and then two suppliers were chosen to take part in a month-long ‘paid pilot’ where a virtual asset was constructed. The winner of this from a team of stakeholders is now developed on the project.
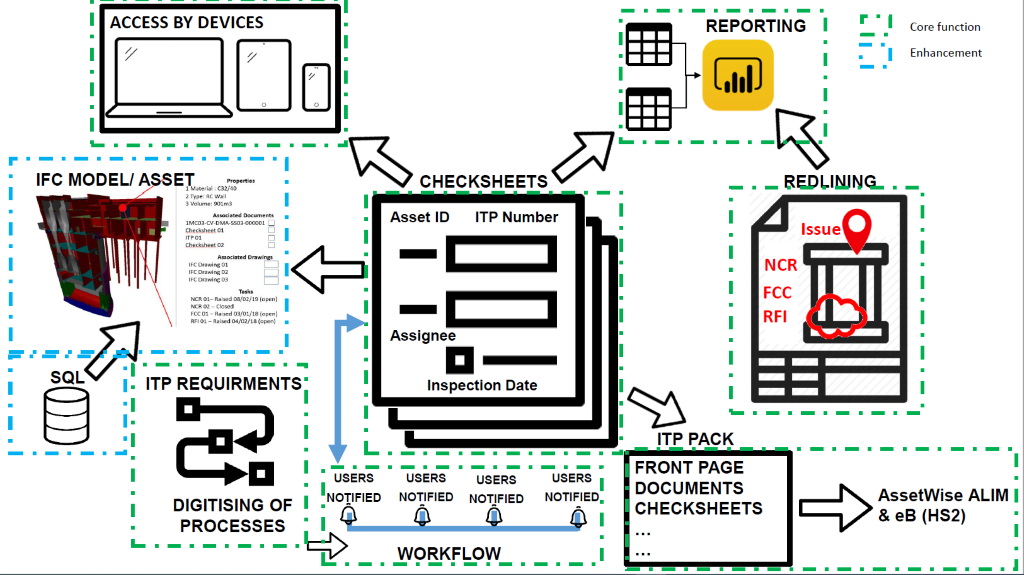
Again, the ECI phase helped to facilitate and guide this strategy where each modelled object became an ‘asset’ which essentially became a record in the database, with the quality reports being related to that data record. The use of the models as the ‘interface’ to create this relationship was a key component and the use of the data lake is the common area where all the information is drawn from.
One of the major benefits that was found with using these techniques is that the information relating to a component can be ‘pre-populated’ onto the check sheets, meaning that the site operative does not need to spend time inputting data. This also improves the quality of the data from site, as there are less errors with manual data entry. The data lake contains upward of 7 million datapoints – and the mantra has always been to repurpose this rich information in as many systems and styles as possible.
Although the digitisation of the ITP has been seen as high value, there are many more applications of mobile technology that will be deployed on the project going forward including permitting, site communication, red lining, as builts and management of temporary works.
A digital blueprint
So far, it is too early to say if what is being achieved in this project now will ever become a legacy, a “Digital Blueprint” for the industry and wider society. A significant number of benefits have been realised on the project to date, through the use of this methodology:
- having a single source of truth that allows information to be produced once, but re-used many times;
- being able to assess the impact of any change quickly and accurately;
- technology and processes that allow the team to work more efficiently;
- and many others.

But what SCS and the Design House are really proud of is that the team’s holistic understanding of what BIM can do and the One Team mentality are already starting to impact the industry: the contractor and designer-combined BIM Team has received high recognition from within the wider project team, and HS2, and have been awarded several external awards including The Year in Infrastructure 2018 award in the ‘Innovation in Rail and Transit’ category, The Esri Award for Map Creation 2018 and two awards in the London Construction Awards 2019 for Digital Engineering and Innovation of the Year. Furthermore, a collaboration with the National College for High Speed Rail has been started with the intention to train the next generation of industry professionals, by providing lectures about BIM within the growing railway education community and across the world at digital events.
And, even now, four years after all this started, there is the feeling that this is only just the beginning.
Acknowledgements
The authors would like to acknowledge the contribution of Alex Beredimas, Ireneusz Kisilewicz, Chris Warner, Roberto Saramago, George Floros, Peter Dorrell, Peter Brady, Mikel Bastida, Sue Hyde, and the rest of the members of the integrated SCS-DH BIM Team.
Special gratitude to Lynn Hiel, Maciej Kindler and Enrique Fernández for their determination, energy and enthusiastic support since the very start of this long journey.
References
[1] Government Construction Strategy (May 2011) and Government Construction Strategy 2016-20 (March 2016)
[2] The British Standards Institution (2013). PAS 1192-2:2013 Specification for information management for the capital/delivery phase of construction projects using building information modelling – BSI Standards Limited 2013
Peer review
- Alex HulstonCad Specification Manager, HS2 Ltd