Aerodynamic design of HS2 tunnels
The aerodynamic design of HS2 tunnels has been achieved through balancing the civils design with the specification of the required aerodynamic characteristics of the rolling stock, resulting in smaller, more economic tunnel cross-sectional areas than would be provided in other countries for the same line speeds. Issues considered include aural comfort and safety for passengers and crew, increased drag on the trains, fatigue effects from aerodynamic pressure loading on structures and equipment in the tunnels, and the potential for sonic booms caused by micro-pressure waves emitted from tunnels into the environment. The paper includes a summary of the numerical modelling methods and their validation against scale model testing undertaken specifically for HS2.
The aerodynamic solutions developed for the HS2 tunnels provide a reference for future HSR projects faced with the challenge of combining high line speeds with relatively small tunnel cross-sections. The risk of sonic booms poses a particular challenge due to a cube law relation with train speed, meaning that the tunnel entrance hood designs used in other countries to mitigate these would be insufficient. HS2’s novel tapered form of tunnel entrance hoods will be of particular interest to future high-speed rail projects with similarly high line speeds.
- Written by
-
Richard Sturt

-
Colin Rawlings (HS2 Ltd/Jacobs Engineering Ltd)

-
Paul Lynch

- Resource type
- Resource type: Technical Paper
- Intended audience
- Contractors
- Tags
- tunnel aerodynamics posts
The aerodynamic design of HS2 tunnels has been achieved through balancing the civils design with the specification of the required aerodynamic characteristics of the rolling stock, resulting in smaller, more economic tunnel cross-sectional areas than would be provided in other countries for the same line speeds. Issues considered include aural comfort and safety for passengers and crew, increased drag on the trains, fatigue effects from aerodynamic pressure loading on structures and equipment in the tunnels, and the potential for sonic booms caused by micro-pressure waves emitted from tunnels into the environment. The paper includes a summary of the numerical modelling methods and their validation against scale model testing undertaken specifically for HS2.
The aerodynamic solutions developed for the HS2 tunnels provide a reference for future HSR projects faced with the challenge of combining high line speeds with relatively small tunnel cross-sections. The risk of sonic booms poses a particular challenge due to a cube law relation with train speed, meaning that the tunnel entrance hood designs used in other countries to mitigate these would be insufficient. HS2’s novel tapered form of tunnel entrance hoods will be of particular interest to future high-speed rail projects with similarly high line speeds.
Introduction
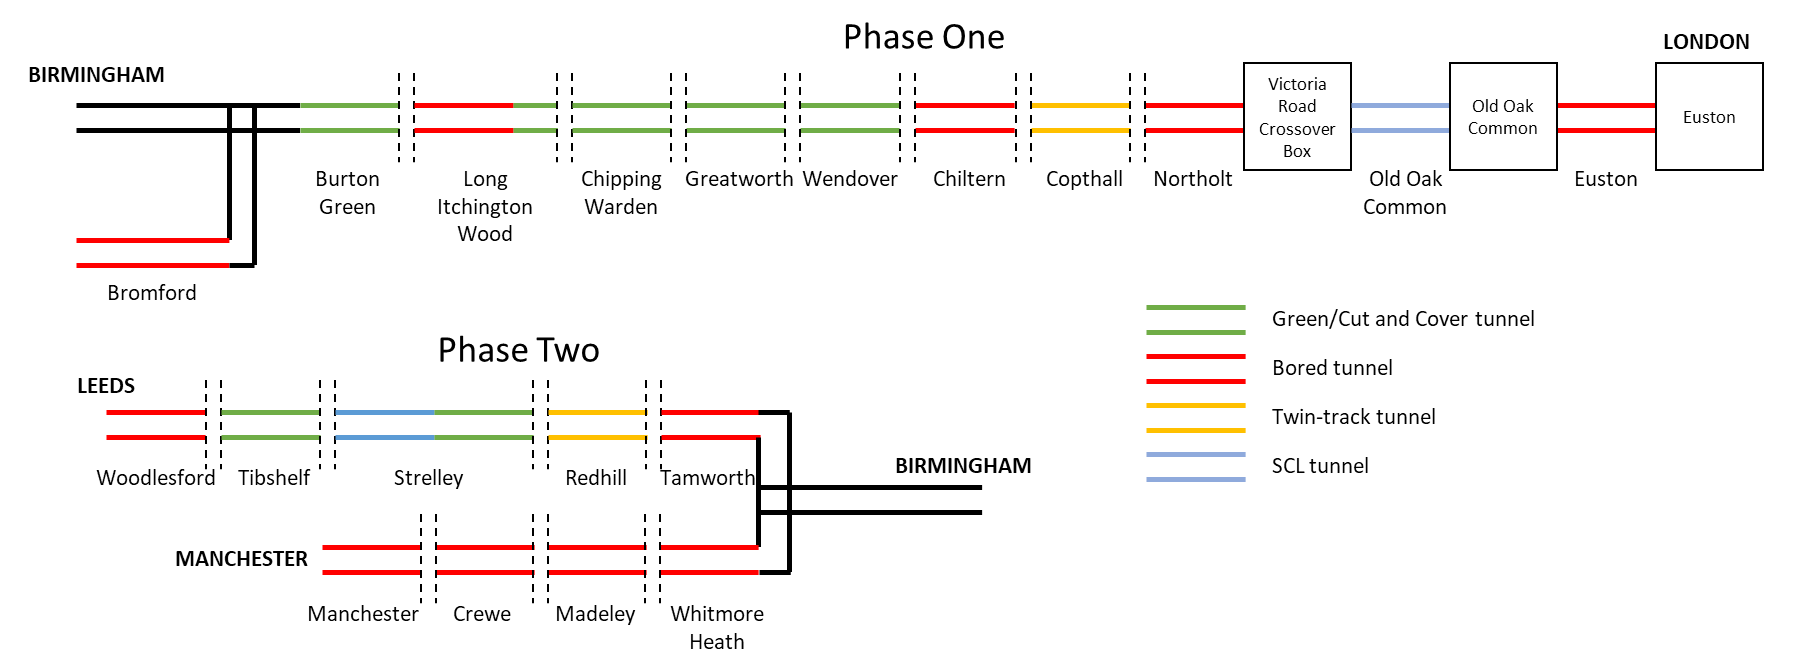
Tunnel aerodynamics are an important factor for High Speed Two (HS2) due to the size and complexity of the project. To put that into context; HS2 Phase One includes 11 tunnels comprising about 20% of the route, see Figure 1 and Table 1. A further nine tunnels (also shown in Figure 1) are also planned for Phase Two; these are still subject to change so are not included in Table 1.
| Tunnel name | Type | Length excl. hoods (km) | Cross-sectional area (m2) | Maximum entry/exit speed used in aerodynamic analysis (km/h) |
|---|---|---|---|---|
|
Euston Tunnel |
Bored, twin tube |
7.3 |
39 |
120 |
|
Old Oak Common Tunnel |
Sprayed concrete primary lining & secondary lining to be determined |
0.3 |
Varies, >39m2 |
160 |
|
Northolt Tunnel |
Bored, twin tube |
13.4 |
46 (5.6 km) 54 (7.8 km) |
160 at Victoria Road Crossover Box 320 Upline entry 300 Downline exit |
|
Copthall Tunnel |
Single-cell twin track cut-and-cover with large openings in the roof at 100m spacing |
0.55 |
106 |
320 |
|
Chiltern Tunnel |
Bored, twin tube |
16.0 |
59 |
320 |
|
Wendover Tunnel |
Two-cell cut-and-cover |
1.2 |
58 |
360 |
|
Greatworth Tunnel |
Two-cell cut-and-cover |
2.5 |
58 |
360 |
|
Chipping Warden Tunnel |
Two-cell cut-and-cover |
2.3 |
58 |
360 |
|
Long Itchington Wood Tunnel |
Bored twin-tube (1.6km) plus two-cell cut-and-cover tunnel (0.3km) |
1.9 |
Bored – 54 Cut-and-cover – varies 68-91 |
360 |
|
Burton Green Tunnel |
Two-cell cut-and-cover |
0.5 |
60 |
360 |
|
Bromford Tunnel |
Bored, twin tube |
5.8 |
39 |
230 |
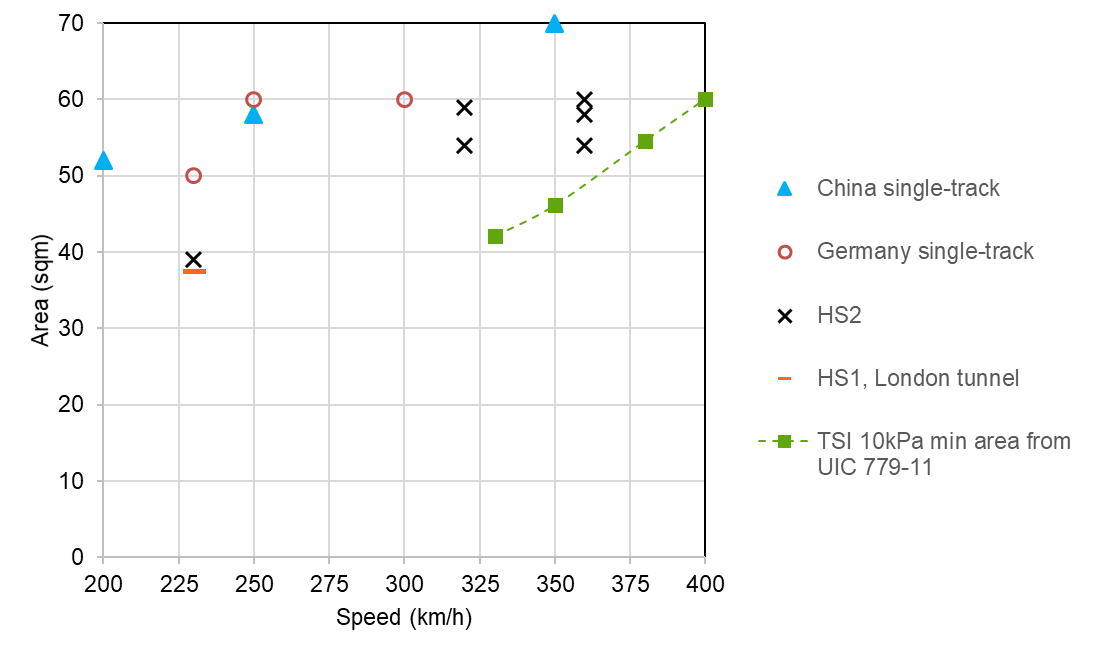
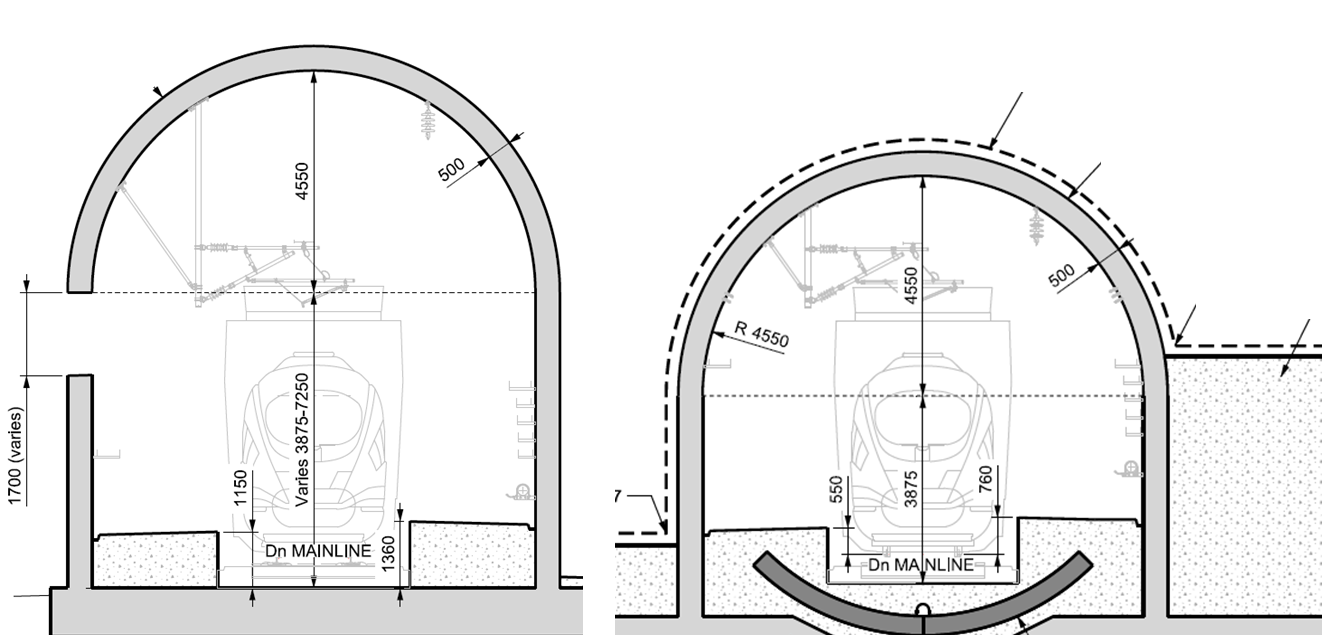
Taking the train speed into consideration, the cross-sectional areas of HS2 tunnels are in general smaller than in other countries, as illustrated in Figure 2. This is a result of a value-engineering process aiming towards an economic tunnel design that accounts for aerodynamic considerations and explains why HS2 cannot simply adopt aerodynamic solutions from HSR systems in Europe or Asia. In total for the Phase One tunnels, using the tunnel sizes in Table 1 rather than the international norms in Figure 2 saves of the order of 1.5Mm3 of tunnel volume, resulting in significant economic and environmental benefits.
To ensure like-for-like comparisons, Figure 2 shows only “single-track” tunnels (twin bore or two-cell). Also shown on the Figure are approximate minimum sizes necessary to pass the TSI 10kPa limit (discussed later under “Aural comfort and safety”), which are based on data in UIC leaflet 779-11 Appendix F[3], assuming the maximum interoperable train size of 12m2. Japanese HSR tunnels are not shown – these are twin-track in a single bore of around 63m2. Arguably, Japanese tunnels are tighter than HS2’s on a per-track basis.
Intervention shafts with emergency ventilation equipment are provided in the long tunnels, but there will be no pressure relief function since bypass shafts exhausting to atmosphere were predicted to exceed noise limits for the noise-sensitive areas in which most of the shafts are located. Furthermore, eliminating the bypass enabled cost savings by reducing the size of the shafts. Track isolation dampers will be closed during normal operation, and the shafts will have no influence on aerodynamics in the tunnels.
Aerodynamic phenomena
Aerodynamic impacts arise primarily from pressure waves. Air in the tunnel near the entrance is rapidly compressed when the nose of a train enters the tunnel, causing a pressure wave to propagate along the tunnel at the speed of sound. Further pressure waves are generated when the tail of a train enters the tunnel, when the nose and tail exit from the tunnel, and when the train passes any change of cross-sectional area within the tunnel. When they reach either end of the tunnel, pressure waves reflect and propagate back in the opposite direction. Together with the pressure reduction that occurs in the air alongside the train, these effects cause a complex pattern of pressure transients throughout the tunnel and around the train.
The magnitude of the initial pressure wave for a given train/tunnel combination is proportional to entry speed squared, and therefore HS2’s high line speeds pose particular aerodynamic challenges. Positive and negative pressures of several kilopascals are expected during the passage of a train through an HS2 tunnel.
Impacts and mitigation
Mitigation of potential aerodynamic impacts has been an important aspect of the design of the tunnels since the inception of the project. In principle, pressure wave impacts can be mitigated by increasing the cross-sectional area of the tunnel, thus reducing pressure wave magnitude, and/or by specifying trains, structures and equipment in the tunnels that can tolerate higher pressures. Increased cross-sectional area results in higher construction cost and environmental impact associated with removal and disposal of excavated material, whereas specifications for trains and equipment that exceed commonly available standards may lead to difficulties and risk with the train procurement. HS2 strikes a balance between these opposing drivers, through tunnel cross-sections that are smaller than for comparable European railways, alongside a rolling stock procurement strategy that calls for aerodynamic performance slightly exceeding European interoperable HST standards whilst still being achievable for modern, high-quality vehicles.
The potential aerodynamic impacts considered in the HS2 tunnel designs are summarised in Table 2.
| Potential impact | Description of impact | Mitigation in HS2 design |
|---|---|---|
|
Aural discomfort for passengers and crew |
Rapid pressure changes inside the trains could cause discomfort in the ears; in extreme cases the ears could be damaged. |
Balance between tunnel cross-sectional area and performance specification for the sealing of the trains |
|
Micro-pressure waves |
Audible “sonic booms” could be emitted from tunnel exits causing environmental impacts and annoyance for nearby residents |
Tunnel entrance hoods (termed “porous portals” in the HS2 design) |
|
Pressure loading on structures, fixed equipment and trains |
Structures such as the dividing walls of twin-cell tunnels, and equipment such as cross-passage doors, experience a differential pressure load |
Structures/equipment are designed/specified to accommodate the aerodynamic pressures, including fatigue effects. |
|
Drag |
There is a “headwind effect” in tunnels which increases drag, leading to increased power requirement and heating of the air in the tunnel. |
Chiltern Tunnel increased to 9.1m internal diameter to mitigate heating effect. |
Organisational approach
Aerodynamics is a system issue creating requirements for the civils design, railway systems and rolling stock. Whereas the performance of the tunnel designs is in most respects the responsibility of the Main Works Civil Contractors (MWCCs), responsibility for aerodynamic performance has been retained by HS2 Ltd due to the specialist nature of the subject and the need for a consistent route-wide and project-wide approach. The aerodynamic requirements for the HS2 tunnels are provided to the MWCCs in terms of geometrical parameters such as cross-sectional areas and the key dimensions of hoods for each tunnel. The HS2 Ltd aerodynamic specialists work collaboratively with MWCCs to ensure that the final designs are in accordance with the aerodynamic concept design, and that any localised changes to meet civil design and construction requirements are acceptable aerodynamically.
For the rolling stock, a performance specification is used to achieve the aerodynamic requirements and to define train parameters that can be assumed in the civils design.
Assessment of Aerodynamic Impact
Subsequent sections of this paper introduce the scale modelling and numerical simulation methods that have been used to quantify the aerodynamic phenomena associated with the specific tunnel designs. Then, further information is provided on treatment and mitigation of each of the types of impact given in Table 2. Particular attention is given in this paper to mitigation of micro-pressure waves, because the design of the HS2 tunnel hoods is expected to be of interest in future HSR tunnel design projects.
Scale model testing
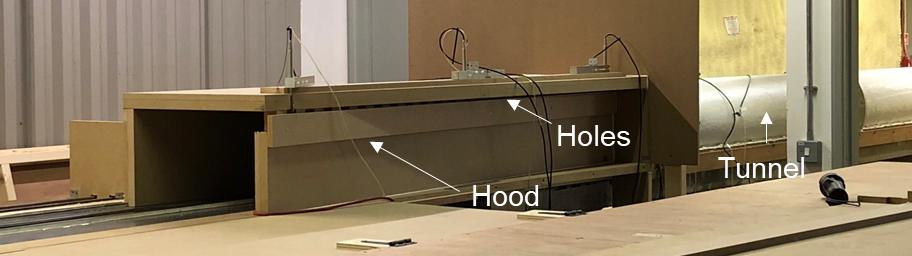
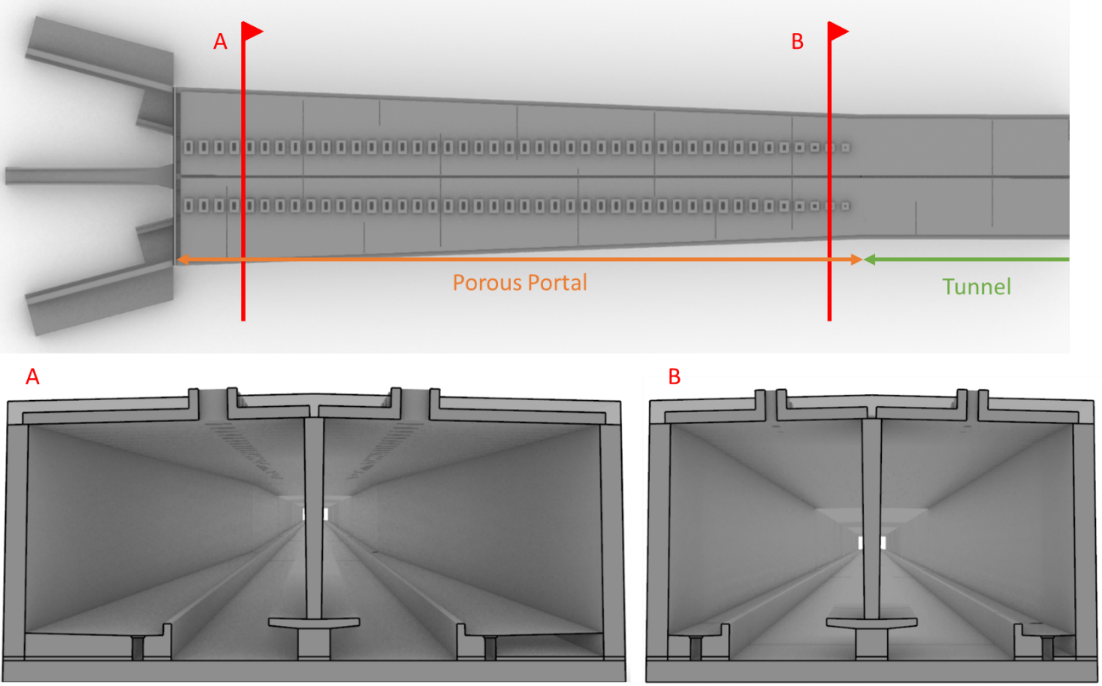
Scale model tests were used to verify that the design concept for the tunnel hoods will work as expected, to identify the optimum hood configuration and hole size, and to calibrate and validate the numerical simulation methods. The testing was commissioned by HS2 and carried out in 2013 and 2019 at the TRAIN (TRansient Aerodynamic INvestigation) rig in Derby by the Birmingham Centre for Railway Research and Education. The rig includes a tunnel onto which scale models of the HS2 hoods were added (see Figure 3). Model trains at 1/25 scale were propelled along a 150m long track by a catapult system at 60 m/s (216 km/h). Tests were carried out with and without hoods and with varying hood configurations and hole sizes. The 2013 tests are described in Sturt et al[4]. Description of the rig may be found in Baker et al[5].
Numerical modelling
Throughout the design process, the aerodynamic phenomena have been subject to extensive numerical modelling. Quantification of the expected phenomena has enabled anticipation and mitigation of potentially problematic issues at an early stage while also ensuring that the developing detailed designs retain the aerodynamic performance of the initial design concepts.
Most tunnel aerodynamics phenomena are essentially one-dimensional – conditions vary significantly only along the tunnel axis direction and not across the width or height – enabling a one-dimensional simulation method to be used. This has the advantage of very fast solution times compared to three-dimensional computational fluid dynamics (CFD). However, certain design details such as the shaft interfaces to the tunnels have been assessed using CFD where a strong three-dimensional effect was anticipated.
Prediction of the pressures in the HS2 tunnels has been carried out using Arup’s in-house software TunX, a one-dimensional compressible unsteady flow simulation package dedicated to modelling air flow in rail tunnels. The air in the tunnel is divided into elements of the order of 1 m long (for full-scale tunnels) and analysed in a time-stepping scheme to predict pressure transients in the tunnel and inside the train.
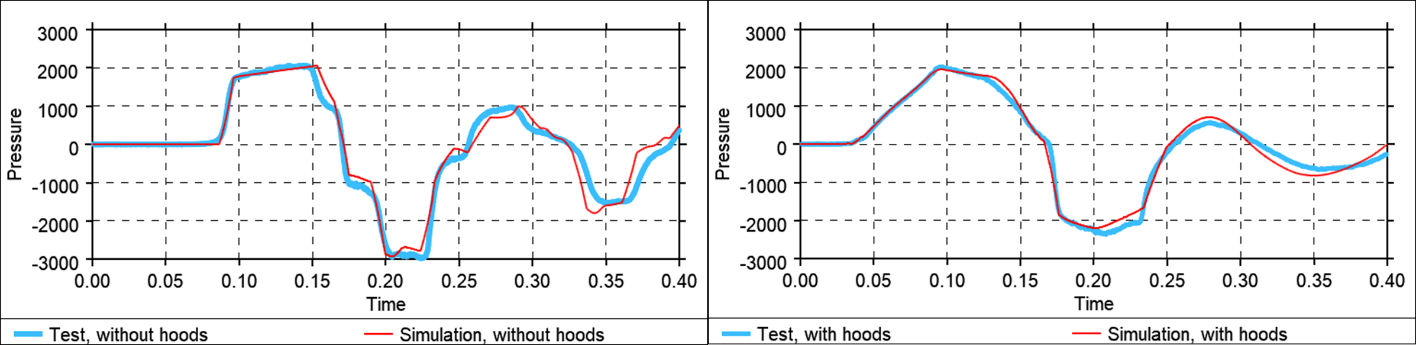
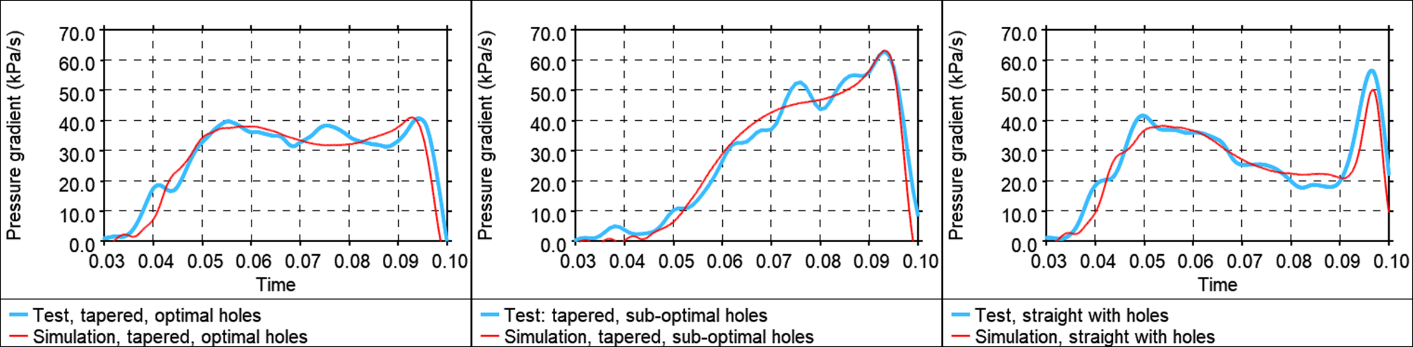
The software has been validated against pressure sensor measurements from scale model tests. Example comparisons between simulation and scale model results are given in Figure 4 (pressure time-histories with and without hood for the whole transit of the train through the model tunnel), and Figure 5 (pressure gradient time-histories showing influence of different hood designs). Further information may be found in Sturt et al[4]. The left-hand graph in Figure 4 demonstrates that the pressure wave phenomena in general, including reflections, are well-captured by the software. The initial pressure wave caused by train entry (up to 0.15 seconds) is simulated well within the 5% accuracy required by Section 7.3.4 of EN 14067-5[6]. The right-hand graph shows that the software can also capture the influence of the hoods on the initial pressure build-up (i.e. the gradient between times 0.05 and 0.1) and subsequent pressure wave behaviour.
When the software is used in the design of the hoods, the key parameter is the peak value of the pressure gradient caused by initial train entry: the lower the initial pressure gradient, the lower the level of micro-pressure wave emissions from the tunnel exit. Figure 5 demonstrates that the software can accurately predict this for a range of hood design parameters.
Note that the results shown are from scale models and simulations of scale models; the pressures and pressure gradients in full-scale HS2 tunnels will not be the same as those shown because the experiment’s train speed and train/tunnel area ratio differed from the full-scale situation. Furthermore, the scaling effect compresses the timescale of the graphs by a factor of 25 (increasing the pressure gradients by a factor of 25) in the reduced-scale model results.
The one-dimensional simulations undertaken during development of the HS2 tunnels use two train model types:
- “HS2 best estimate train”, having a cross-sectional area of 11m2 and other properties (friction coefficient, etc) representative of modern high-speed rolling stock.
- “TSI upper limit interoperable train”, having a cross-sectional area of 12m2 and other properties (friction coefficient, etc) set such that the predicted tunnel-entry pressure wave is at the upper limit permitted by paragraphs 4.2.6.2.1 and 6.2.3.13 of the Rolling Stock TSI[2] (i.e. the largest pressure wave possible for TSI-compliant rolling stock).
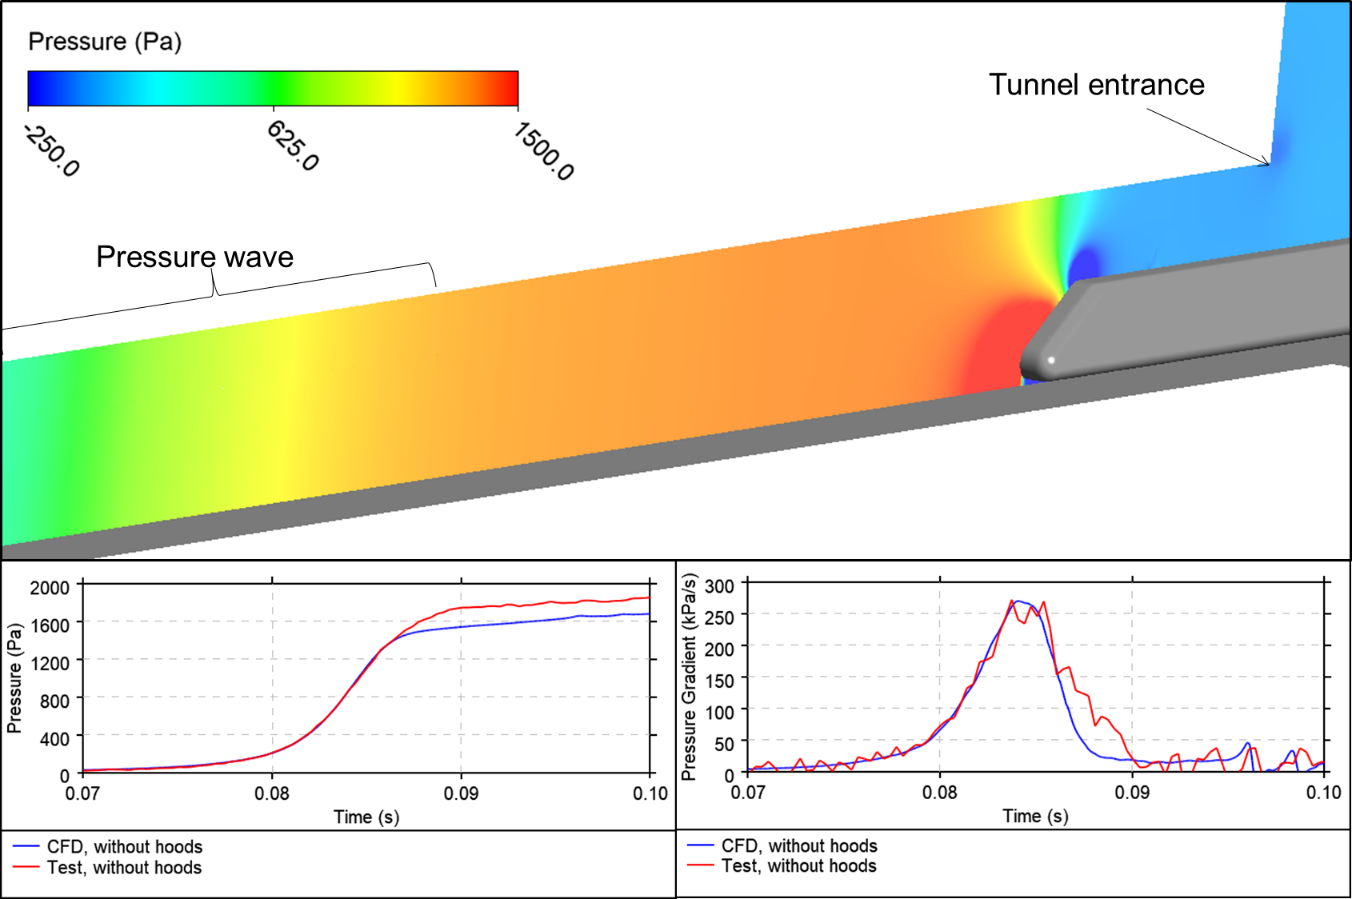
In specific cases where the wave generation mechanism is significantly three-dimensional, predictions of pressure wave gradients from one-dimensional simulations may be overly conservative. In these situations, CFD is used to predict pressure wave gradients. Examples of such situations include entry into tunnels without hoods, or trains passing abrupt changes in the tunnel cross-section. Unsteady, compressible simulations were carried out using Ansys CFX with a generic high-speed train shape defined in prEN 14067-5:2018[6] as a reference for pressure gradient studies. Comparison with a scale model test for train entry at 60 m/s into a tunnel without a hood is shown in Figure 6. The right-hand graph in Figure 6 shows the gradient of the pressure wave, which is the key output from the CFD model and is used in subsequent calculations of micro-pressure wave emissions. An exact match with experiment is not expected, because the reference train shape used in the CFD analysis differs somewhat from the scale model which replicates a proprietary train design. Nevertheless, the key dimensions such as tapering nose length are sufficiently similar to capture the pressure gradient with reasonable accuracy.
Aural comfort & safety
The air pressure in the tunnel outside a high-speed train undergoes a rapid change, often of several kilopascals, each time a pressure wave passes. If passengers and crew were exposed directly to the air in the tunnel, differential pressure across the eardrum would cause high levels of discomfort. High-speed rolling stock is sealed (i.e. designed to minimise air leakage when in tunnels) in order to protect occupants from these effects. Nevertheless, pressure changes still occur inside the trains, albeit to a lesser extent and more slowly than the pressure changes in the tunnel. These pressure changes could potentially cause some discomfort to those passengers who are sensitive to them.
There are two aspects needing consideration in the design of tunnels:
- Comfort of passengers with the sealing system operational. There are no legal limits on this – different criteria are adopted in different countries. Discomfort is strongly influenced by the rate at which pressure changes occur, so criteria are expressed as maximum allowable pressure changes inside the sealed trains within a given time period.
- Avoidance of permanent damage to the ears in the event of failure of the sealing system, such as a broken window. This is covered by a legal requirement in the Infrastructure TSI[1] (“TSI 10 kPa limit”) that forbids pressure changes exceeding 10 kPa peak-to-peak during the transit through the tunnel, applicable at all points along a train, ignoring the sealing system, for any TSI-compliant train running at the maximum line speed. This effectively sets a minimum cross-sectional area for the tunnel, given the train speed.
Compliance with the TSI 10 kPa limit was verified using simulations with a “TSI upper limit interoperable” train model. For twin track (single-cell) tunnels, the simulations include a series of scenarios in which trains pass through the tunnel on the Upline and Downline simultaneously.
Aural comfort for HS2 passengers will be achieved by specifying well-sealed trains. The HS2 Train Technical Specification[7] (TTS) includes the performance requirement shown in Table 3. Simulations with an “HS2 best estimate” train passing through the Phase One tunnels indicate that a sealing time-constant of around 20 seconds will be needed to meet the performance requirement, which is within the range currently achievable by manufacturers.
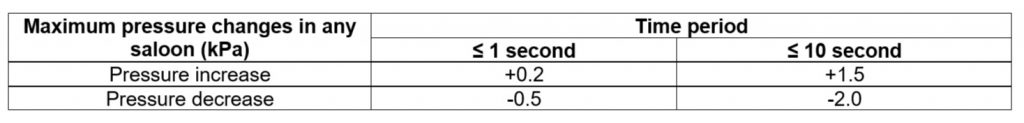
The pressure decrease in the bottom-right cell of Table 3 is approximately the same as would be experienced by a person in a lift travelling up 40 floors of a high-rise building in 10 seconds (note, this comparison relates to air pressure effects only, not to the feeling of vertical acceleration).
Sensitivity to pressure changes varies widely between individuals, so it is not practical to eliminate the potential for aural discomfort entirely. The proportion of people who would find the pressure changes in Table 3 uncomfortable is estimated at around 5-7%, based on research results by Schwanitz et al[8] . As a comparison, the same research results would predict at least 40% of people feeling discomfort when exposed to the 2.5 kPa in 4 seconds deemed acceptable for tunnels on HS1 and the conventional rail network, where aural comfort has historically been limited by poorly-sealed rolling stock.
Furthermore, 5-7% applies in the most-affected carriage, typically towards the rear of the train. Averaged over the length of the train, the proportion is estimated at around 4%. Reducing this proportion by means of civils measures is subject to diminishing returns – for example, increasing the tunnel area by 20% (with consequent additional cost and environmental impact) is estimated to reduce the 4% figure to 2.5%. A similar level of benefit would arise from increasing the train sealing time-constant to 25 seconds, which may be achievable but could limit the choice of rolling stock. Note that the percentages quoted here are based on outcomes of a single research study using healthy volunteers and may not be fully representative of a whole population including people with colds or medical conditions. Nevertheless, they serve to illustrate in principle the relatively small benefit to aural comfort that would arise from larger tunnels.
An unusual feature of the performance requirement is that different limits are given for pressure increases versus decreases. Research (e.g. Schwanitz et al[8]) shows that pressure increases tend to be more uncomfortable than decreases of the same magnitude: apparently, equalisation of pressure in the middle ear occurs more easily when air must be sucked out through the eustachian tube than when it must be blown in.
Although the TTS defines the aural comfort performance in Table 3 with reference to the Phase One twin-cell and twin-bore tunnels, the criteria will in practice also be met in HS2 single-cell twin-track tunnels, even in cases of trains crossing within the tunnel, due to the large cross-sectional area provided for those tunnels.
Micro-pressure waves
A micro-pressure wave (“MPW”) is a pulse of air pressure that is emitted from tunnel portals into the environment whenever a pressure wave within the tunnel is reflected at the tunnel entrance or exit portal. Every railway tunnel in the world emits MPWs caused by train-induced pressure waves. These are generally at frequencies below the audible range and of such small amplitude that they are never noticed. However, MPWs can potentially take the form of so-called “sonic booms” and can be very loud. Such cases have occurred in Japan[9], where nearby residents complained of loud booming noises and rattling windows and shutters. Audible MPW have also occurred in Germany[10]. HS2 tunnels are designed to avoid audible sonic booms, in line with environmental commitments.
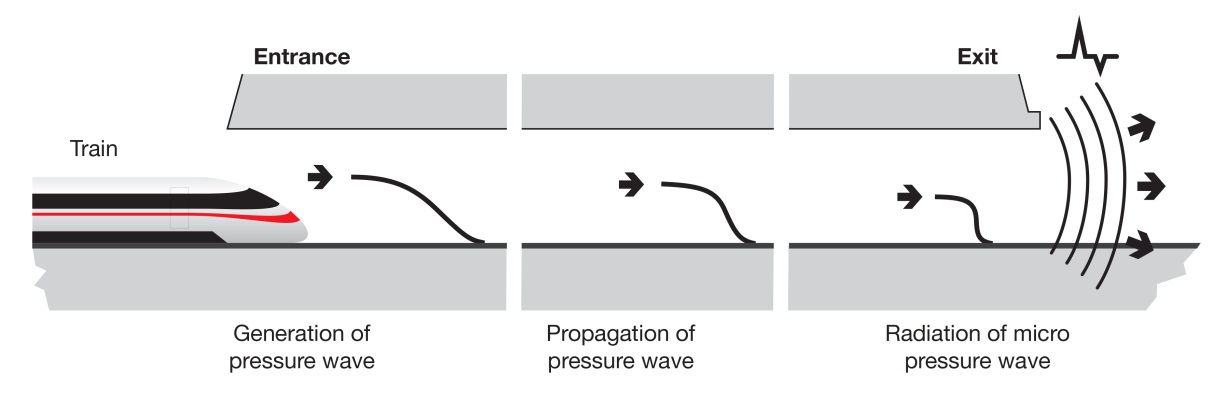
The physics of MPW is described extensively in the literature. Vardy[11] provides a useful introduction. The process is summarised in Figure 7 and consists of: (a) generation of a pressure wave by the train entering the tunnel; (b) steepening of the pressure wave as it propagates along the tunnel (applies to slab-track tunnels, not ballast-track ones); (c) emission of a micro-pressure wave as a by-product of the pressure wave inside the tunnel reflecting at the portal; (d) transmission of the MPW to nearby receptors.
Factors affecting the design of mitigation measures for MPW
The reasoning behind the mitigation measures for HS2 tunnels may be understood from the following points:
- The amplitude of the MPW experienced outside the tunnel depends on the gradient of the pressure wave inside the tunnel as it approaches the tunnel exit (i.e. the rate at which the pressure rises, shown diagrammatically by the steepness of the wave at the right-hand end of Figure 7), and not on the magnitude of the pressure.
- Pressure waves caused by trains entering tunnels are generally the cause of the steepest pressure waves, and hence most likely to cause impactful MPW if no mitigation were provided.
- The principal method of mitigation of MPW is to spread the initial pressure rise over a longer time, thus reducing the gradient of the wave, by providing a “hood” at the tunnel entrance containing carefully-sized holes that control the pressure build-up. The train nose design also influences the gradient of the pressure wave, but the degree of mitigation achievable by this route is small compared to that achievable with hoods. Train nose design alone would be insufficient to mitigate MPW for HS2 tunnels.
- The longer the hood, the lower the pressure gradient that can be achieved. Conversely, the more mitigation is required for a particular tunnel, the longer the hood must be.
- For a given length of hood, the optimum design is taken to be the one producing the lowest pressure gradient associated with train entry.
- The gradient of the pressure wave caused by train entry is proportional to train speed cubed. Hence, the need for mitigation of MPW is greatly influenced by train speed. HS2’s high line speeds lead to a requirement for significantly longer hoods than are typically provided in countries such as France, Germany and Japan. For the same reason, where the line speed is 360 km/h, even the shortest HS2 tunnels are provided with hoods, whereas experience internationally and on High Speed One shows that short tunnels do not require a hood for 300 km/h line speeds.
- As the pressure wave propagates along a slab-track tunnel at the speed of sound, the gradient of the pressure wave gradually increases (“inertial steepening”, shown in Figure 7 by the wave becoming steeper as it moves left to right). This is particular to slab-track tunnels and does not occur with ballasted track. More steepening occurs in longer tunnels, so these are more prone to cause audible MPW than shorter tunnels; hence, longer tunnels require longer hoods.
- After emission of the MPW from the tunnel exit, its amplitude reduces approximately in proportion to the reciprocal of distance from the tunnel. The degree of mitigation required for a particular tunnel (and hence the length of hood at the tunnel entrance) depends on the distance of any existing homes or other sensitive receptors from the planned tunnel exit.
HS2 tunnel designs include hoods at the tunnel exit as well as at the entrance, because HS2 is designed for two-way running on each track. The hoods at the exit end also mitigate MPWs caused by the pressure waves arising when trains exit from the tunnel in the normal operating direction.
Generic HS2 hood design
For the reasons given in the section above, the lengths of hoods in the HS2 design vary from tunnel to tunnel. A generic design (Figure 8) has been developed that can be adapted to the length required while providing performance as close as possible to optimal.
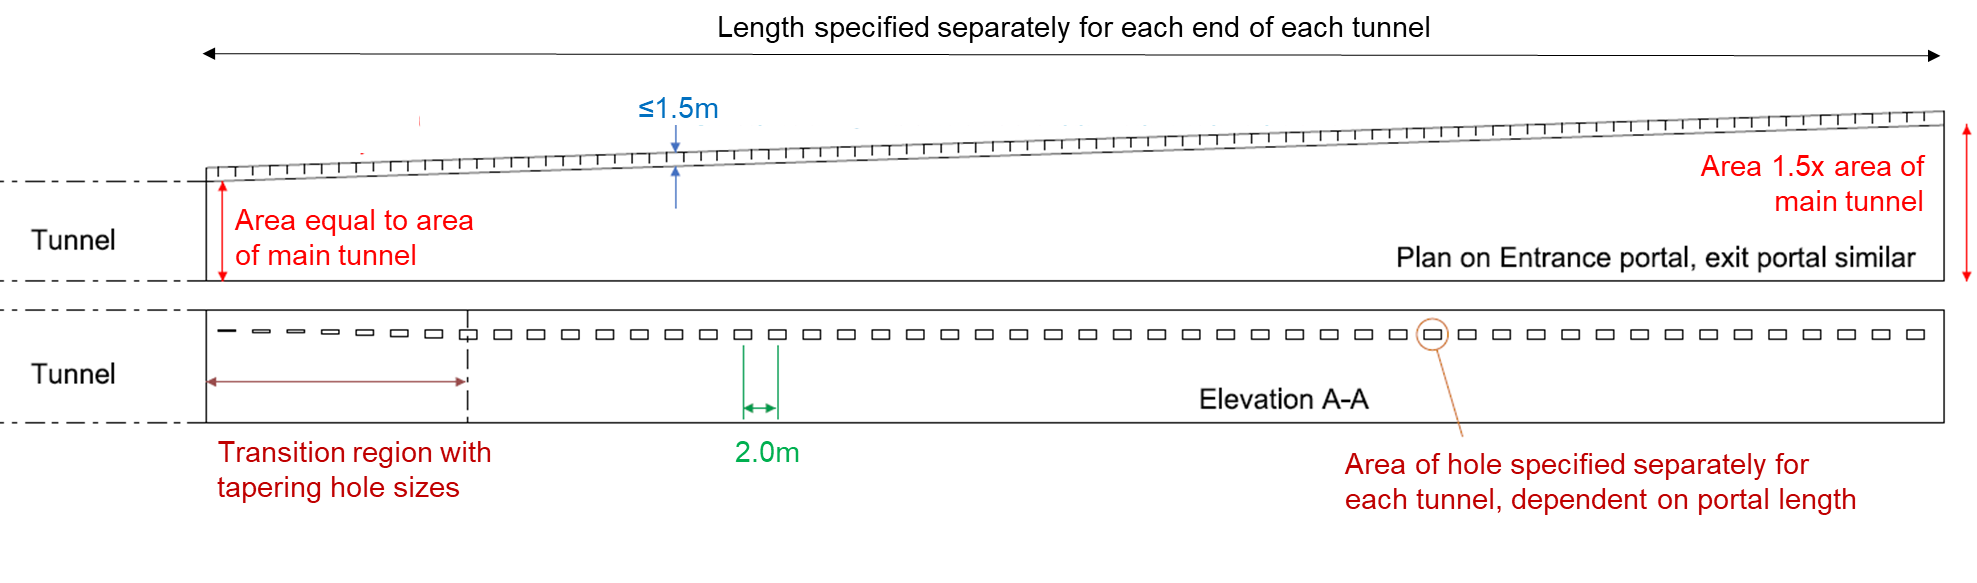
The cross-section shape of the hood is not critical to aerodynamics and can be adapted to suit the construction method provided that the tapered area profile is adopted. The tapered form is preferred for HS2 because it minimises the step-change of area at the junction with the main tunnel, which causes a high-pressure gradient when the train passes and can therefore result in MPWs. The unwanted spike of pressure gradient caused by such a step-change can be seen in Figure 5, right-hand image, at time=0.097. Tapered hoods have previously been proposed and studied (e.g. Howe et al[12]), but none have been constructed to date. The innovative form of the HS2 hood design enables a lower pressure gradient to be achieved for a given hood length than typical existing hood designs and was necessitated by the demanding combination of high line speeds and relatively tight tunnels. The performance of the generic design has been validated by scale model testing, described briefly above and in Sturt et al[4].
Hole size is such that the total area of holes is about 40% of the main tunnel area. This is the optimum setting found by scale model testing, resulting in a low, near-constant pressure gradient as illustrated in the left-hand image of Figure 5. Using one-dimensional analysis, the 40% guideline has been found to be appropriate irrespective of hood length. Thus, longer hoods have smaller holes, but a greater number of them. The generic design has rectangular holes 1.0 m long at 2.0 m centres, but this can be varied to suit the design details provided that the total area and even distribution of holes is maintained.
Acceptability criteria
To enable selection of hood length, acceptability criteria for the MPW arriving at receptors near the tunnels must first be established. National criteria have been developed in Japan, Germany and elsewhere, but there are no internationally-agreed criteria and none have been prescribed for use in the UK. For HS2, two criteria have been adopted as design targets (see Table 4). These are intended to ensure that (a) the amplitude of MPW arriving at homes and other sensitive receptors will be no greater than measured values for HS1 tunnels, where they are inaudible and unnoticeable; and (b) that no loud noises will be audible near the tunnel exit. The second criterion is the same as used in Japan and becomes the governing one if no receptors are nearby.
| Location | MPW amplitude (Pa) | Reasoning |
|---|---|---|
|
At nearest receptor |
≤ 6 |
No disturbance for residents HS2 no higher than HS1 |
|
At 50m from tunnel exit |
≤ 20 |
No loud noises near tunnel exit Same criterion as used in Japan |
To achieve the above targets for the MPW emitted, HS2 tunnels are designed such that the pressure gradient inside the tunnel near the exit (after steepening during wave propagation along the tunnel is accounted for) will be 8-15 kPa/s depending on proximity of receptors – substantially less than the 40 kPa/sec above which Hieke et al[13] suggest that MPWs with strong audible frequency components may occur.
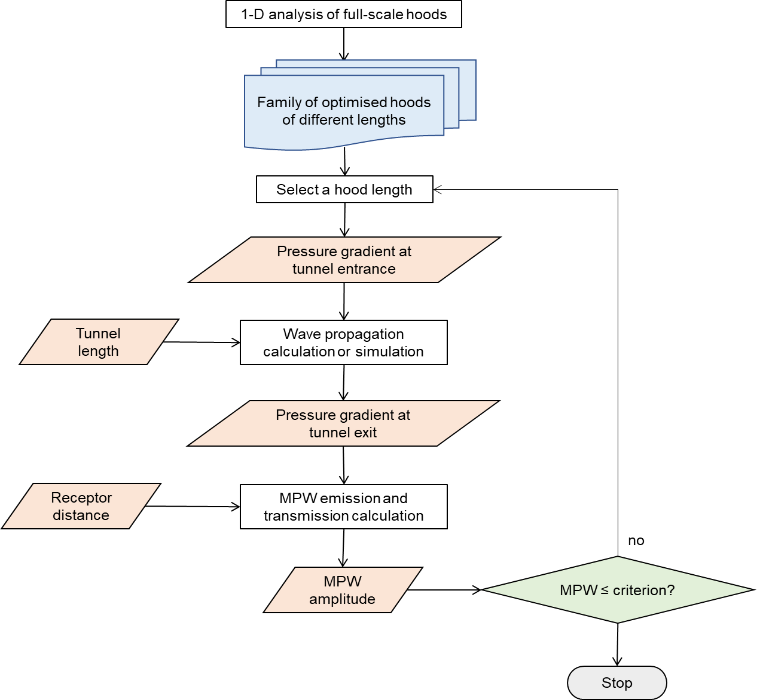
Selection of hood length
The process of selecting the appropriate hood length for a given tunnel is summarised in Figure 9. Numerical simulation of the full-scale portals was used to optimise the hole size to obtain the lowest possible pressure gradient, for each of a range of hood lengths in 10m steps. From these simulations, the gradient of the pressure wave caused by train entry is known for each hood length. This is plugged into a chain of tunnel-specific calculations whose outcome is the predicted MPW amplitude at the locations shown in Table 4, which must conform to both acceptability criteria. The shortest hood that passes the criteria is selected. Examples of hood parameters derived by this process are given in Table 5.
| Tunnel/hood | Train entry speed (km/h) | Tunnel Length (km) | Hood Length (m) | Factors influencing hood length |
|---|---|---|---|---|
|
Euston tunnel |
≤ 120 |
7.3 |
none |
Low speed – hoods not required |
|
Northolt North |
320 |
13.4 |
210 |
Length of tunnel (wave steepening) and receptors near south end of tunnel |
|
Chiltern South |
320 |
16.0 |
220 |
Length of tunnel (wave steepening) |
|
Wendover South |
360 |
1.2 |
80 |
High speed but no receptors close to north end of tunnel |
|
Wendover North |
360 |
1.2 |
100 |
High speed and receptors near south end of tunnel so hood is longer at north end |
|
Greatworth South |
360 |
2.5 |
100 |
High speed, no receptors close to north end of tunnel but more wave steepening than in Wendover Tunnel |
|
Bromford West |
230 |
5.8 |
60 |
Lower train speed so reduced hood length |
HS2 tunnel hood designs
The hoods have been designed by the Main Works Civil Contractors in compliance with the principles of the generic hood design (cross-sectional area profile, hole distribution and hole size), adapted to suit the construction method selected for each tunnel. Some examples are given below.
For Burton Green Tunnel, the hood design closely resembles the form of the scale model hoods shown in Figure 3. The hood is simply an extension of the rectangular-section cell of the tunnel with one wall set at an angle to the track, as illustrated in Figure 10.
For Chiltern Tunnel, the hood (see Figure 11) is designed as an in-situ reinforced concrete structure, with vertical side walls and an arched roof, enabling a close match with the tunnel cross-sectional area at the junction with the circular bored tunnel. The tapering is achieved by varying the height of the vertical walls supporting the arch (see Figure 12). The hole spacing is increased from 2.0m in the generic design to 6.0m, and the hole sizes are enlarged in the same ratio to preserve total hole area.
Most of the other HS2 tunnels are designed for two-way running at the full line speed, so hoods on both tracks have the same length. For Chiltern tunnel, however, reverse-direction running would be at reduced speed. The shorter hood shown in Figure 11 is designed (a) as an entrance hood for reduced speed, and (b) to mitigate MPW caused by trains exiting from the tunnel at full line speed in the normal running direction.
The north end of Northolt tunnel emerges into a retained cut. The hood has a rectangular section which is landscaped over. The holes in the hood would not work as intended if the air had to pass through long pipes up through the soil. At the time of writing, the design proposal is for the holes in the slab to emerge into wide channels (Figure 13).
The rectangular section hood overlaps the circular-section bored tunnel as shown in Figure 14, in order to minimise any step-change of area (essential for mitigation of MPW) while preserving continuity of walkways and railway systems across the junction between the circular tunnel and the rectangular porous portal.
Shaft/tunnel interfaces
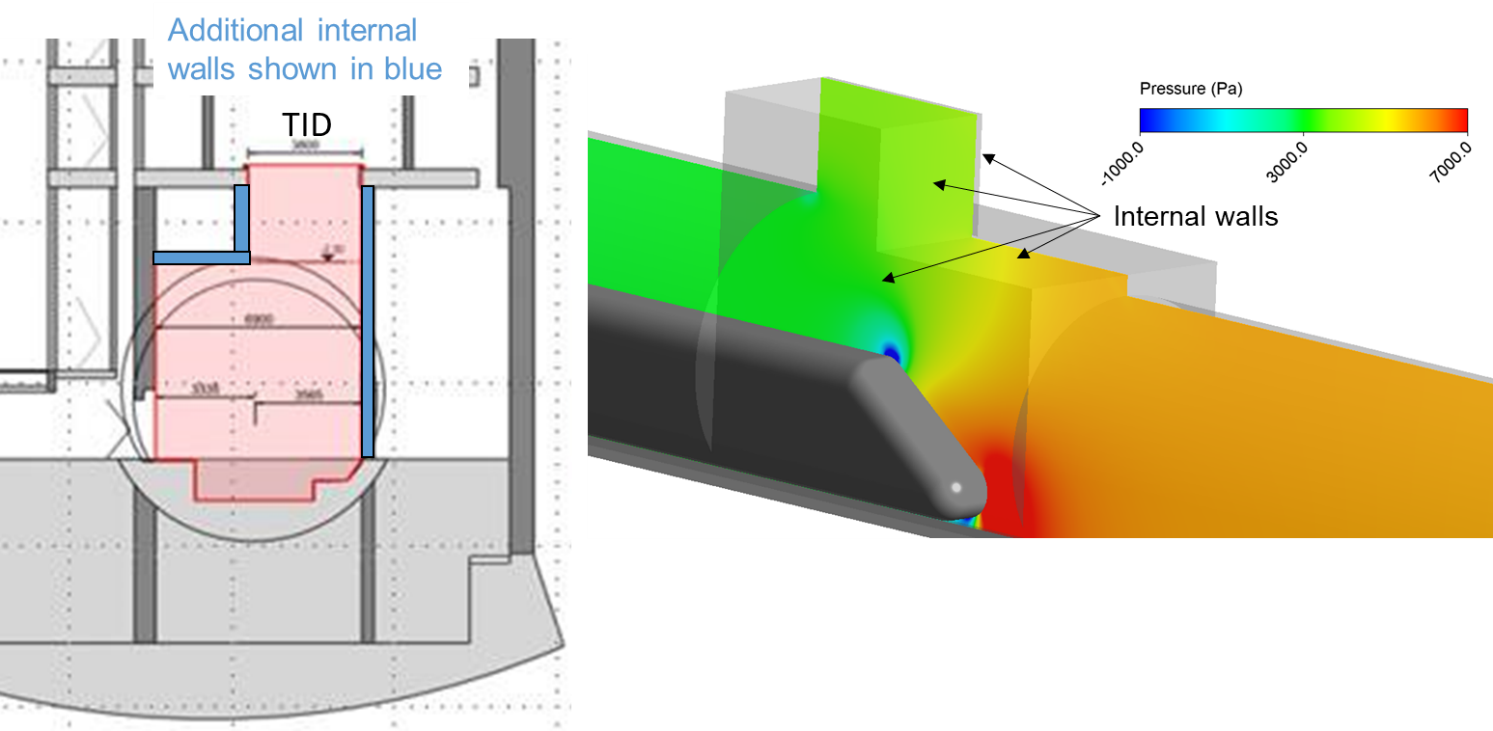
Pressure waves are generated when trains pass changes of cross-sectional area within the tunnel. The decision not to use the shafts for pressure relief was influenced by the increased likelihood of steep pressure waves being generated if trains were to pass open shafts. However, even with the dampers closed, the shaft interfaces still present an increased cross-sectional area compared to the tunnel. The gradient of the pressure waves generated when trains pass the shaft interfaces, and hence the potential to cause audible MPW emissions from the tunnel exit, must be checked. In addition to shaft interfaces, other constrictions or expansions within the tunnel (such as those associated with jet fans, localised high-level derailment protection, etc) may present similar issues requiring investigation.
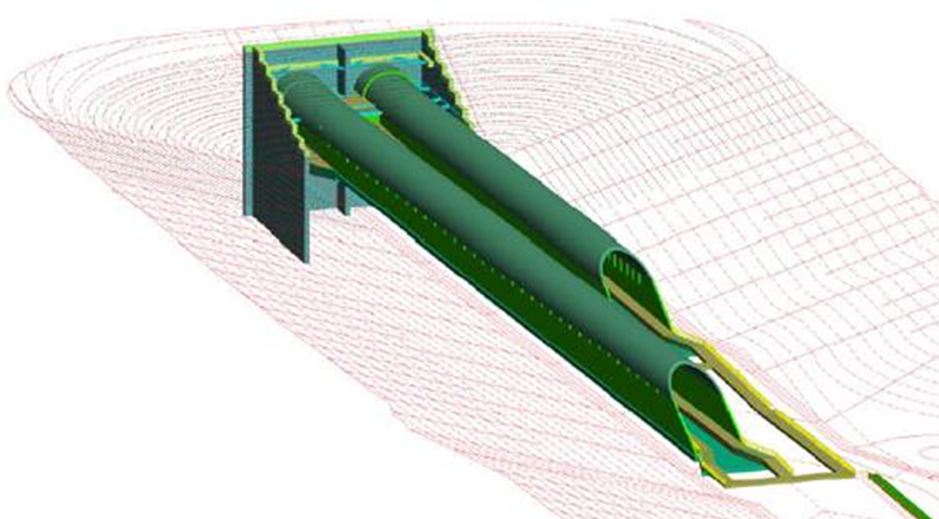
Greenpark Way shaft interface offers a further challenge, being the location of a reduction of tunnel diameter from 8.8m to 8.1m. The potential for steep pressure waves to be generated when Upline trains pass from the larger area in the shaft interface into the 8.1m tunnel is being investigated. Mitigation may take the form of internal walls (Figure 15). The mechanism of pressure wave generation is three-dimensional and cannot be analysed accurately by one-dimensional analysis, so the requirement for mitigation is assessed using a CFD model of the shaft interface, also shown in Figure 15, which models the various air volumes through which the train passes.
Aerodynamic Pressures Loading on Structures and Equipment
HS2 hoods, tunnel structures and equipment such as cross-passage doors are designed to withstand aerodynamic pressures fluctuating between positive and negative values of several kilopascals every time a train passes through. HS2’s high frequency of service results in fatigue effects that are more onerous than for most other international HSR operations. The number of pressure cycles for fatigue design is based on an assumption of 125,000 trains per year in each direction.
Pressures to be used in design of the structures and in the specification of equipment were generated from simulations, with appropriate margin added for uncertainties. Two pressure levels, described as “frequent” and “characteristic”, were calculated, as summarised in Table 6. “Unfavourable” atmospheric conditions are those that generate higher than normal aerodynamic pressures, due either to high air density (cold, high atmospheric pressure) or wind conditions that cause a headwind in the tunnel.
| “Frequent” pressure | “Characteristic” pressure | |
|---|---|---|
|
Description |
Best estimate or typical pressure |
Credible upper limit pressure |
|
Used for |
Fatigue |
One-off load calculations |
|
Train type |
HS2 best estimate |
TSI upper limit interoperable |
|
Atmospheric conditions: |
Typical |
Unfavourable |
As an example, the “characteristic” aerodynamic pressure in Greatworth Tunnel is ±10 kPa while the “frequent” pressure is ±8.5 kPa. For the dividing wall and doors between cells, the governing case occurs when trains pass through both cells at the same time such that the maximum positive pressure in one cell occurs simultaneously with the most negative pressure in the other cell. Thus, the characteristic net pressure on the wall/door is 20 kPa.
For the bored tunnels, the data provided to design teams includes consideration of pressures in cross-passages and shafts. Pressure caused by trains in the running tunnels may leak through cross-passage doors and track isolation dampers as they deteriorate over time, or in accidental conditions when a door or damper fails or is left open. The door at the other end of the cross-passage may then be exposed to positive pressure in the cross-passage simultaneously with negative pressure on the other side of the door in the running tunnel, or vice-versa.
Conclusions
Mitigation of potential aerodynamic impacts has been an important aspect of the design of the HS2 tunnels since the inception of the project and has made extensive use of numerical modelling, validated against scale model tests conducted specifically for HS2. Tunnel cross-sectional areas result from a value-engineering exercise and are smaller than would be provided in some other countries given the line speeds, saving of the order of 1.5M m3 of tunnel volume for the Phase One tunnels. Nevertheless, they are more than sufficient to pass the TSI 10 kPa limit. Aural comfort is ensured via performance specification for the pressure-sealing of the trains. Aerodynamic pressures have been derived by numerical modelling for structural design purposes and for specification of equipment such as cross-passage doors.
Hoods are provided to prevent audible micro-pressure waves (sonic booms). The generic HS2 hood design has been validated by scale model testing. Hood dimensions vary from tunnel to tunnel and have been optimised using numerical modelling, while the arrangement and detailed design of each hood by the Main Works Civil Contractors is adapted to suit conditions around the tunnel entrance and the preferred construction method.
Internationally, HSR operating speeds are likely to continue to increase, enabled by developments in rolling stock technology. The aerodynamic solutions developed for the HS2 tunnels provide a reference for future HSR projects faced with the challenge of combining high line speeds with relatively small, economic tunnel cross-sections. The tunnel entrance hoods for prevention of sonic booms, which have a novel tapered form, are likely to be of particular interest: typical existing international hood designs would provide insufficient mitigation for HS2’s high speeds and tight tunnels.
Acknowledgment
The authors wish to thank Professor Alan Vardy for suggesting the generic tapered hood design and for his aerodynamics advice throughout the course of the project.
References
[1] European Commission. (2014). Commission Regulation (EU) No 1299/2014 of 18 November 2014 on the technical specifications for interoperability relating to the ‘infrastructure’ sub-system of the rail system in the European Union.
[2] European Commission. (2014). Commission Regulation (EU) No 1302/2014 of 18 November 2014 concerning a technical specification for interoperability relating to the ‘rolling stock’ sub-system of the trans-European high-speed rail system.
[3] UIC (2005) Leaflet 779-11, 2nd edition: Determination of railway tunnel cross-sectional areas on the basis of aerodynamic considerations.
[4] Sturt, R, Baker, C, Soper, D, Vardy, A, Howard, M, and Rawlings, C. (2015). The design of HS2 tunnel entrance hoods to prevent sonic booms. Proc. 13th International Conference & Exhibition on Railway Engineering, Edinburgh.
[5] Baker, C, Dalley, S, Johnson, T, Quinn, A, and Wright, N. (2001). The slipstream and wake of a high-speed train. Proc. Institution of Mechanical Engineers, Part F: Journal of Rail and Rapid Transit, 215, 83-99
[6] CEN/TC 256 (2018). prEN 14067-5:2018 Railway applications – Aerodynamics – Part 5: Requirements and test procedures for aerodynamics in tunnels.
[7] HS2 (2019) Train Technical Specification. HS2-HS2-RR-SPE-000-000007 P11
[8] Schwanitz, S, Wittkowski, M, Rolny, V, and Basner, M. (2012). Pressure variations on a train – Where is the threshold to railway passenger discomfort? Applied Ergonomics, vol. 44, pp. 200-209
[9] Maeda, T, Iida, M, Fukuda, T, Sakuma, Y, and Takasaki, T. A micro pressure wave radiating from a tunnel portal. Proc. 18th International Congress on Acoustics, 2004.
[10] Hieke,,M, Gerbig,,C, Tielkes, T. (2013) Mastering micro-pressure wave effects at the Katzenbergtunnel – Design of measures, prediction of efficiency and full-scale test verification. Proc. 11th International Workshop on Railway Noise
[11] Vardy, A. (2008) Generation and alleviation of sonic booms from rail tunnels. Proceedings of The ICE – Engineering and Computational Mechanics, vol. 161, pp. 107-119, 2008.
[12] Howe, M, Iida, M, Fukuda, T, and Maeda, T. (2000) Theoretical and experimental investigation of the compression wave generated by a train entering a tunnel with a flared portal, J Fluid Mechanics, 425, 111-132
[13] Hieke, M, Kaltenbach, H-J, and Tielkes, T. (2009) Prediction of micro-pressure wave emissions from high-speed railway tunnels. Proc. 13th International Symposium on Aerodynamics and Ventilation of Vehicle Tunnels
Peer review
- Eddie WoodsHS2
- Bryan TodhunterHS2