An automated digital method for the assessment of crosswind safety for the HS2 route
Strong crosswinds have been known to overturn trains. High-speed trains can be especially at risk because the higher the train speed, the lower the critical wind speed at which overturning occurs. The risk of overturning varies at different points along a given route and is influenced by the exposure of the track (for example, on high viaducts), the speed of the train, cant deficiency in curves, and other factors.
In order to ensure a resilient railway operation, the risk is managed by a combination of civil engineering mitigation measures such as the provision of wind barriers, and operational mitigation measures such as reduced operating speeds during extreme wind conditions. Calculation of the risk at each point along the route is a necessary step in the evaluation of different mitigation scenarios. Since the calculations are intensive and need to be repeated for each mitigation scenario or to reflect a developing design, an automated method is preferred.
This paper presents the methodology used in a crosswind risk study for High Speed Two (HS2). Firstly, the basis of the calculations is presented. The methods are based on a Rail Safety and Standards Board (RSSB) standard with adaptations for consistency with current European practice in which train stability in crosswinds is described by Characteristic Wind Curves, and to account for recent advances in meteorological data. Secondly, the implementation of the calculations is presented. An automated digital solution has been developed which imports input information from multiple sources, including design and geographic data from GIS, and performs the risk calculation at 20m intervals along the route. The calculation results are fed back to GIS enabling presentation of the distribution of crosswind risk along the route in the form of colour-coded maps from which any risk hot-spots can be identified in the context of their local geography. Because the calculation is automated, it can be rerun easily to evaluate different mitigation scenarios or when new design data becomes available and is applicable to future stages of HS2 or other new railways in the UK. Furthermore, rigorous and consistent use of live design data reduces the likelihood of localised risk hotspots being missed.


Introduction
In the development of a resilient railway operation, the risk of trains being overturned by strong crosswinds must be assessed and managed. Risk increases with train speed for reasons explained below, and therefore crosswind safety for new high-speed operations such as High Speed Two (HS2) requires special consideration; even if the route appears to be no more exposed to wind than the existing conventional network. At a system level, the interface between rolling stock and infrastructure is controlled by specifying the minimum required level of stability of the trains, and then designing the infrastructure and operations such that the risk is acceptably low provided that the trains meet the specification.
In addition to overturning trains, high winds pose other risks to rail operations such as catenary blow-off, infrastructure damage or train collisions as a result of fallen trees or debris blown onto the line; however, these additional risks are not considered in this paper.
Description of the risk
Trains can be overturned by wind gusts if the speed of the gust exceeds the critical wind speed (stability limit) of the train. The aim of the risk calculation is to determine how often gusts exceeding the critical speed are expected.
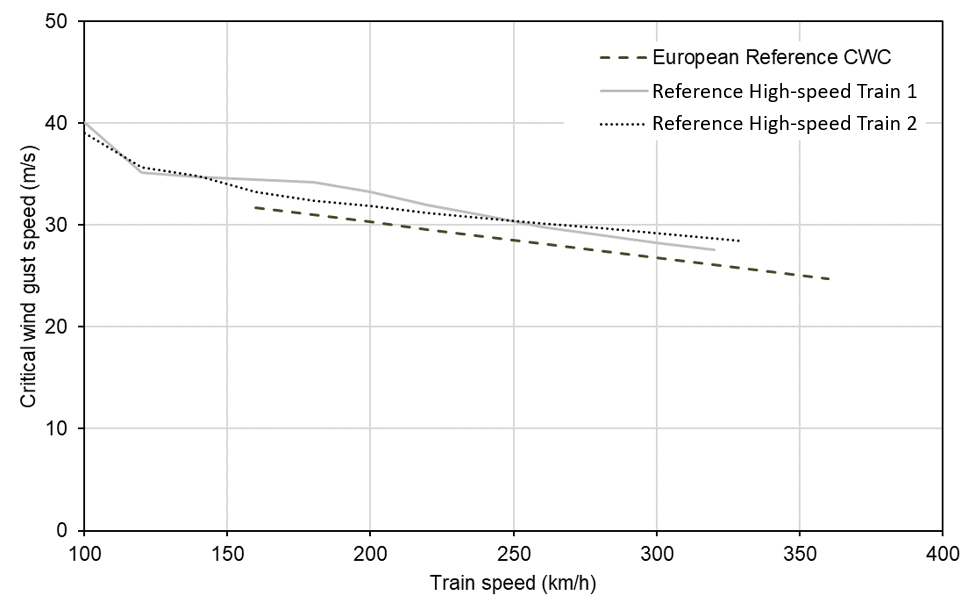
The critical wind speed is a property of the train design: the higher the critical wind speed, the more stable the train. However, the critical wind speed is not a constant – somewhat counter-intuitively, as the train speed increases, the critical wind speed reduces (i.e. the train can overturn in lower wind speeds when it is travelling faster), see Figure 1. All train designs show this effect – it cannot be “designed out” – and is partly due to increased lift around the train nose counteracting the stabilising effect of the train’s weight. The lift at the nose and the fact that trailing vehicles provide some support to each other means that the leading vehicle is usually critical to the assessment. Stability in crosswinds is also influenced by lateral forces arising from cant deficiency (or cant excess) in curves. Because train speed and cant deficiency vary along the route, the critical wind speed also varies along the route.
The frequency of occurrence of extreme wind gust speeds follows a Weibull distribution known from historical data. The base distribution applies to a UK reference condition (sea level, open country) and can be scaled to account for locations being generally windier than the reference condition. The scalability applies both on a large scale across different parts of the UK and to localised wind concentration or sheltering effects. The wind gust speed scaling factor varies along the route, being greater in locations where the track is more exposed (for example, on viaducts) – in these locations, high wind gust speeds are expected more frequently. The scaling factor is reduced in locations where the track is sheltered by cuttings or barriers.
Risk calculations involve a comparison of the critical wind gust speed with the local 50-year return wind gust speed (accounting for exposure and sheltering effects) in order to calculate the frequency with which gusts exceeding the critical speed are likely to occur. Since the local wind gust speed and the train’s critical wind speed both vary, the calculation must be repeated at frequent intervals along the route. Risk hotspots occur where the local gust speed is high (exposed locations) combined with the critical wind speed being low (high train speed, especially when combined with cant deficiency on curves).
Mitigation
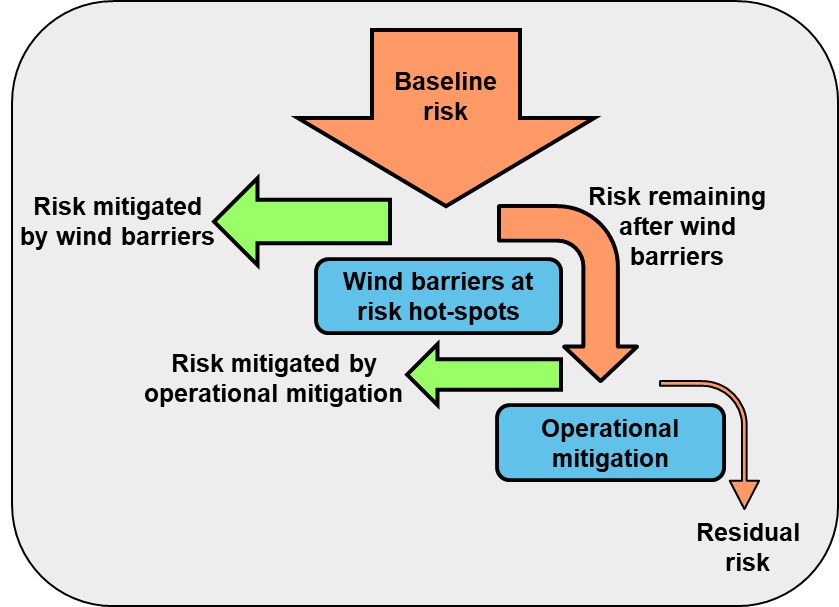
The risk of overturning in crosswinds can be mitigated by providing wind barriers or fences in exposed locations, and/or operational measures whereby temporary speed limits are imposed, or operations are suspended when high winds occur or are forecast. The risk cascade is shown diagrammatically in Figure 2. There is a trade-off between the cost of providing more wind barriers (enabling operations to continue in windier conditions) versus the operational consequences of slowing or stopping trains more frequently to avoid risk of overturning on the unprotected segments of the route.
Codes and standards
Crosswind risk assessment for an operation such as HS2 requires a calculation of the stability of the trains combined with assessment of the local wind conditions to which the trains are exposed along the route.
The European standard on railway aerodynamics includes a part dedicated to crosswind safety, EN 14067-6[2]. This standard provides comprehensive and widely adopted methods for assessing and describing the stability of trains using Characteristic Wind Curves (CWCs), consisting of tabulated data giving critical wind speed as a function of train speed for a range of wind angles and unbalanced lateral acceleration values. The standard includes reference CWCs that can be used in route assessments as a lower bound on the stability of typical modern high-speed train designs (see Figure 1). The criterion used for critical wind speed is that the windward wheels of the most vulnerable vehicle are unloaded by 90% during the dynamic response of the vehicle as it passes through a jet of steadily-blowing wind with a pre-defined spatial distribution, and is typically assessed by Multi-Body Simulation of the dynamic response of the train coupled with aerodynamic coefficients measured from scale models in a wind tunnel or predicted by Computational Fluid Dynamics.
In contrast to the detailed information given in EN 14067-6 regarding vehicle stability, route assessment is left to national standards.
Rail Safety and Standards Board (RSSB) standard RIS-7704-NIS[3] was developed initially for assessment of overturning risks to tilting trains exposed to crosswinds while running at increased cant deficiency on curves on the West Coast Main Line. However, its methods of calculating the risk of crosswind incidents for a given route are applicable to any rail operation in the United Kingdom. It includes treatment of risk factors such as infrastructure that increases or decreases local wind gust speeds, the influence of wind angle based on the UK wind climate, and many other effects relevant to route assessment.
RIS-7704-NIS defines the stability of the vehicle by a quasi-static tipping method which uses 100% unloading of the windward wheels as the criterion for overturning; this aspect of the RSSB standard has not been adopted in the present study, because the CWC methodology of EN 14067-6 is now routinely used by rolling stock manufacturers to evaluate the crosswind stability of their train designs and is a requirement of the HS2 Train Technical Specification[4]. The 90% wheel unloading criterion of EN 14067-6 may result in more conservative risk values than the 100% wheel unloading taken in the RSSB standard. Nevertheless, the results are considered valid for comparing the relative risks at different locations, or to assess the impact on risk of a particular mitigation scenario.
Calculation method
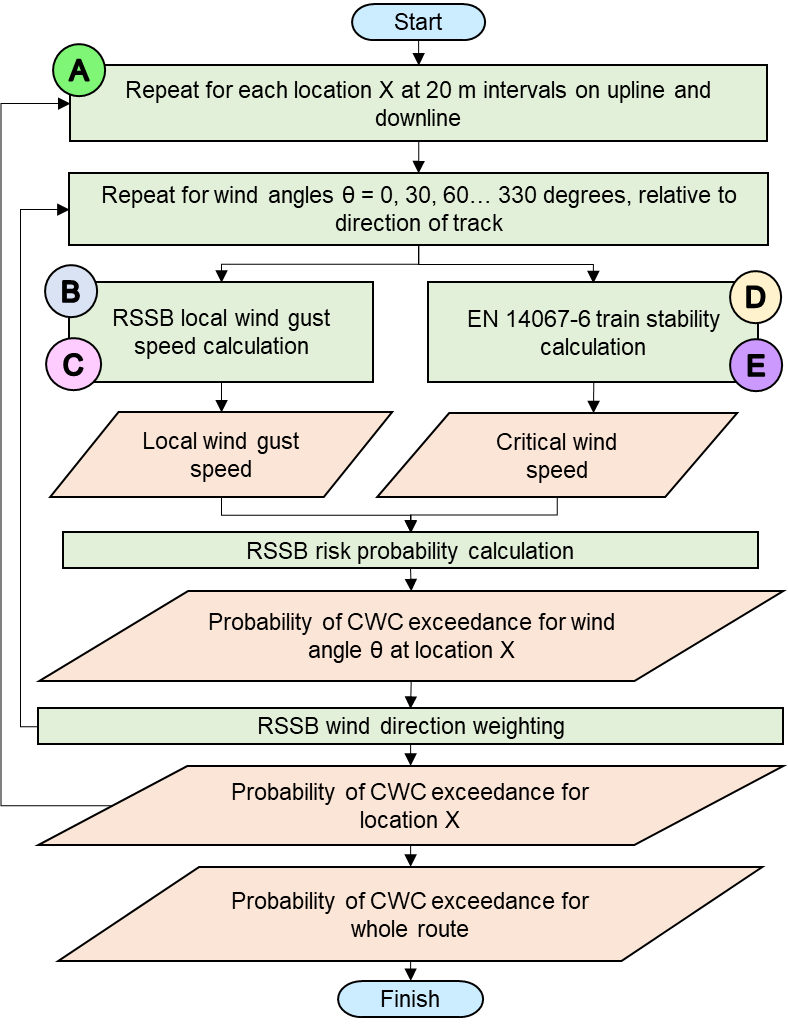
The risk calculation determines the probability, or frequency of occurrence, of wind gusts with a speed exceeding the critical wind gust speed. The calculation is repeated at 20 metre intervals along the route. The results may be viewed as a probability distribution along the route (thus revealing risk hotspots) or may be combined to give the probability of a critical wind gust occurring during a whole journey. An outline of the calculation scheme is shown in Figure 3.
|
Ref |
Input |
Source |
|
A |
Alignment |
HS2 Alignment Data (GIS) |
|
B |
Ground Surface |
Geospatial database (GIS) |
|
B |
Infrastructure type (viaduct, embankment, cutting, tunnel) |
HS2 Design Element Data (GIS) |
|
B |
Height of viaducts & embankments, depth of cuttings |
HS2 Alignment and geospatial database (GIS) |
|
B |
Height of acoustic or wind barriers |
HS2 Design Element Data (GIS) |
|
C |
Reference wind speed map |
EN 1991-1-4 |
|
D |
Line speed |
HS2 Speed and Curve data |
|
D |
Cant deficiency |
HS2 Speed and Curve data |
|
E |
CWCs |
prEN 14067-6:2016 Reference CWCs |
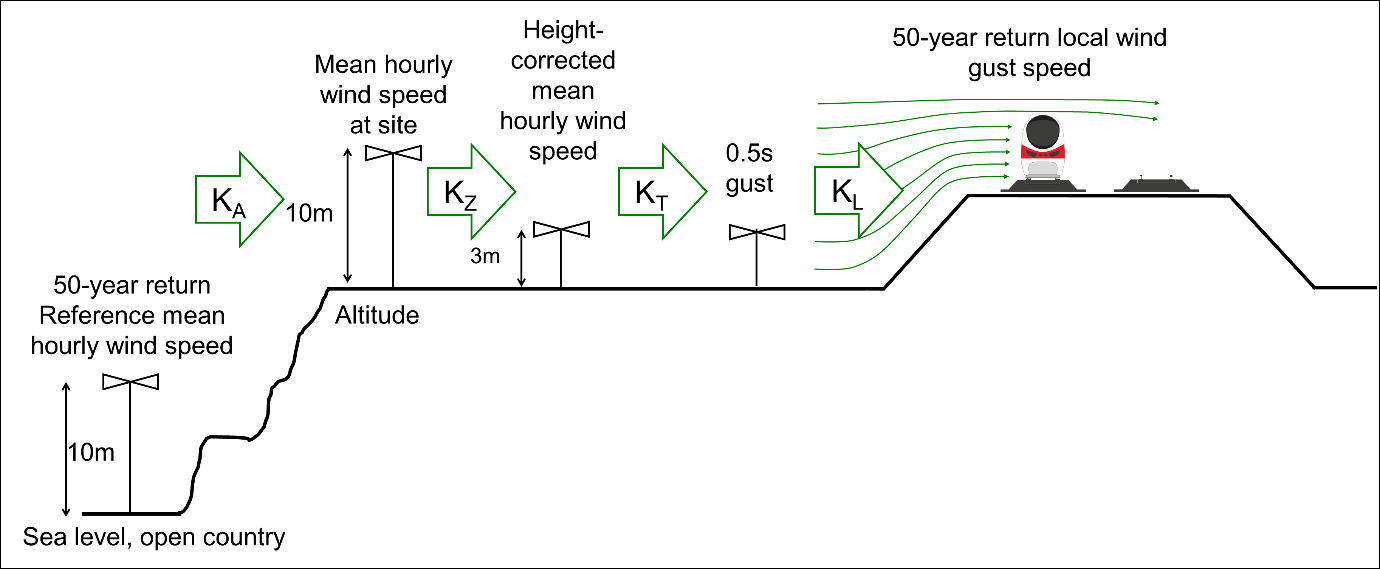
The basis of the calculation is the RSSB methodology given in RIS-7704-NIS. The calculation of local wind gust speed involves evaluating a series of factors listed in Table 2 and illustrated diagrammatically in Figure 4 which, when multiplied together, generate a speed-up factor that converts the 50-year return reference wind speed to a 50-year return local gust speed at the train.
|
Factor |
RIS-7704-INS[3] |
Input required | Comment | |
|
KA |
Altitude factor |
F.3.1.1 | Alignment height above sea level | Accounts for height above sea level – generally windier at higher altitude |
|
KL |
Topography factor |
F.3.5.1 | Infrastructure type, alignment height above surrounding terrain | Accounts for embankments, viaducts and cuttings |
|
KS |
Roughness factor |
F.3.3.1 | Ground roughness | Accounts for terrain type e.g. lower wind speed in built-up areas |
|
KZ |
Height factor |
F.3.4.1 | Viaduct height, ground roughness | Converts wind speed from 10 m above ground to 3 m above top of rail |
|
Kτ |
Time averaging factor |
F.3.6.1 | Viaduct height, ground roughness | Converts 50-year return mean hourly wind speed to 50-year return gust speed |
|
KF |
Fence factor |
F.3.7.1 | Barrier type, height and porosity | Accounts for barriers, fences, etc |
|
Kθ |
Direction factor |
F.3.2.1 | Wind angle relative to north | Accounts for varying wind strengths in different directions |
The following modifications to the RSSB methodology have been made in this study:
- Instead of the static tipping method with 100% wheel unloading, the CWC-based train stability approach of EN 14067-6 has been adopted. The Reference CWCs provided in EN 14067-6 have been used to define train stability in the initial risk assessment. These can be replaced by CWCs of the particular trains to operate on HS2 once this information becomes available.
- The reference wind speed (which indicates the windiness of a given location), is taken from the UK National Annex to BS EN 1991-1-4[5] which reflects recent meteorological updates. The wind speed values from the Eurocode are 10-minute averages; in the calculations, these are divided by 1.06 to convert to hourly values for consistency with the RSSB methodology.
- The RSSB methodology has been adapted to suit a gust duration of 0.5 seconds rather than 3 seconds, for compatibility with the CWC-based definition of train stability. The derivation of CWCs does not define a gust duration. Instead, it uses a pre-defined spatial distribution of wind speed (somewhat like a jet) through which the train passes. The nearest equivalent to a gust duration is the time for each vehicle to pass through the “jet”. Assuming a vehicle length of 25m and a train speed of 50 to 100 m/s, the effective duration of the gust is between 0.25 and 0.5 seconds. On the other hand, critical wind speed exceedances must persist for sufficient time, perhaps around 1 to 3 seconds, if overturning is to result. Too short an averaging time therefore seems unrealistic. An averaging time of 0.5 seconds was selected as a compromise between these considerations.
Selected parts of the calculation are described in more detail below.
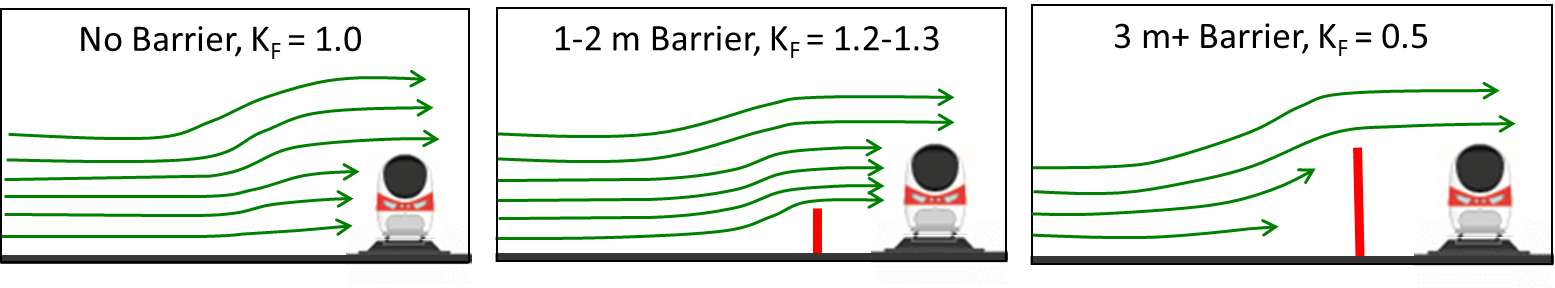
The influence of acoustic and wind barriers on local wind speed is represented by a “Fence Factor” (KF) taken from the RSSB standard dependent on barrier height and porosity. As shown in Figure 5, barriers 1-2 m high above top of rail increase the overturning moment by redirecting wind onto the upper portion of the train, represented in the calculation by KF greater than 1, and therefore present increased risk compared to no barrier. Barriers of 3 metres or higher provide a sheltering effect that reduces risk substantially. These height-dependent values of KF are taken to apply to viaduct parapets and other vertical obstructions on the windward side of the train as well as to barriers.
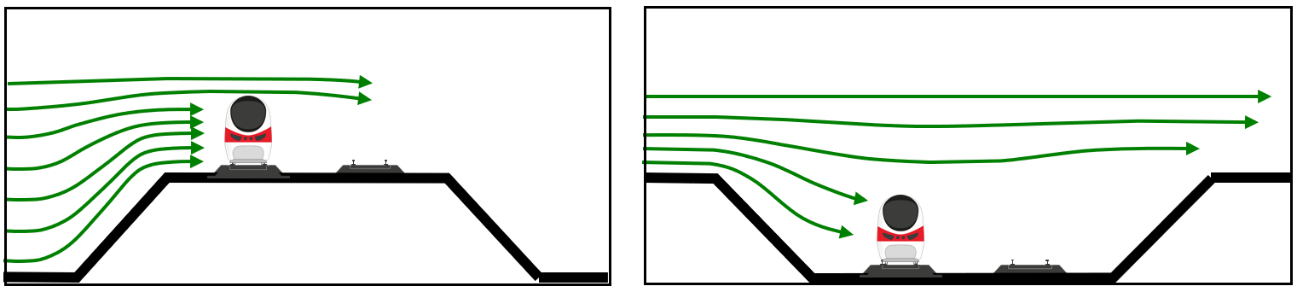
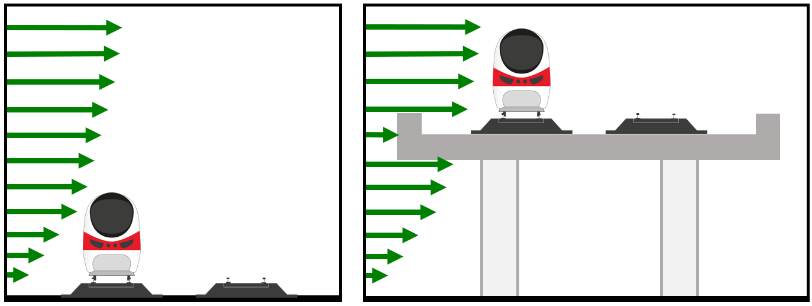
The influence of cuttings, embankments and viaducts is represented by a “Topography Factor” (KL) taken from the RSSB standard, illustrated conceptually in Figure 6 and Figure 7. The wind is accelerated over embankments leading to greater local wind speed at the train. Conversely, the wind decelerates into cuttings. When a train is on a viaduct, it experiences higher wind speed due to reduced influence of shear resistance from the roughness of the ground. The value of KL depends on the height of the embankment or viaduct, or the depth of the cutting.
Calculations are repeated for wind directions at 30 degree intervals about the track direction. Each wind direction contributes to the total risk, weighted by the frequency with which the wind blows from that direction. The wind direction has numerous implications for the calculation:
- The critical wind speed varies with wind angle relative to the track and is evaluated by look-up from the input CWC data.
- On curves, the unbalanced acceleration due to cant deficiency (or cant excess) either adds to or subtracts from the wind effect depending on wind direction. For wind directions for which the cant effect is additive, the reduction of critical wind speed is evaluated by interpolation from the CWC data after first calculating the unbalanced lateral acceleration from the cant, train speed and curve radius. Where the cant effect subtracts from the wind effect, any increase of critical wind speed is ignored in the calculation, because the calculation might become non-conservative for trains running at less than the maximum line speed.
- Where barriers are present on one side of the track only, or have different heights on each side, the barrier dimensions on the windward side of the track must be used.
- The prevailing wind direction (south-westerly) is not only the most frequent wind direction but is also associated with higher wind speeds. This is accounted for by a wind direction factor in the RSSB methodology. The angle of the alignment is calculated from the coordinates of adjacent alignment points, enabling the wind angle relative to the track to be converted into a bearing from which the direction factor can be interpolated.
- The weighting factor accounting for the frequency of each wind direction is interpolated from the data in the RSSB standard.
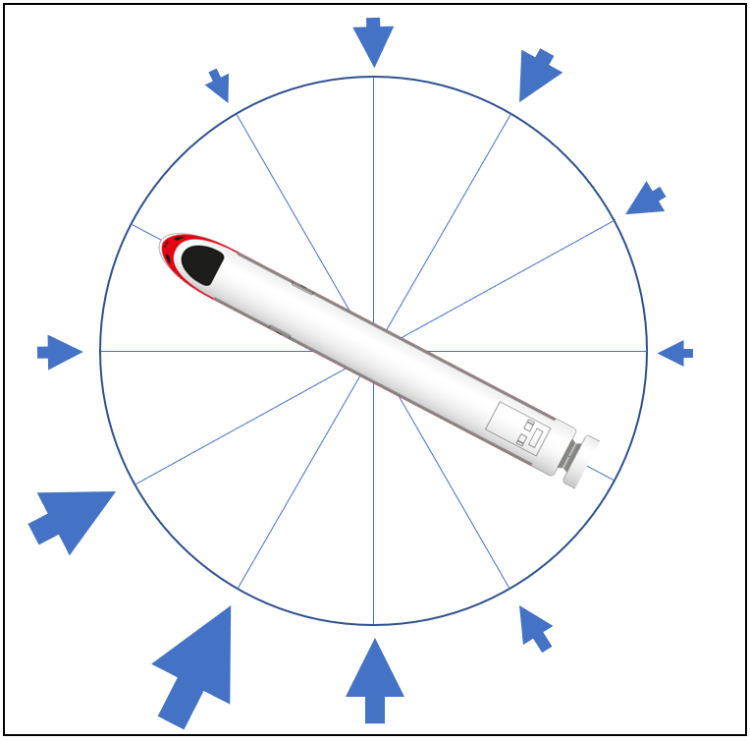
An example is shown diagrammatically in Figure 8 for an alignment bearing of 300 degrees. The arrow size is representative of the risk contribution of each wind direction. The risk increases when the wind is more side-on to the train (due to the effect on critical wind speed) and is greater when the wind blows from the south-west due to the strength and frequency of the wind occurring from that direction.
The probability of exceedance of the critical wind speed is calculated from the ratio of the critical wind speed to the 50-year return local gust speed, using the RSSB methodology adapted to 0.5 second gust duration as indicated in Equation 1. The probability that the average local wind speed will exceed the critical wind speed at point i during any 0.5 second period is given by
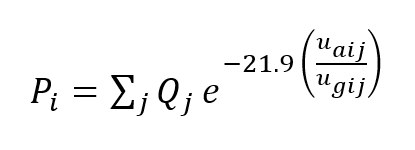
Where j represents wind direction, is the 50-year return local gust wind speed for point i and wind direction j, is the critical wind speed for point i and wind direction j, and is the probability that the wind will come from direction j. The original RSSB equation uses exponential term -20.1 instead of -21.9, relating to a 3 second gust duration rather than 0.5 seconds. For example, if the critical wind speed equals the 50-year return gust speed, then exceedance is expected once per 50 years, giving a probability of 3.17 x 10⁻¹⁰ for exceedance during any 0.5 second period, or an expected number of exceedances of 0.02 per year.
The risk calculation is not currently able to include the effect of operational mitigation measures, such as restricted operations during extreme weather. The risk calculated corresponds to “risk remaining after wind barriers” in Figure 2.
Implementation and automation
The crosswind risk calculation was developed and implemented as an automated digital solution, enabling the input data to be gathered and the calculations to be performed efficiently for as many discrete locations as may be required along the HS2 route.
A Feature Manipulation Engine (FME) workspace is used to pre-process the GIS and other route data, received from multiple sources, to produce input route point data with 20 metre resolution.
The crosswind risk calculation is then performed in a Python script which reads the pre-processed input route data, along with other inputs, performs calculations and writes output. The output data is fed back to GIS enabling the distribution of crosswind risk along the route to be plotted in the form of colour-coded maps from which all risk hotspots can be identified. The calculation workflow is indicated in Figure 9.
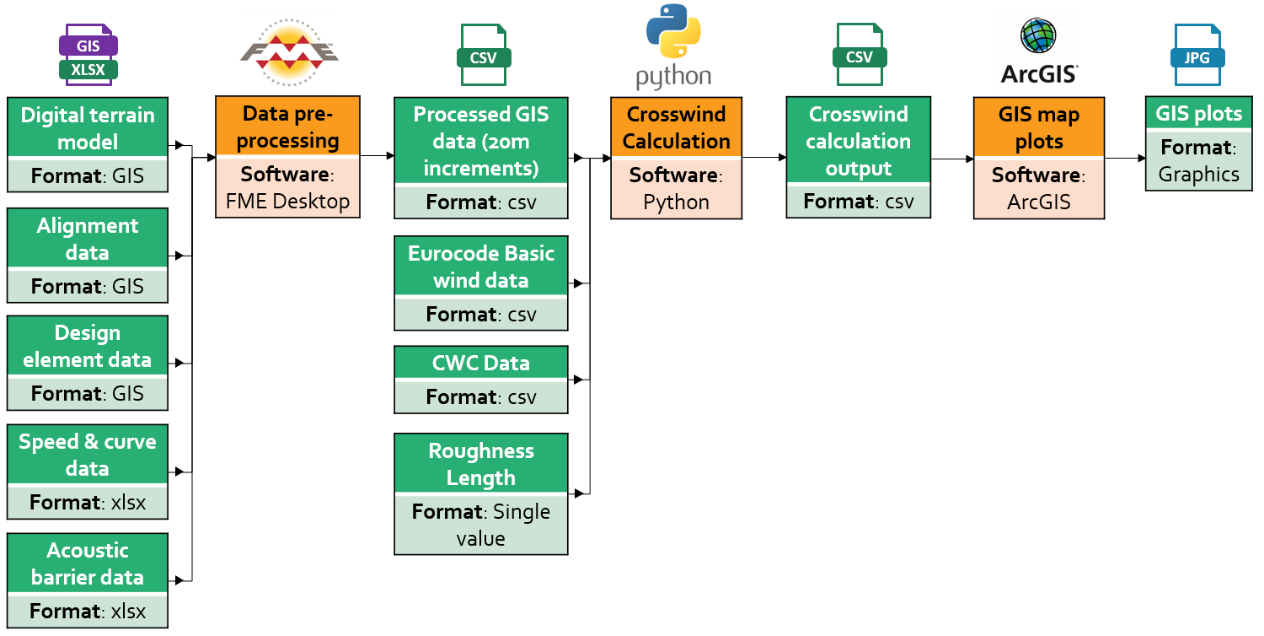
The FME and Python steps are fully automated and require minimal effort to rerun with new input data of the same format.
The portion of HS2 route assessed so far consists of almost 10,000 points on each of the Upline and Downline, with calculations for 12 wind angles per point, giving a total of over 225,000 calculations. These take approximately 30 seconds to complete on a standard laptop.
The Python script was developed as a series of modular functions designed to perform specific tasks. Each of the functions was unit-tested for errors and robustness with the full range of expected and possible inputs. Functions were verified against hand or spreadsheet calculations wherever possible. The functions were then combined to produce the full crosswind risk calculation script, which was quality assurance tested with 15 different scenarios.
Use of GIS database
The HS2 design is documented in a GIS database which includes the three-dimensional coordinates of the alignment as well as “Design Element Type” at each point (such as embankment, cutting, viaduct, tunnel) and the positioning and height of any acoustic or wind barriers. This information is used in the calculations as follows:
- The chainage (distance from start of alignment) is used as the ordinate for data from other sources such as line speed;
- The easting and northing coordinates are used to interpolate the reference wind speed from a digitised form of the Eurocode wind map;
- To identify the locations of tunnels, where no risk calculation needs to be performed;
- To identify the bearing of the alignment so that the wind directions (and hence the strength and frequency of gusts) at different angles to the track can be calculated;
- To provide the input data for look-up of the Fence Factor, KF, describing the influence of barriers; and,
- To calculate the height of embankments and viaducts and the depth of cuttings at each point, as described below.
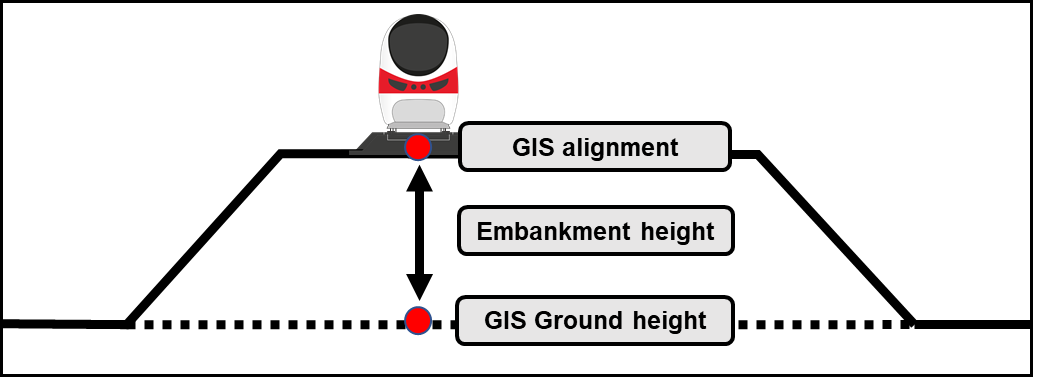
The Topography Factor (KL) associated with embankments, viaducts and cuttings is a function of the height of the alignment above or below the surrounding ground level. This varies continuously along the alignment and would be very laborious to gather manually. However, it can be determined automatically in GIS by subtracting the ground surface coordinate (available in the Geodatabase) from the alignment vertical coordinate for each point along the alignment, as indicated in Figure 10. The same source of information is used to determine the heights and depths of earthworks and structures in the civil engineering design, thus ensuring that the heights and depths used in the risk calculation reflect the actual design.
Advantages of the digital approach
Because the calculation is automated, it can be rerun easily and quickly to evaluate various mitigation scenarios or when new design data becomes available, and it is applicable to future stages of HS2 or other new railways in the UK for which the input data is available in digital form. Laborious gathering of input data is avoided, enabling more frequent re-calculation as the design develops. Furthermore, rigorous and consistent use of live design data reduces the likelihood of localised risk hotspots being missed.
Linkage with GIS enables risk hotspots to be viewed in their geographic context, facilitating understanding of the reasons why risk may be greater in those locations and informing possible implications of mitigation measures such as visual impact of additional barriers.
Sample results
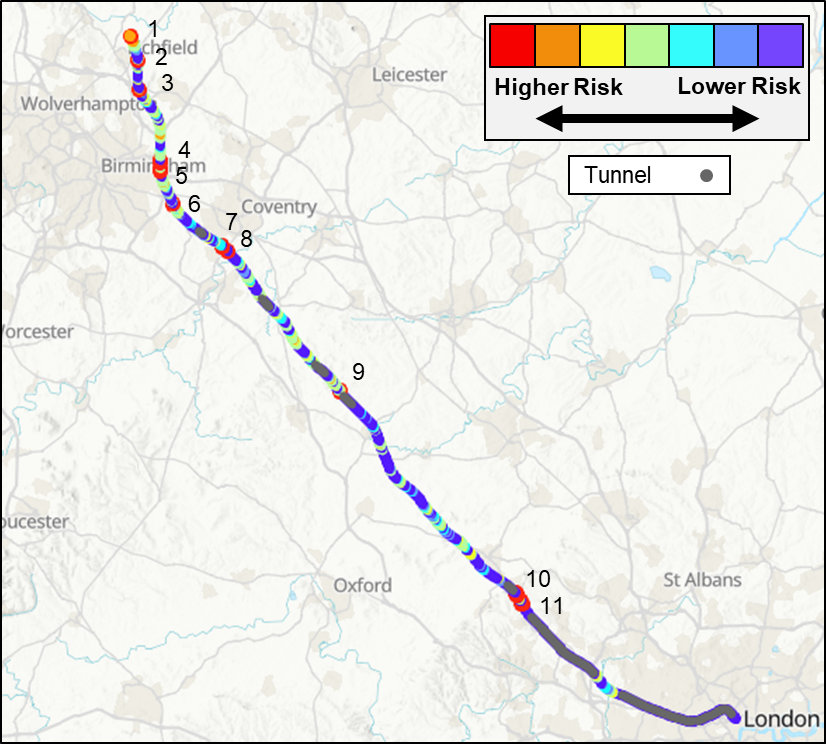
Sample results are presented in Figure 11 for the baseline scenario (no crosswind mitigation). Crosswind risk (probability of exceedance of the critical wind speed, as defined in Equation (1)) is indicated by colour contours, from highest risk, to lowest risk. Tunnels are indicated separately, as tunnel sections of the route are not at risk from crosswinds. These baseline results serve as a starting point for future mitigation studies, indicating risk hot-spots (numbered 1 to 11 in Figure 11) where mitigation measures such as wind barriers might offer greatest benefit. From a route wide perspective, it may offer best value to prioritise mitigation at the most isolated hotspots (those numbered 9, 10 and 11), thus offering resilience against crosswind risk for a high proportion of the HS2 Phase One route. Where hotspots are grouped closely together (those numbered 1 through 8), better value might be obtained by managing the risk through operational processes.
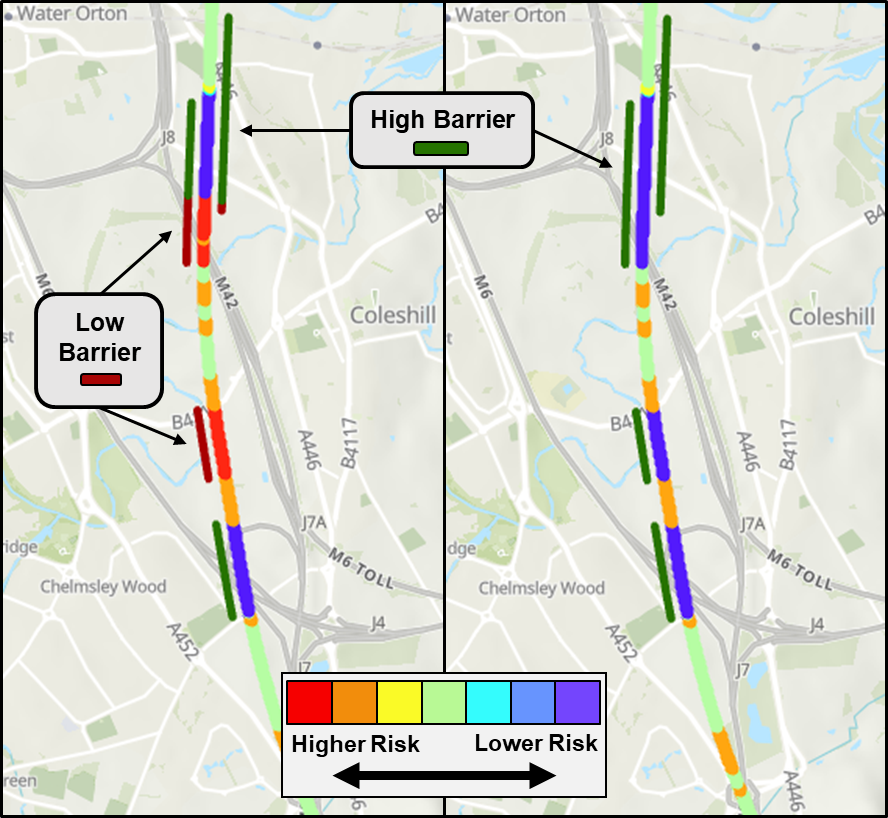
A close-up view on risk hotspots 4 and 5 is shown in Figure 12. On the left-hand image is the baseline result without mitigation, while the right-hand image shows results from an example mitigation scenario. In this case the potential mitigation consists of additional wind protection provided through raising the viaduct parapet. Figure 12 also demonstrates the benefit of displaying the results within their geographic context, enabling users to locate the relevant features and understand the implications of any mitigation measures.
Conclusions
An automated tool has been developed that calculates the risk of trains overturning in crosswinds.
The calculation methodology combines the European CWC-based approach to definition of train stability with the route risk assessment method defined in the RSSB standard RIS-7704-INS.
Input information including the alignment is imported from GIS and other sources. The risk calculation is performed at 20 metre intervals along the route. The calculation results are fed back to GIS enabling presentation of the distribution of crosswind risk along the route in the form of colour-coded maps from which the distribution of risk along the route can be observed and risk hot-spots identified in their local geographic context.
The automated nature of the tool enables rapid assessment of mitigation scenarios. Laborious gathering of input data is avoided, enabling more frequent re-calculation as the design develops. Furthermore, rigorous and consistent use of live design data reduces the likelihood of localised risk hotspots being missed.
Operational mitigation measures, such as restricting operations during extreme weather, are not currently included in the risk calculation, but can be added to add value to the tool in further development.
References
[1] Paradot et al. (2015) Crosswind sensitivity assessment of a representative Europe-wide range of conventional vehicles. Proceedings of the Institution of Mechanical Engineers, Part F: Journal of Rail and Rapid Transit
[2] CEN (2016) Railway applications – Aerodynamics – Part 6: Requirements and test procedures for cross wind assessment
[3] Rail Safety and Standards Board (2018) Calculation of Enhanced Permissible Speeds for Tilting Trains
[4] High Speed Two Ltd (2019) HS2-HS2-RR-SPE-000-000007 – Train Technical Specification
[5] British Standards Institution (2010) UK National Annex to Eurocode 1: Actions on structures. General actions. Part 1-4. EN 1991-1-4
Peer review
- Thomas Williamson, Rail Systems Engineering DirectorHS2 Ltd