Automation process for the delivery of Design Element Statement Reports
This paper outlines the development, functionality and benefits of automating delivery of Design Element Reports on the High Speed Two (HS2) Programme, leading to improved efficiency and consistency.
A Design Element is an individual, or group of HS2 civil engineering assets that are summarised in Design Element Statements for the purpose of informing the Environmental Statement, providing an immediate source of information during the petition phase of the project and to act as a starting point for subsequent design phases. The statements collate information from a wide range of sources, link to technical information and capture environmental, engagement and engineering design history. Historically these Word-based reports have been manually populated by individual disciplines extracting data from existing deliverables and project data. This was a complex and time-consuming task that was difficult to manage in terms of the assurance and delivery of data and reports.
An innovative automation process was developed to deliver 483 reports for the HS2 Phase 2b Eastern Leg. The process enablesd efficient report population using automatic mining of existing data into an online database, including utilising Building Information Models and Geospatial Information System data.
This innovative method captures revision history, improves consistency and reduces repetitive inputs, formatting and enables live progress reporting to manage the production activities and assurance process. The automation tool is accessed via a web-based portal allowing concurrent editing and reviewing realising efficiencies. Upon completion, a statement or multiple statements can be automatically generated. The portal also includes a delivery progress dashboard.
The automated process demonstrated efficiency benefits during Phase 2b. Further future benefits and improvements have been identified:
• Repurposing of the mined data in other deliverables and reports.
• Use of the database system to manage HS2 registers, enabling more collaborative access and reporting methods.
• Further integration with HS2’s asset management database and reporting tools.
• Increasing the portal’s functionality to extract a wider range of GIS and CAD design information.

Introduction
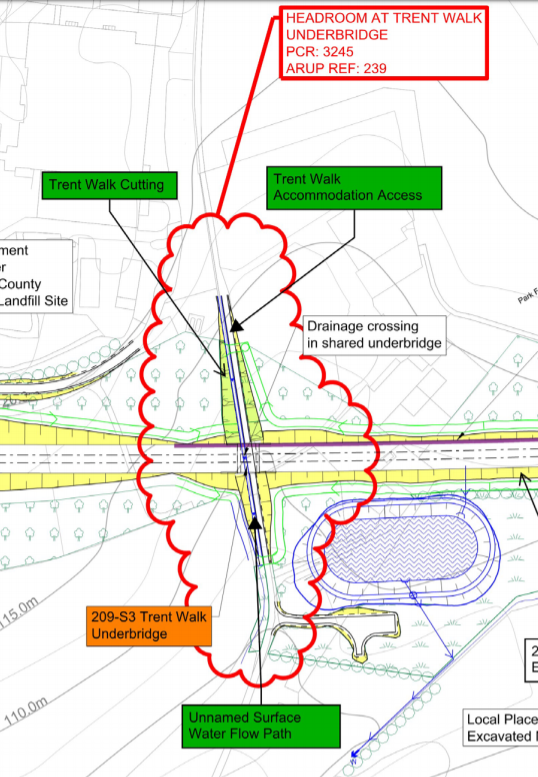
A Design Element is a grouped set of civil engineering assets or features that capture design history and asset information of discrete elements of the HS2 project. Figure 1 shows an example of an asset group combined into a Design Element for the purpose of creating a Design Element Statement. In the figure all assets belonging to the DES are labelled in green or orange and included within a red cloud.
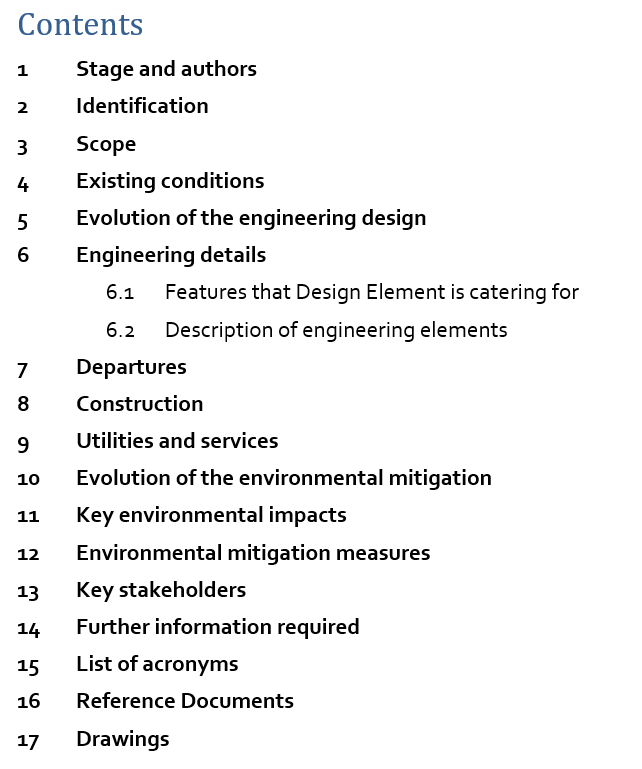
Information on each element is contained within a Design Element Statement (DES) Report. The information-rich statements collate data from a wide range of document sources, link to relevant technical information and capture environmental, engagement and engineering design history. (Figure 2).
These statements were originally developed as part of HS2 Phase One, in order to capture the design history and asset information of discrete elements of HS2. These documents provide the project with readily-accessible design information of an element in one place. These reports have evolved and are a requirement on both Phase 2a and 2b. Particular uses have included as a reference for answering queries through the petitioning phase of the hybrid Bill and to provide information to supplement tender documents for the construction phase of the project.
The data-rich documents present a challenge to those collating the documents, with the need to extract information from existing data sources accurately and efficiently for a large quantity of DES. The data is often stored in lots of different documents, models and from the inherited knowledge of the project team. Due to the nature of the programme it is also challenging to ensure configuration management of the data inputted ensuring all data is based on the agreed design baseline at a control point.
The DES automation process was developed in response to the desire to improve efficiency, develop a ‘right first time’ approach and link a data-rich document to the original source information. The process also presents an opportunity to repurpose data for other uses, while recording its configuration status and source.
This process has reduced production costs due to the reduction in time required to populate, check and update a large quantity of statements, whilst also creating a data set that can be used for other deliverables.
Development History
These statements hold large quantities of HS2 information and data on HS2 assets, provide links to source information and detail the design development history of elements. This information is needed during hybrid Bill petition phase of the project and to inform future design stages. These documents are therefore very important for capturing project knowledge at each design stage.
Problem Statement
During HS2 Phase and the early phases on HS2 Phase 2a, documents were produced by individual team specialists independently accessing and inputting into documents which were stored on a local project drive and later Bentley Projectwise. In line with the document template these documents were produced in Microsoft Word. This work preceded Microsoft’s developments on collaborative editing, therefore individuals from different disciplines had to take it in turns to provide technical input into the documents. This made tracking progress difficult and inefficient for individuals to manage their workload based on the availability of documents.
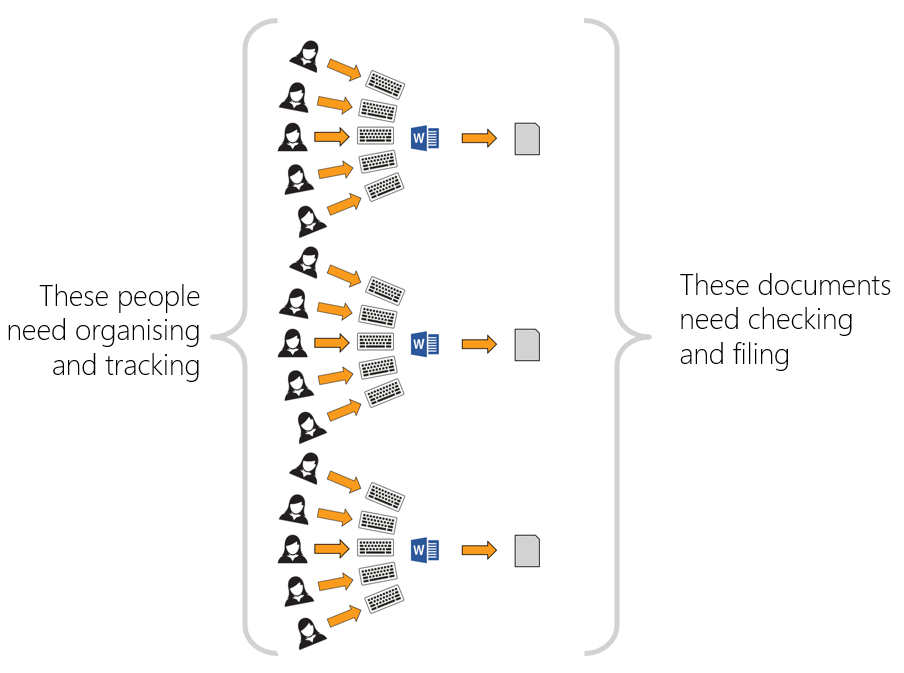
The following issues were identified with the Phase One and initial Phase 2a methodology of compiling these documents as shown in Figure 3.
- Multiuser access – historically, there have been limited mainstream platforms that successfully allow for multiple users to edit a Word document simultaneously, meaning inputs took longer and required a greater effort of planning to manage resources required for the report production.
- Co-authoring – the reports require a multidisciplinary team to provide input, meaning there is the potential for lack of ownership of section inputs and the opportunity for data to be incorrectly overridden.
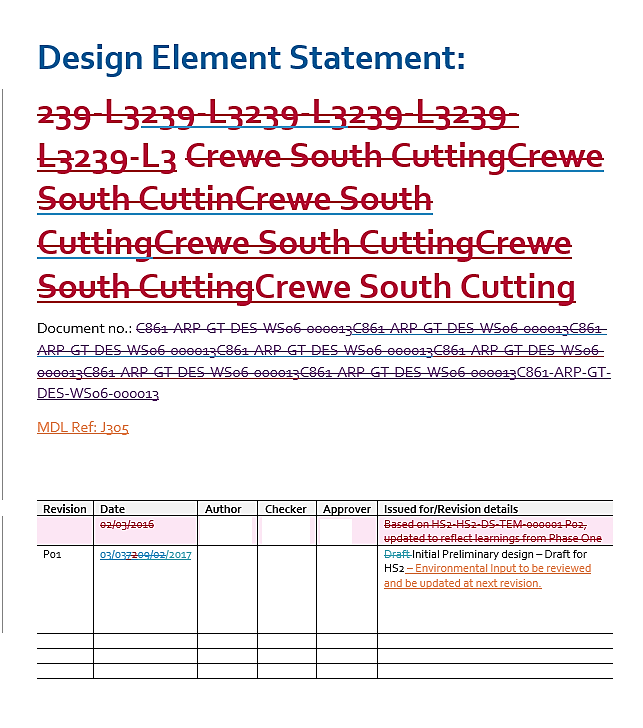
- Change tracking – the use of Word track changes in a document with complex formatting can make changes difficult to identify and cause poor performance of documents in terms of speed and stability. (See Figure 4).
- Data configuration – once data is extracted from the source data and copied into the template there is no version control on the data, meaning future updates to source data may be missed and misalignment / errors introduced.
- Progress tracking – without opening individual word documents or maintaining manual trackers it is not possible to track author progress and checking of documents.
- Formatting inconsistencies – with individual documents, it is not possible to ensure that formatting of templates is maintained when edited by multiple authors.
- Repetitive manual data entries – repetitive data entry is time consuming for individuals to enter manually and introduces a risk of errors in the data entry process. Examples include copying of CDM risks from the CDM risk register to the report and extracting bridge specification data from registers and entering it into the report.
- Bulk changes – requests for bulk changes to document data and formatting must be made in individual documents.
- Assurance – with multiple authors and source data, assurance checks are complex and time consuming. It is not possible to divide up the checks easily between appropriate reviewers without sharing the whole document.
Alternative Solutions
As part of the concept stage of development the following solutions were considered, but discounted:
- Use of Microsoft 365 cloud software to allow users to make use of the simultaneous edits. This solution solved the issue of multiuser access but did not solve the issue of individuals having to manually enter data and the associated quality issues this introduces as raised above.
- The collation of all data in a spreadsheet (or discipline-specific spreadsheets) and then a macro used to populate the Word templates. Although an effective way of collecting data and proven to have the ability using macros to write to templates, the concept was not deemed to be sufficiently robust, placed restrictions on future development opportunities and was not considered scalable.
- A Microsoft Access database to allow users to input data into a portal and then generate Word reports. Like the above, this was considered an effective method for collecting data, but limited future potential developments to the system.
The above provided solutions to some of the challenges identified, but no single product solved all the challenges and gave the flexibility of being able to write in additional functionality as understanding of the system’s capability developed.
Development Stages
Having considered and disregarded alternative solutions an online database solution was selected. Similar systems have been developed and demonstrated to provide efficiency benefits in other engineering contexts and this option was considered suitable for solving the problem statement.
The chosen system uses a single codebase, hosted on an online cloud system. This was chosen for its accessibility, configuration management and its ability to be customised to meet user requirements.
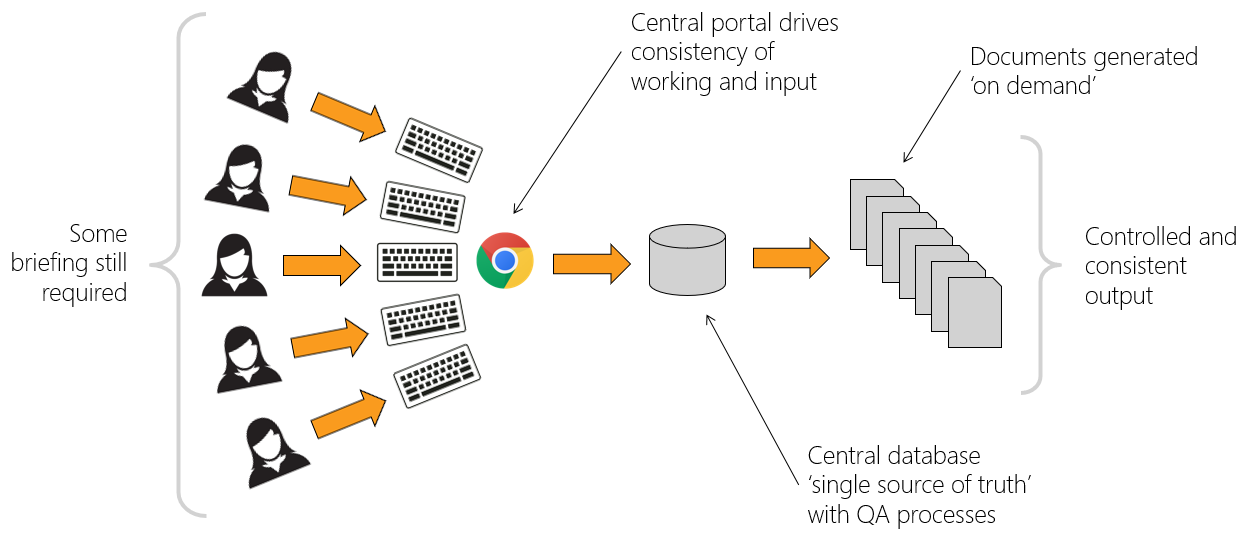
Holding all data in a secure central online cloud database, that can be edited by multiple users in a controlled environment via an online portal allowed the challenges set out above to be overcome. Once all the data is complete and checked, the production of the final document is automated, providing consistent and assured outputs.
The concept was originally developed and tested on HS2 Phase 2a (stage 1), before being developed further with learnings from the first phase in stage 2 on HS2 Phase 2b. Details of each stage are below.
Stage 1: The solution was originally developed for HS2 Phase 2a. The team reviewed the existing DES report template and created a data field on an online user portal which corresponded to a section of data in the Word template. The system allowed users to input to an online portal all the data they would historically enter into a Word document. The system was also reverse engineered to extract to the data entered to DES reports already created from previous stages of the project.
Once the data was inputted into the portal and checked the data was automatically merged into the DES Word document templates and delivered to HS2 (see Figure 5). This stage 1 development solved many of the issues identified in the above problem statement but configuration management, mining of data from existing sources and checking required further improvement.
Stage 2: Stage 2 built on the platform developed for Phase 2a, but with added functionality. By reviewing the report template, the team identified the ownership of each item of data. This allowed greater assurance by creating security groups so authors, checkers and approvers could be assigned to individual data entries and track discipline progress. In addition, existing data sets were mapped (e.g. registers and schedules), developing a system that automatically harvested data into the database from assured data sources, recording the version and assurance of the data.
Additional functionality was added to allow individual disciplines to collaborate on design history text, where a consistent narrative was required with inputs from discipline specialists. The process ensured individual inputs were first captured and assured, and then an automated process generated consistent series of paragraphs, bringing together the individual inputs into report paragraphed narrative, which could be reviewed.
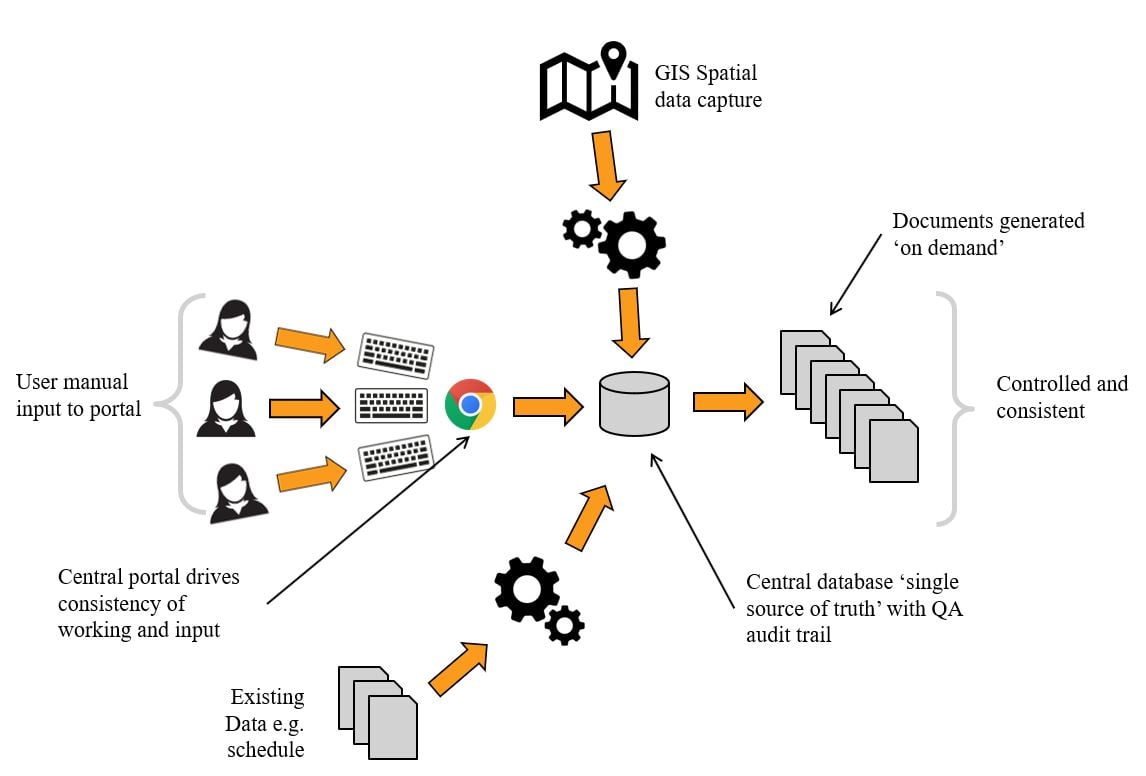
These improvements reduced manual entry of data and increased the ability to manage the configuration of the data. The use of GIS for the population of spatial data like Utilities was also introduced in a limited capacity. The approach can be seen in Figure 6.
System Operation
The system consists of the following elements and are detailed further in this section:
- Digital platform – the platform used a Python “scripting language”, which is used to control web-based tasks and applications. It is used to host the different data processing and visualisation modules and allows them to work together.
- Data library – a flexible data storage layer holds various types of data in different formats such as text, numbers, images and other files. The data library represents the ‘single source of truth’ and is the one central access point for all project specific information.
- Data processing layer – the processing layer consists of scripts written in Python and SQL (Structured Query Language) programming languages. This coding retrieves and stores project specific data in the database, handles the quality assurance processes and applies the requested report styling to the data.
- Web application – the web application consists of an interface to display available data and give the user the opportunity to adjust and complete the report content.
Digital Platform
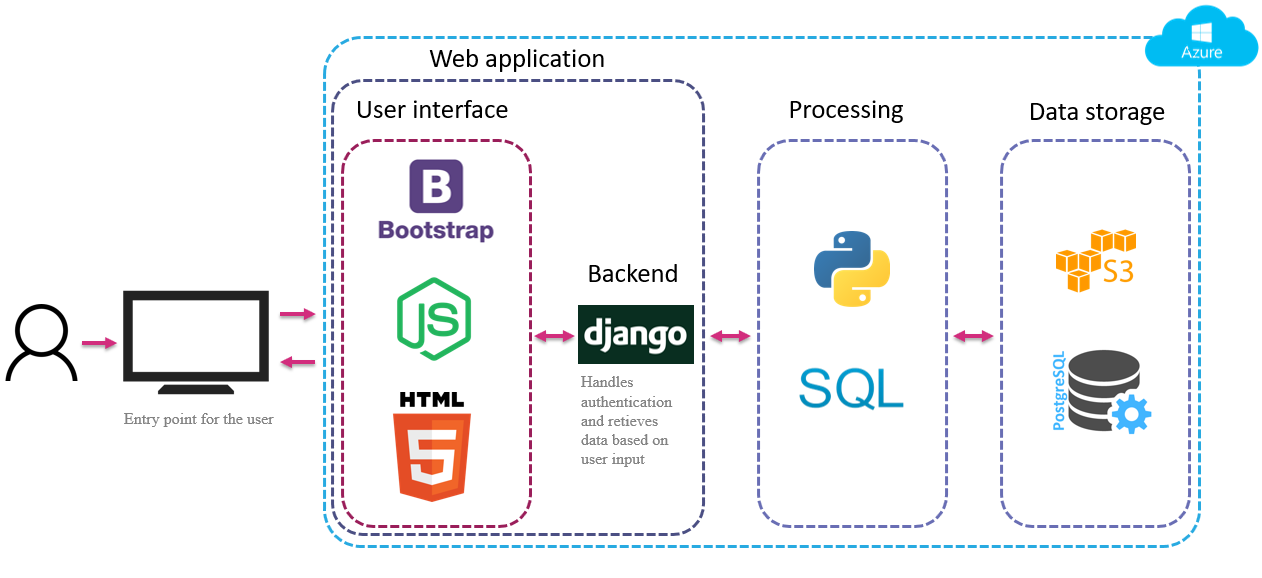
The technical components and applications of the digital platform are shown in Figure 7 and is controlled using the Python scripting language. It is hosted on the Azure web hosting service, which makes it highly scalable, secure and accessible from anywhere at any time.
The platform has been developed using the agile product development methodology allowing for collaboration of multiple developers. This has also ensured the end user needs and requests of HS2 have been incorporated efficiently into the system, by prioritising user-requested functionality and priorities being delivered in small manageable packages which can be tested and deployed rapidly. A development portal has been used to test new functionality on a mirrored data set before being rolled out in any live portal. The codebase is revision controlled using Git.
Data Library
The data library was designed as a ‘single source of truth’, enabling the retrieval of all project-related data from one central access point. This setup offers multiple advantages:
- the ability to access all project-related data from one central access point;
- reduces the time to find information, resulting in increased productivity;
- ensures the most up-to-date information is available at any time and;
- cross-examination and overlay of data, enabling audit histories to be generated.
The central access point approach enables the retrieval of data not only from the central project database, but across a range of different physical and cloud storage systems (such as the Amazon S3 store for files, or GIS databases). This provides the ability to seamlessly interface with external data sources and to allow data to be accessed and used by anyone on the project.
The data library is designed in such a way that it provides the ability to store different data types, formats and sizes. At the heart of the data library is a Postgres database that holds tabular project information. Images and other files are stored in an Amazon S3 bucket and are linked to the Postgres database via file keys. The Postgres database is also the place where the report templates and assurance information are stored. It is characterised by a flexible table structure, which makes it scalable to future report types, sizes and contents.
Data Processing Layer
The processing layer has several functions:
- retrieval of project specific data from the database;
- collection of user generated data from the user interface;
- handle the assurance information;
- applies report formatting and;
- prints the report.
The processing modules are written in SQL and Python. One of the core libraries that has been used is the python-docx package which contains a selection of scripts for creating and updating Microsoft Word (.docx) files.
Web Application
The web application front end is built using Javascript, HTML (Hypertext Mark-up Language) and CSS (Cascading Style Sheets). The back end is written in Python using the Django Framework, with a Postgres database behind it to store all the data.
The application is partially created from templates in the back end, and partially using web components with API (Application Programming Interface) calls to the back end to update or fetch data. As the system has developed an API-only approach has been adopted to allow simpler connection with other applications.
The web application has the following main sections:
Projects and scope
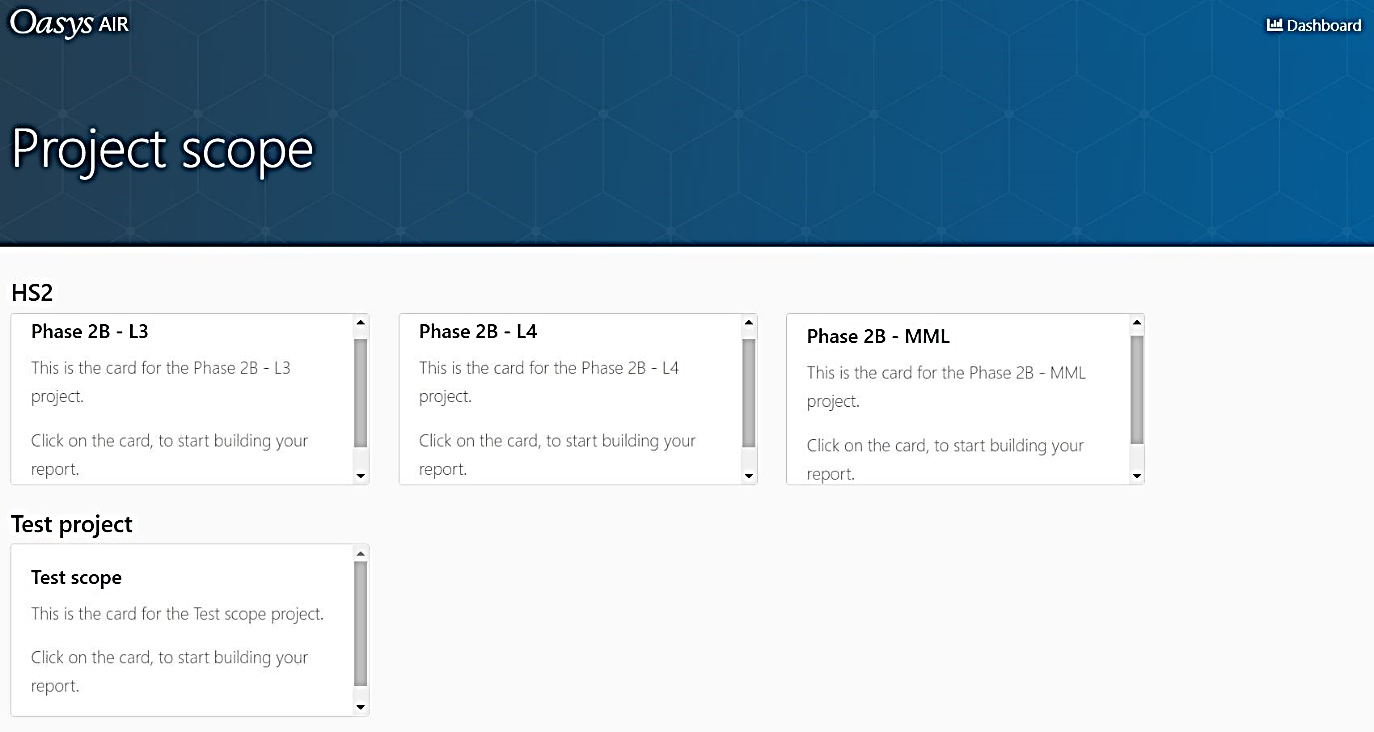
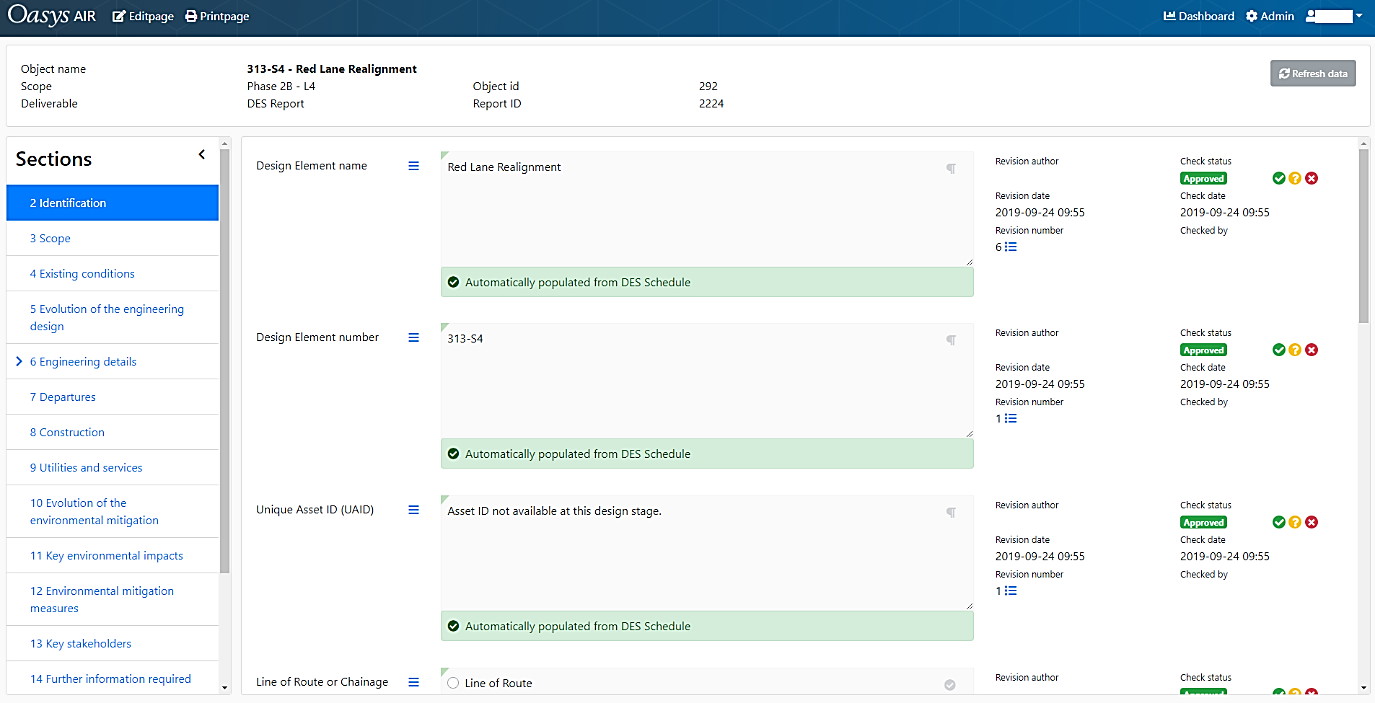
In this section of the application, the user can select a project, scope and report to work on (Figure 8). The user will only see what they are allowed to see based on their assigned user roles (see section on Assurance).
Report Content Manager
In this section of the web application a user can edit the content for a selected report, view the historic changes of content, and change the approval status for content. The user will only be able to see and approve sections and content that they are allowed to see from their assigned roles. The content manager is set out in sections which align to the template of the DES report (Figure 9).
Printing & Dashboards
These sections allow the user to print versions of the report as intended to be viewed in Word format and review progress. More information can be found in the System Benefit Section of this paper.
Administration
The web application has an administration section, where users, user groups and roles can be managed by an administrator. In this section users can also manage the report structure, by adding, updating or removing content items. These changes can then be applied to all reports which then are instantly visible to users of the tool.
System Benefits
This section outlines the capabilities of the system and the benefits each element brings to the system.
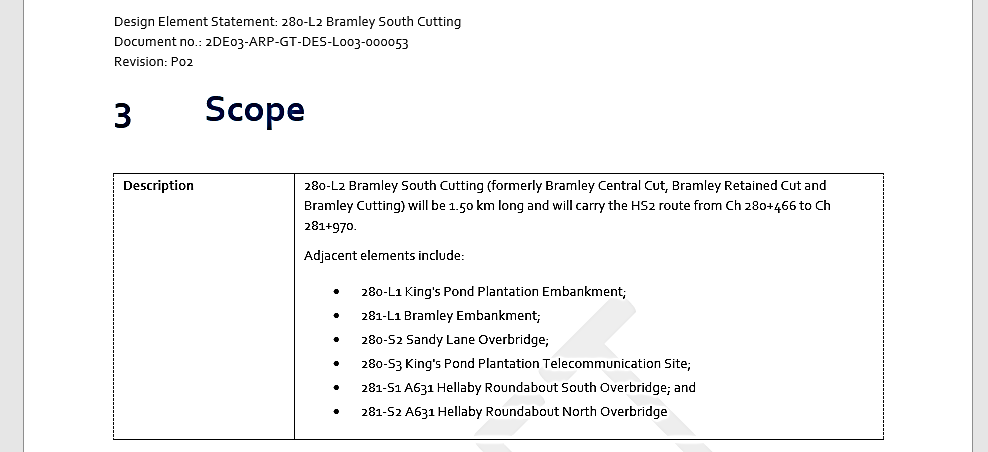
Figure 10 shows a completed “section 3”, a simple example of how the system uses a central database to populate text intelligently. This is broken down in the following steps:
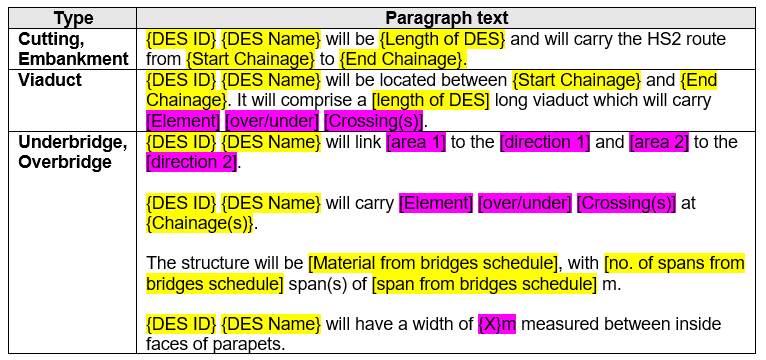
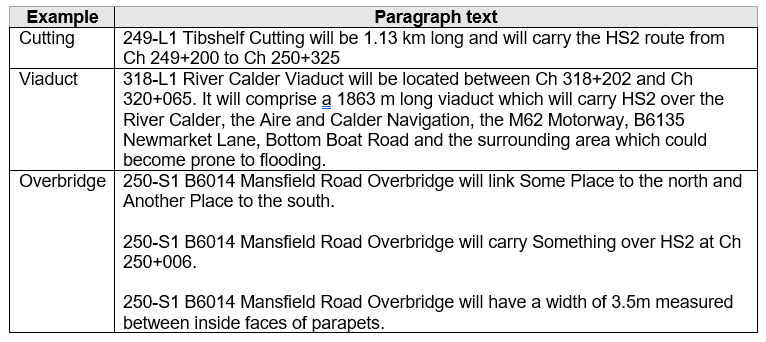
- Wherever possible, opportunities to use standardised text in a document was identified to enhance the extent of automation. Within the standardised text, the unique data entries were identified, as highlighted in Figure 11. Within the database these are stored as discrete entries. Figure 12, shows how this text appears once populated.
- For each unique data set the source of this information was identified. For instance, Figure 12 shows that the “DES ID” is sourced from the Design Element Schedule. By knowing the source this information can be automatically mined from an approved version of the schedule into the database.
Bulk uploads of data avoids errors from manual inputs and is more time efficient. Once set up, the process is repeatable for new versions. By recording the version of the data, it is also possible to ensure the data is current and aligns with the rest of the report information.
Concatenation of Text
The design history sections of reports are a chronological description of the evolution of the design, with inputs from multiple design disciplines. This creates a challenge to ensure a consistent style, formatting and content.
Figure 13 details the process to create greater consistency, reduce time and record all discipline inputs. Individual disciplines provide relevant design history for each DES for the appropriate design stage. This process allows individual disciplines to assure their inputs while the final text is compiled by a final reviewer and approved by an appropriate reviewer.
- Approved discipline text is concatenated by reviewers automatically, combining the individual entries into a single paragraph of ordered text.
- The reviewer checks the readability of the combined text before approving the text. This increases efficiency as the reviewer doesn’t need to check individual entries for accuracy.
- Full text is outputted to the report when required.
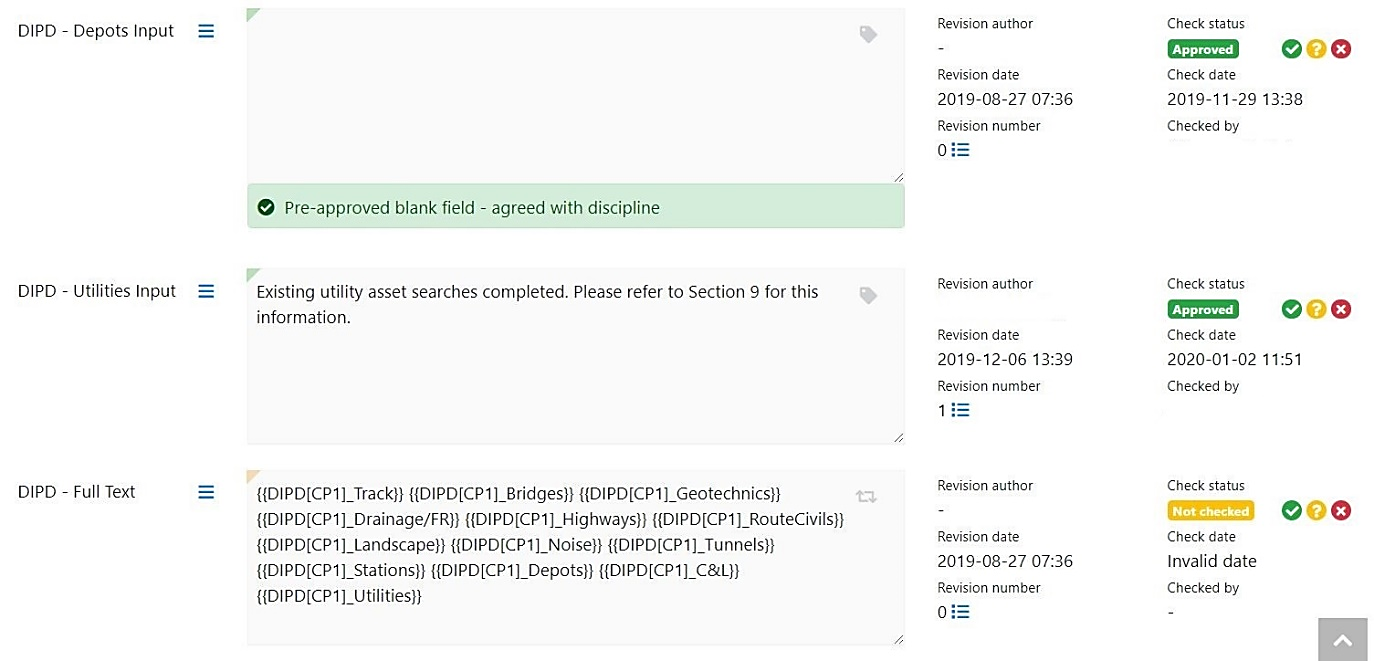
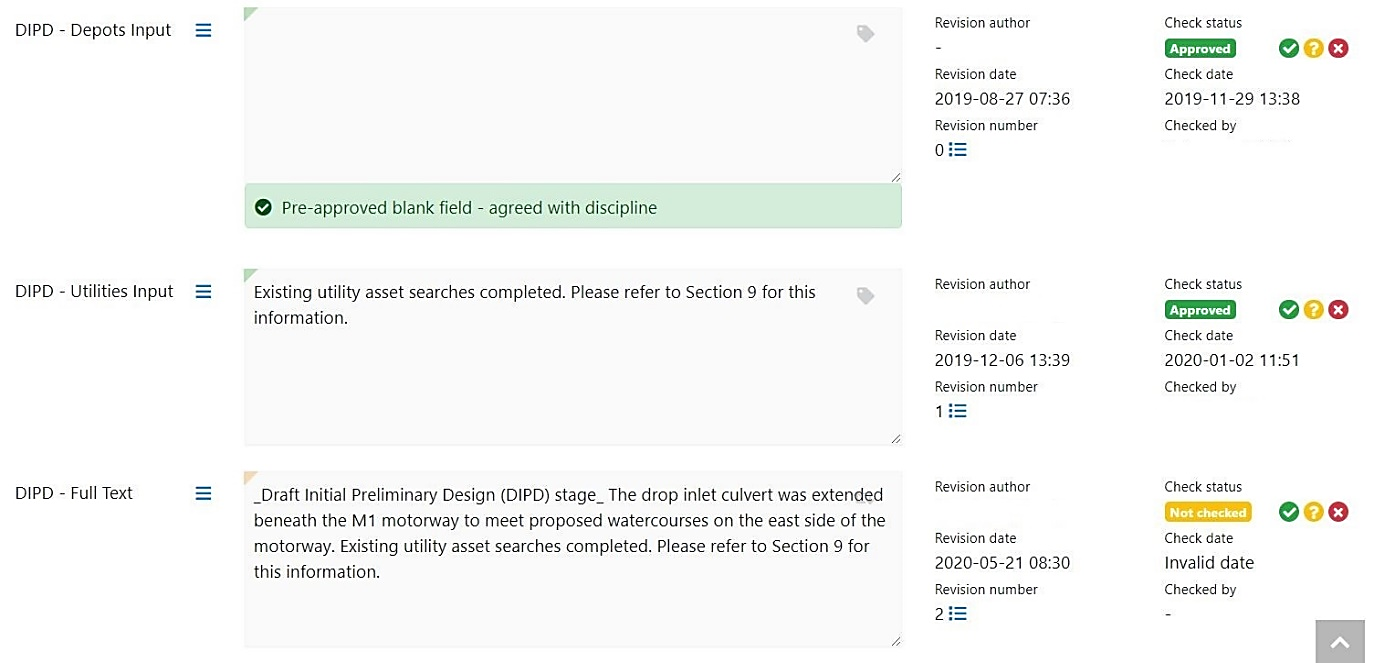
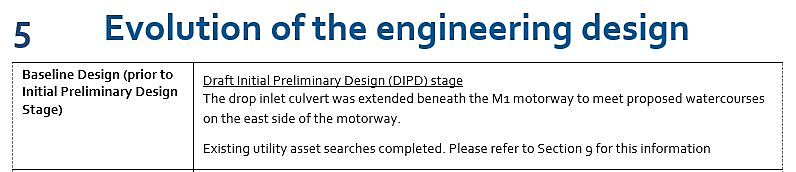
Figure 13: Process of concatenation of text
Multiuser Access
By hosting the data source on the cloud, the system allows users access via an online portal using a secure individual log-in process. The system allows multiple people to edit each statement simultaneously. Each change is recorded and supersedes previous entries. This significantly increases efficiency by removing user access restrictions on when data can be edited, creating a flexible workflow for creating a large number of statements.
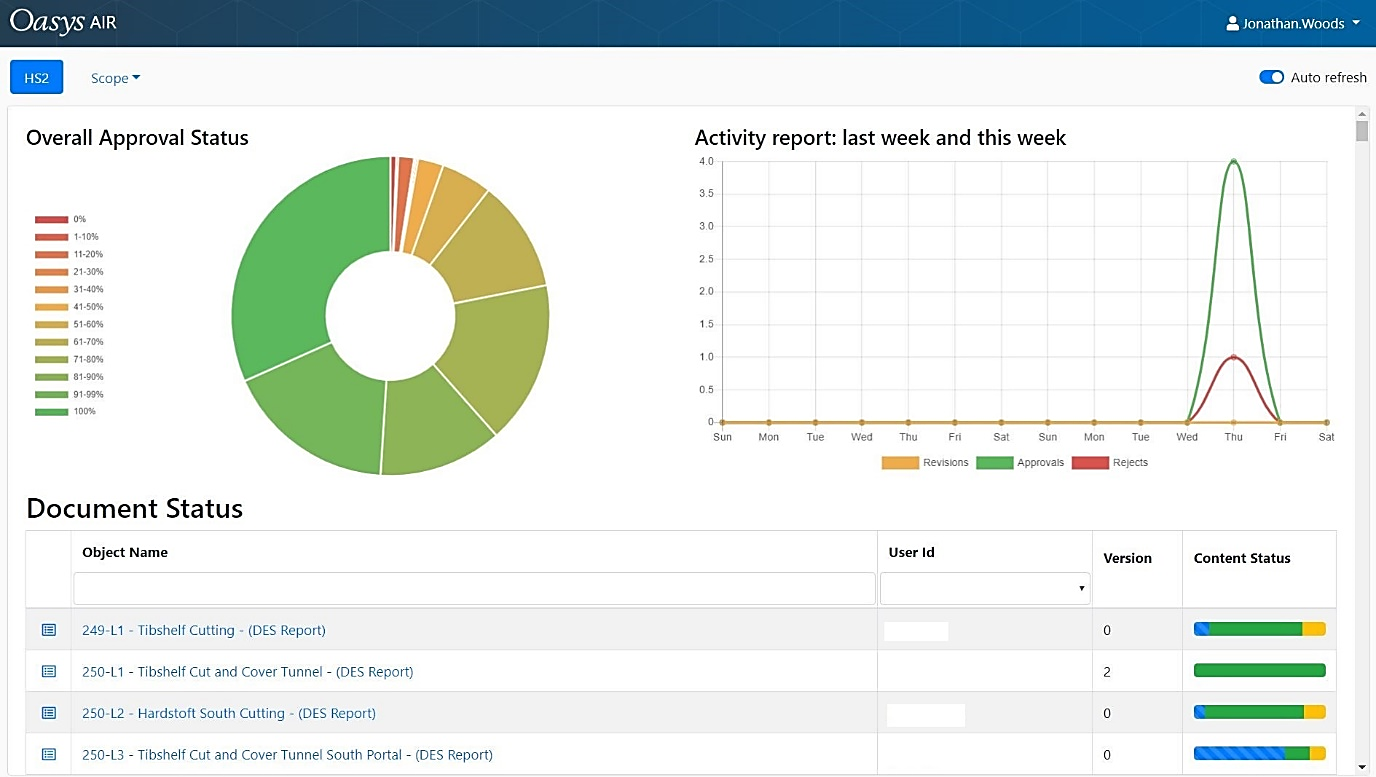
Dashboard Reporting
With a large volume of data and users, it is important to monitor progress. The portal provides instant feedback on progress of each DES with the following dashboard information (See Figure 14):
- Percentage approval of DES Reports
- Graph showing number of revisions, rejections and approvals
- Status of each report
- Within each report; data status by section
It is intended that the next iteration of the dashboard will implement increased filters (e.g. by location) and the functionality to review discipline and individual progress. This improves reporting, issue identification and awareness of reports ready to issue.
Drop-down Selections
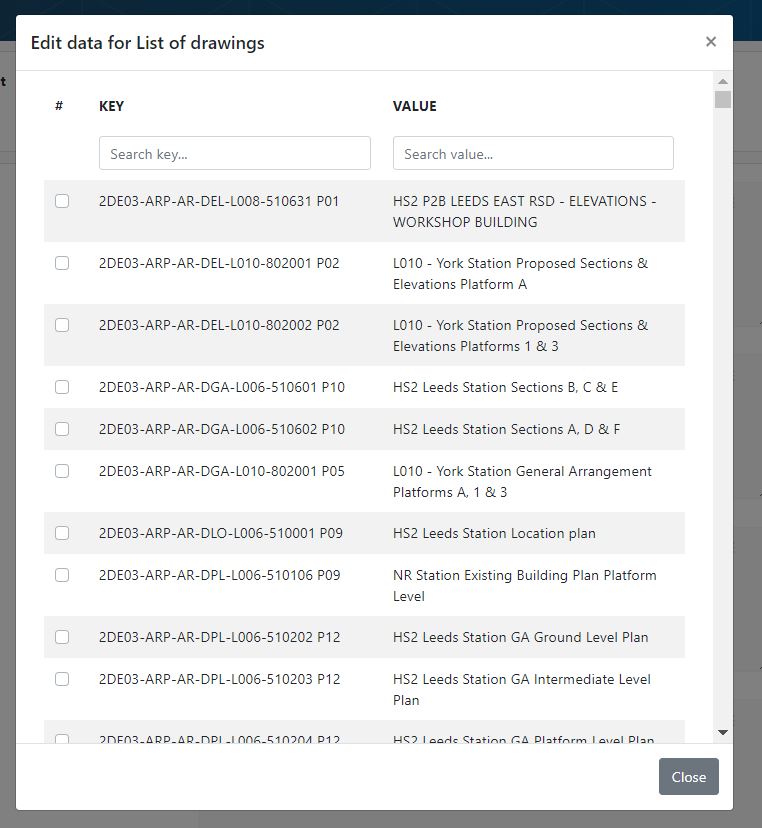
To improve the consistency and speed of data entry, drop-down lists are available for sections of the report in the portal (See Figure 15). This is used for the glossary and references sections. Where the template requires multiple choice a tick lists have also been used.
Selection lists are defined by the source data. For example, the drawing lists are defined by the Master Information Delivery Plan which lists drawings, version and stage. By using this source data, the system can ensure that the correct references are used and the format of the information is consistent.
Based on DES location and type (e.g. a bridge), the system enables users to make bulk selections of data automatically. For example, all drawings were automatically selected where their coverage coincided with the DES area.
Geospatial Information System (GIS) Data Extraction
Utilities assets are required to be listed in the statements where they are coincident with the Design Element, either existing or modified by the scheme. This task would be time consuming if done manually by looking up drawings and entering the lists of assets. A tool was created that made use of the utility information contained in GIS, including the type, owner, size and location of each asset to auto-populate this information in the statements.
By using the location information, cross referenced to the Design Element chainage the system allowed the user to automatically extract all relevant utilities information for each section of the report. In addition to the time saved, this method ensured increased accuracy and consistency in the information presented.
The platform has the future capability to incorporate a greater use of GIS and Computer Aided Design (CAD) to extract data.
- GIS – opportunities have been identified to integrate drawing key plans, tag documents with location and incorporate the use of spatial survey data stored in GIS with a data set defined by the area of a DES. GIS could then compile data and documents associated with a design element in an increasingly automated manner.
- CAD – using a combination of CAD, GIS and FME (Feature Manipulation Engine) software there is the software capability to extract measurements from design data, to populate data tables which form part of the report.
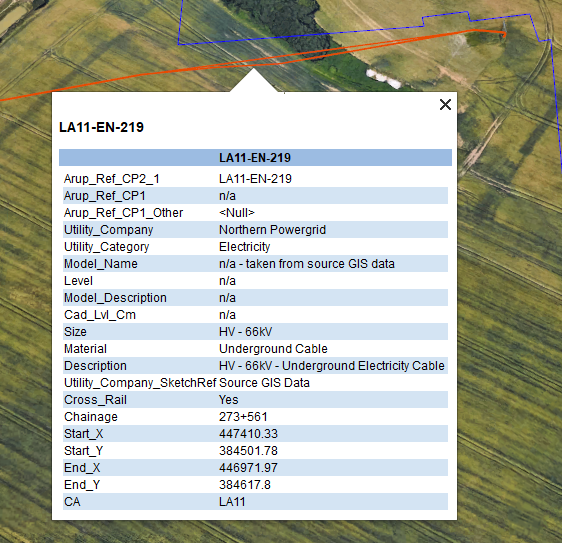
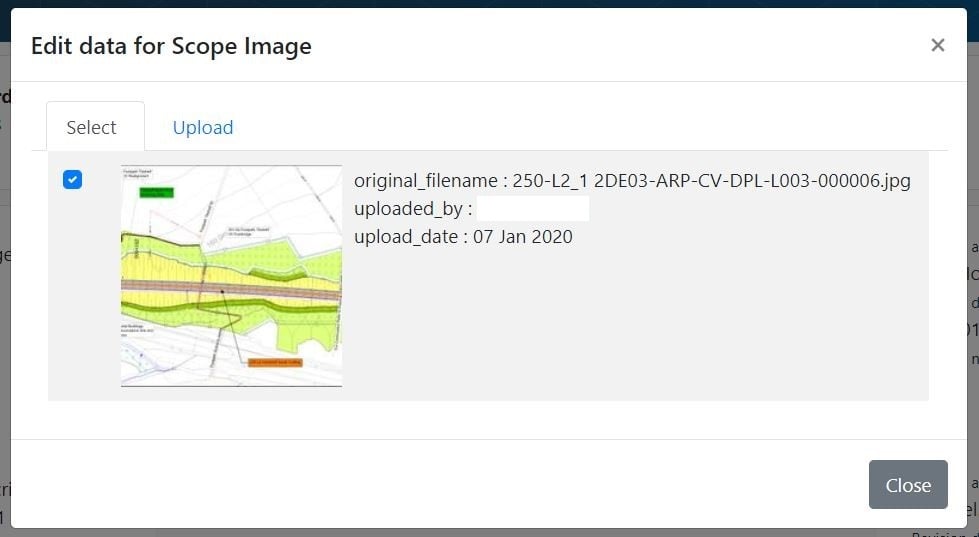
Image Insertion
The portal has the functionality to upload images that are merged into the finished statements. This ensures there is an audit history behind the image upload, which is particularly important where screenshots are used. The upload requires users to input the image meta data, which ensures that the information is consistently formatted within the documents. (See Figure 17).
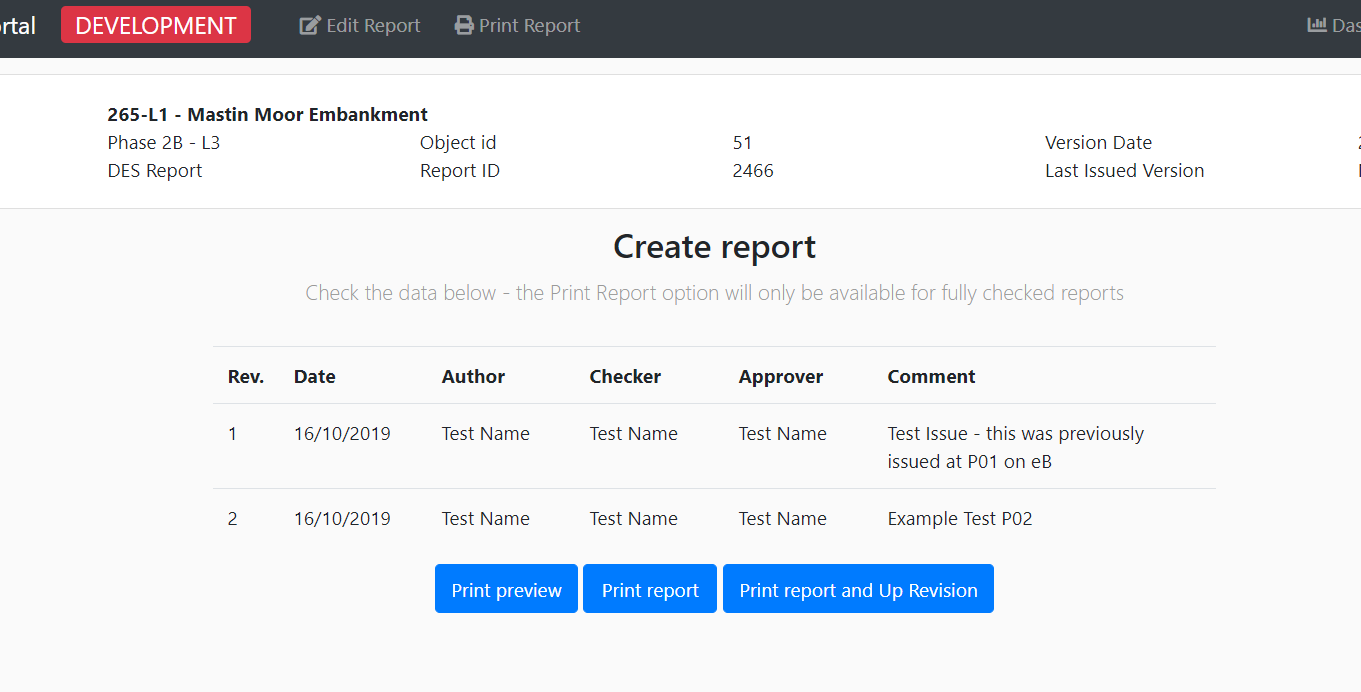
Producing Reports
At any time, the portal allows users to produce a document preview, allowing the user to read the document in its intended format. Until all data is approved the document can only be produced in draft form, with appropriate watermarks.
Once all data is approved users can create and produce revisions of documents as shown in Figure 18. This process requires the user to input the quality assurance data and it will record who has produced the document. The system logs each version of the document and the revision of the data which supported it. This means the system can roll-back and report on data belonging to all versions.
Process of built-in assurance
Built into the system and processes are several features to ensure that the data entered and provided in the statements is reviewed and assured in line with the projects quality management procedures. Each safeguard is there to ensure the data has origin, is reviewed by a competent person and there is a clear audit trail. The following safeguards are in place:
- user permissions;
- source data dependant approvals; and
- audit histories
Permissions
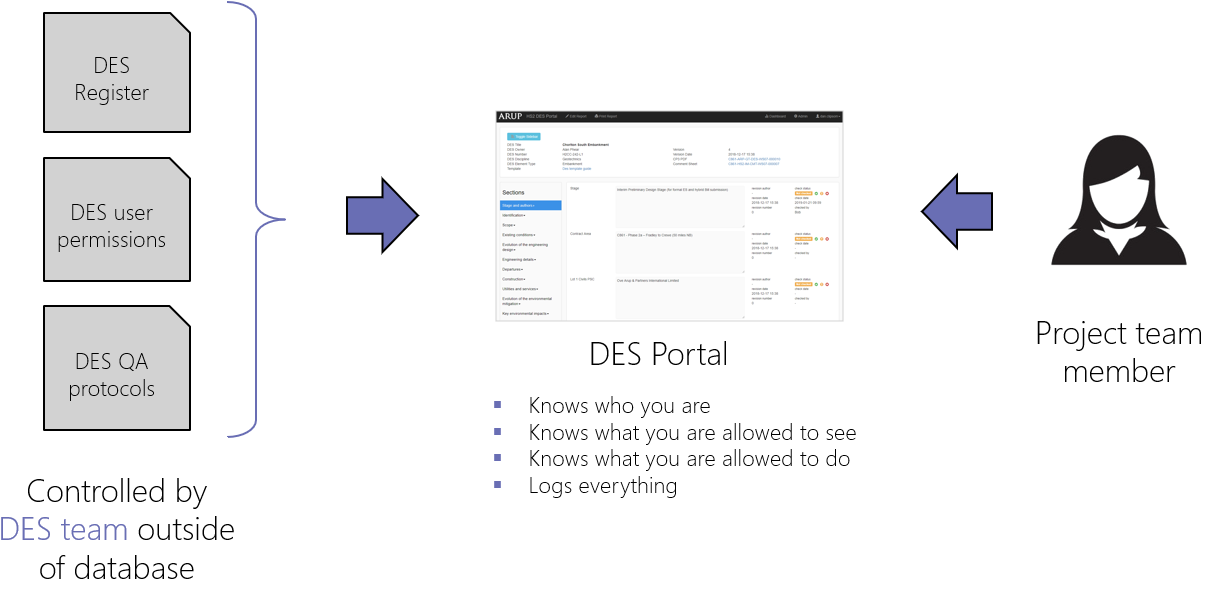
The first stage of the assurance process is to make the data secure and for the system to know who is editing and reviewing the data. To do this every person has a unique secure log in and assigned user group (Figure 19). This allows for the following functionality:
- Secure data.
- Restrict access and functionality based on user groups and individuals.
- Track changes made by all individuals.
- Give permissions rights for authoring, checking and approving based on a person’s specialism and competency.
This functionality gives the confidence that all the data is reviewed by a competent person and an audit history is maintained of the assurance.
Source data dependant approvals
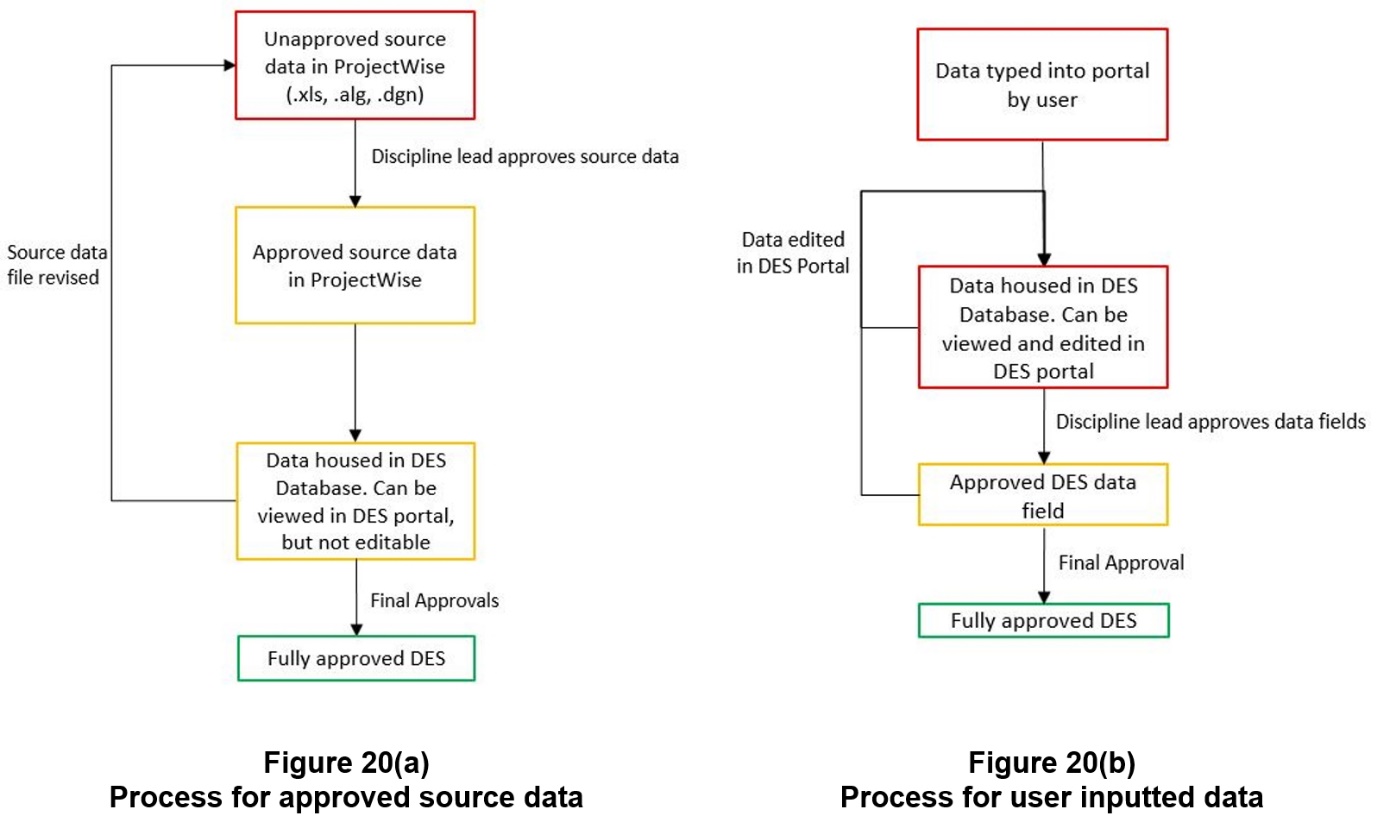
Building on the user permissions the system has two ways of assuring data (See Figure 20).
- Approved at source – the system functionality enabling bulk upload of source data means that the database and source are connected, allowing for easy configuration control of data. The process ensures that the data in the portal matches the source information with no errors introduced by manual entries. For that reason, approved source data doesn’t need a secondary check in the portal. Once in the portal this data is shown as auto-approved and cannot be edited.
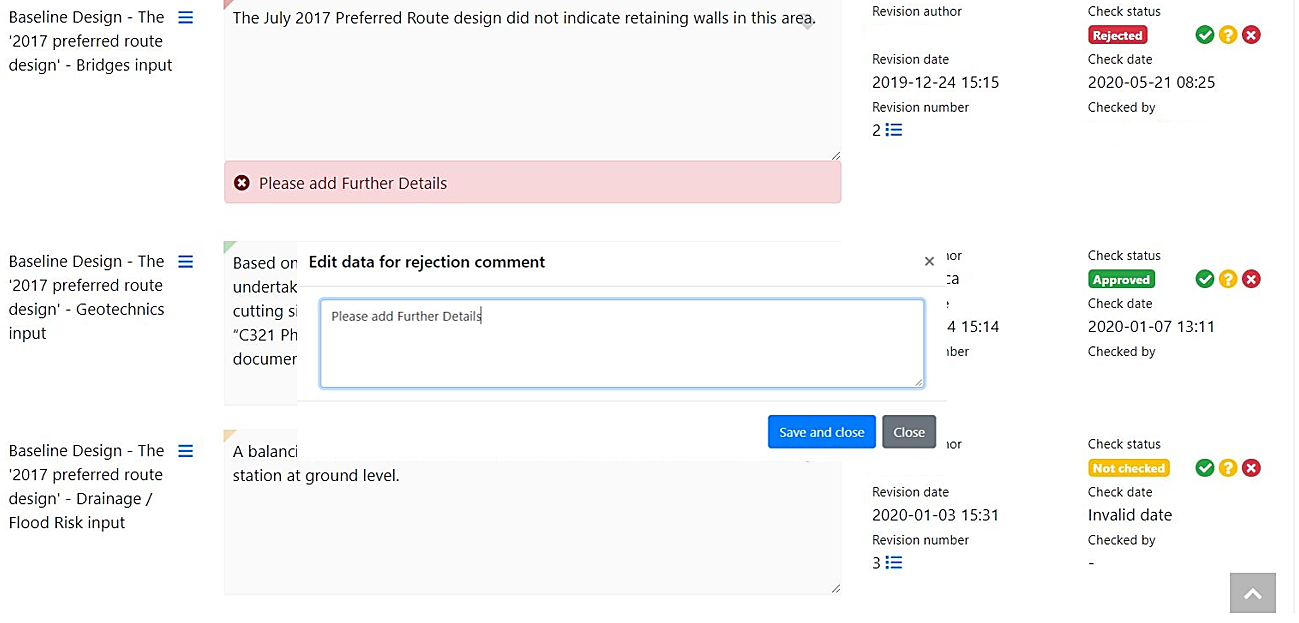
- Approved in the portal – for data entered into the portal the system follows a typical author, check and approval process, guided by user permissions (See Figure 20). All data entered into the portal requires a reviewer to confirm the information is checked and approved. Reviewers also can reject information that needs revisions, leaving a review comment. This assurance check is recorded in the system, to demonstrate the quality process undertaken (See Figure 21).
Audit Histories
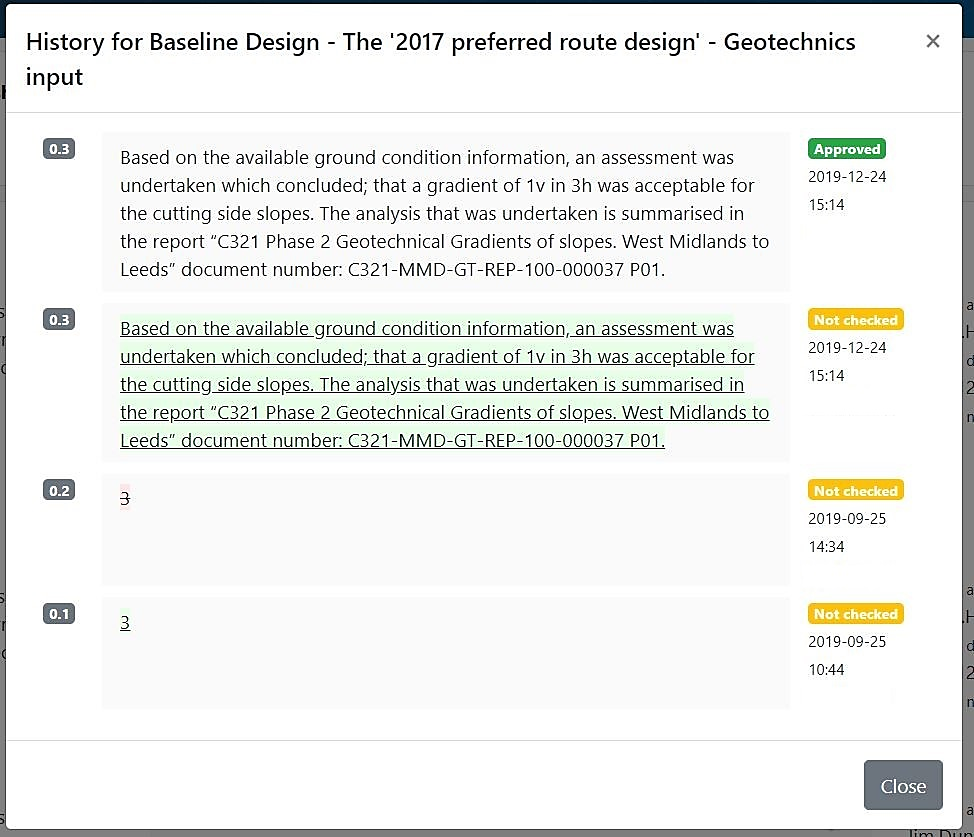
The system provides the functionality to allow users to view a full audit history of any data set, including tracked changes, versions and review comments. This is presented in an easy to read form (Figure 22).
HS2 Systems Integration & Opportunities
The central database holds a wealth of information, some duplicated from other products, but also includes unique project data. That means the database has the potential to be used more widely than the production of DES reports.
All the data stored in the database is “tagged” with unique identifiers including the DES ID and the Asset ID. These tags give the database the potential to be integrated with existing, or future HS2 data environments.
Asset Information Management System (AIMS)
HS2 primary asset management tool is AIMS. This is a database of information, aligned to assets. Multiple assets may exist for each DES. The amount of data currently stored in the DES database exceeds the data required for AIMS for the hybrid Bill design stage, so there is the opportunity to increase the richness of data in AIMS at an earlier stage of the design process.
AIMS allows data to be imported via a Microsoft Excel spreadsheet. By knowing the format of the import spreadsheet, it is possible to configure the DES portal to export desired data into an AIMS compatible spreadsheet format. This would reduce the duplication of data entry.
VIShub
VIShub is a platform which enables HS2 to bring both data, design models and visualisations together in one interface categorised by DES. As the database is linked to the DES ID, it can provide a single location to source data to populate Vishub. In addition, the DES report and by association the DES portal data records all documents and drawings associated with a DES, meaning the portal can readily provide signposting for data.
BIM
As outlined in the system benefit section of this document, the automation process has the functionality to interface with BIM models and GIS. This functionality can be developed over time to extract an increased amount of data from the models, which can be manipulated for different uses.
Export formats
The portal platform is configured so that the data can be exported in different document formats based on known template requirements. This gives the system flexibility for data to be shared and imported with other systems and organisations working on the project.
Other reporting
There is the capability to reuse the data for other HS2 deliverables. It was identified that a lot of the information collated for the DES reports was reported in other deliverables. Instead of filling out both deliverables with the same information there is the opportunity to only submit the data once to the portal and then configure it to write this information into different templates deliverables. An example of this is the Highways Design Reports, which required similar design history and dimensions data to the DES report.
Portal as a Central Data Hub for other deliverables
The development of the portal highlights the opportunity to create a central data hub to act as a single source of truth for all data on a project. The central data hub could be used for deliverables on HS2 and be available for interfacing design partners. Currently the project requires the delivery of project information in many registers including CDM, Assumptions and Departures. This type of data is well suited to database storage. Currently this data is mandated to be delivered in an Excel template, which is not good at handling large text data sets with formatting easily broken. The use of a database would allow more efficient population, checking and reporting. This data could be outputted in many different formats, including the mandated Excel formats.
Conclusion
The development of the report automation process for use on the HS2 Phase 2a and Phase 2b projects has brought significant benefits to both phases of the HS2 Project. The portal has benefited HS2, its Consultants and future Consultants who will inherit the information database. The portal system, developed to address the problem of how to efficiently deliver the large quantity of DES statements, has demonstrated its ability to deliver statements in a far more cost and time efficient manner compared to a traditional report production process. The process achieves this by importing existing data from various sources, reducing the quantity of manual entries, automating repetitive tasks and streamlining the assurance process. The increased automation has led to the development of an accurate database which contains a full audit history and links to source data.
In addition to the benefits in delivering DES reports, the platform can deliver wider benefits through the capability to repurpose data for other deliverables and integrate with existing HS2 and BIM systems. This paper outlines the opportunities for future developments which would further reduce manual inputs and integrate systems, including opportunities to link to AIMs. The tool should be a template for how the project can handle large data sets for future phases of the project, reducing the reliance on the storage of data in multiple document formats.
Peer review
- Joshua GriptonAsset Information System Manager, HS2 Ltd