Colne Valley Viaduct foundation design
The proposed 3.4km long Colne Valley Viaduct provides an excellent opportunity to review and optimise design methodologies for large diameter bored piles within Chalk. Whilst piles have been successfully designed and constructed in chalk for many decades, the HS2 Colne Valley Viaduct will be required to support the highest speeds and dynamic forces of any UK railway viaduct, in addition to maintaining the tightest of serviceability deflections and dynamic response. This paper illustrates how the project team have developed a co- ordinated design and construction approach to deliver value and certainty of performance for this major structure.
Current UK practice for design of piles in Chalk follows the guidance given in CIRIA C574 Engineering in Chalk. Whilst this gives guidance on determining ultimate shaft friction and end bearing resistance, it also suggests increased factors of safety on end bearing to allow for potential solution features within the chalk. This can lead to an overly conservative design. This paper describes the development of the methodology for the design of the piled foundations and to address the requirements of BS EN1997. The viaduct is supported on 56 piers and 2 abutments, each comprising groups of 4 – 6 piles, 1.5m and 1.8m in diameter. The piles are between 32m and 55m long and are founded in the underlying Seaford and Lewes Chalk (Upper Chalk). This paper sets out the assumptions made at early scheme design, the ground models used and preliminary pile load test results using bi- directional Osterberg cells. Additionally, this paper summarises how the results of the pile testing were incorporated to optimise and verify the detailed design of the piles.
- Written by
-
Sam Reynolds (Rendel Ltd/AlignJV)

-
Jun Wang (Jacobs UK Ltd/AlignJV)

-
Peter Gilbert (Align/Jacobs Engineering Ltd)

- Resource type
- Resource type: Technical Paper
- Intended audience
- Consultants
- Tags
- Piling, Bridges, Foundations, Ground Modelling., Geotechnical posts
Introduction
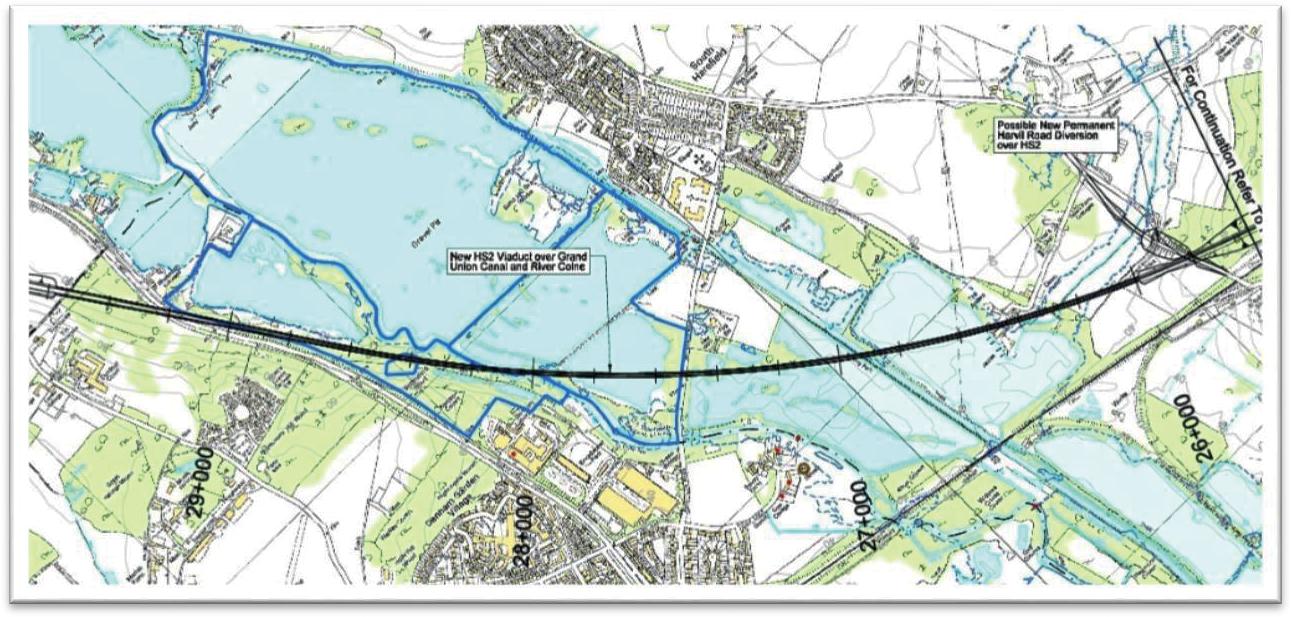
The Colne Valley Viaduct (CVV) is part of the central section of the High Speed 2 (HS2) Phase One – Lot C1 Main Works Civils Contract being delivered by Align JV. The 3.4km long viaduct is a multi-span structure carrying the HS2 over the water features of the Colne Valley Regional Park and the Grand Union Canal in Hillingdon, west London. The viaduct is made up of spans up to 80m long, supported on 56 piers and 2 abutments, each comprising groups of 4 – 6 rotary bored piles. The piles are 1.5m and 1.8m diameter and are between 32m and 55m long, founded in the underlying Seaford and Lewes Chalk, part of the Upper Chalk formation.
This paper discusses the development of the viaduct foundations, through initial optioneering, scheme design, preliminary pile testing and finally the detailed design.
As well as the constraints of constructing piles over and near various water bodies, the piles were also located within the zone of influence of two groundwater abstraction points, which fall within a groundwater Source Protection Zone 1. Therefore, throughout the design process, it was important to consider the risk to the underlying aquifer from pile construction, as well as the risk posed to the piles from long term groundwater abstraction.
At the initial scheme design stage, the piles were designed based on the guidance given in CIRIA Report, C574 Engineering in Chalk[1]. As part of the subsequent design development process, a series of preliminary pile load tests were carried out. The results of these tests, as discussed below, provided the opportunity to review the foundation design methodology, enabling the detailed design of the piles to be optimised. Additionally, the preliminary pile testing was an opportunity to monitor the effect of piling on the underlying chalk aquifer, specifically on water turbidity, as well as compare the construction and design benefits of different support fluids.
Design criteria
For high-speed rail, it is often the in-service requirements of the track that govern the foundation design. The Serviceability Limit State (SLS) criteria, imposed by the structural design, was:
- 10mm of maximum differential settlement between piers;
- 30mm maximum lateral deflection at deck level in the fixed buttresses;
- 5mm maximum lateral deflection at deck level at Pier P2.
In addition, the HS2 Technical Standard – General Track Specification (HS2-HS2-RT-STD- 000-000004)[2] required:
- Maximum long term deformation of the bridge deck, after track installation, limited to:
- 10mm, where the span is less than 50m
- Span/5000 or 20mm where the span is greater than 50m.
- Settlement of abutments or piers, based on dead load effects:
- 20mm total settlement
- 5mm differential settlement of adjacent abutments or piers
Foundation options considered
An initial value engineering exercise was carried out at Scheme Design to determine the optimum foundation approach for the viaduct. The results are summarised in Table 1.
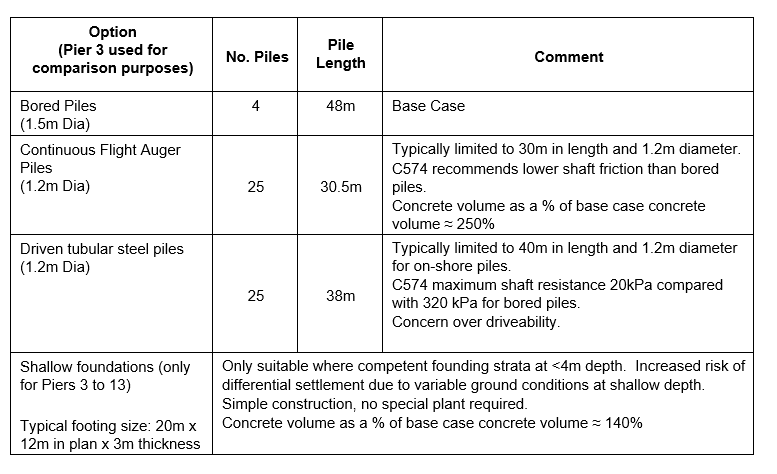
Rotary bored piles were the chosen foundation solution, after the optioneering study ruled out shallow foundations and other pile types. Rotary bored piles were the only solution considered suitable to support the significant structural loading, given the serviceability criteria and the limited space available for the foundation footprints.
Ground Investigation and Ground Models
Desk study indicated that the geology of the Colne valley consisted of cohesive and granular Alluvial Deposits overlying the White Chalk. Many of the alluvial deposits were economically viable aggregates, which have been extracted, leaving a landscape of shallow lakes along much of the valley. The valley itself was the prehistoric alignment of the River Thames, which used to flow to the north of what is now London.
The Ground Investigation (GI) works generally consisted of cable percussion boring through the superficial deposits and into the top of the chalk, at which point progress would be continued using rotary coring techniques. At critical locations, in-situ stiffness measurements of the chalk, usually in the form of pressure meter testing, was undertaken.
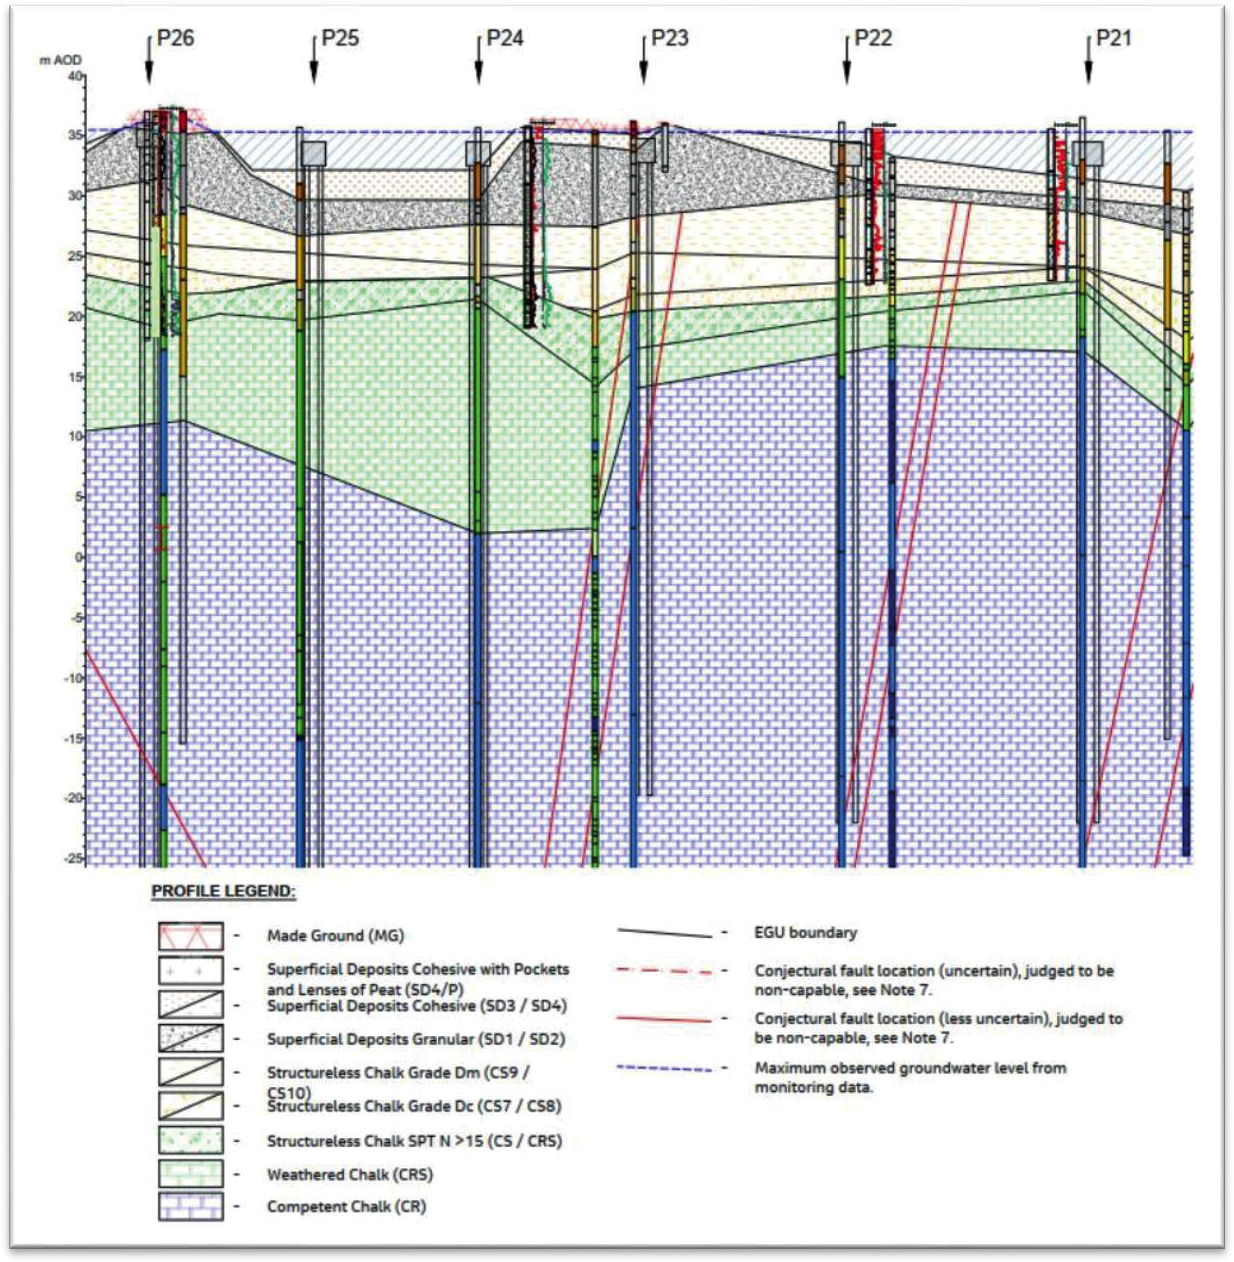
Logging of the Chalk was in accordance with C574; this methodology results in 62 possible classifications of the chalk. This was assessed to be too complicated for the design methodologies, and consequently these logging divisions were grouped, to enable data
management and the derivation of design parameters. As a result, the chalk was grouped into 10 Engineering Geology Units to enable the design, which could be further grouped into:
- Structureless Chalk
- Weathered Chalk (Structured)
- Competent Chalk (Structured)
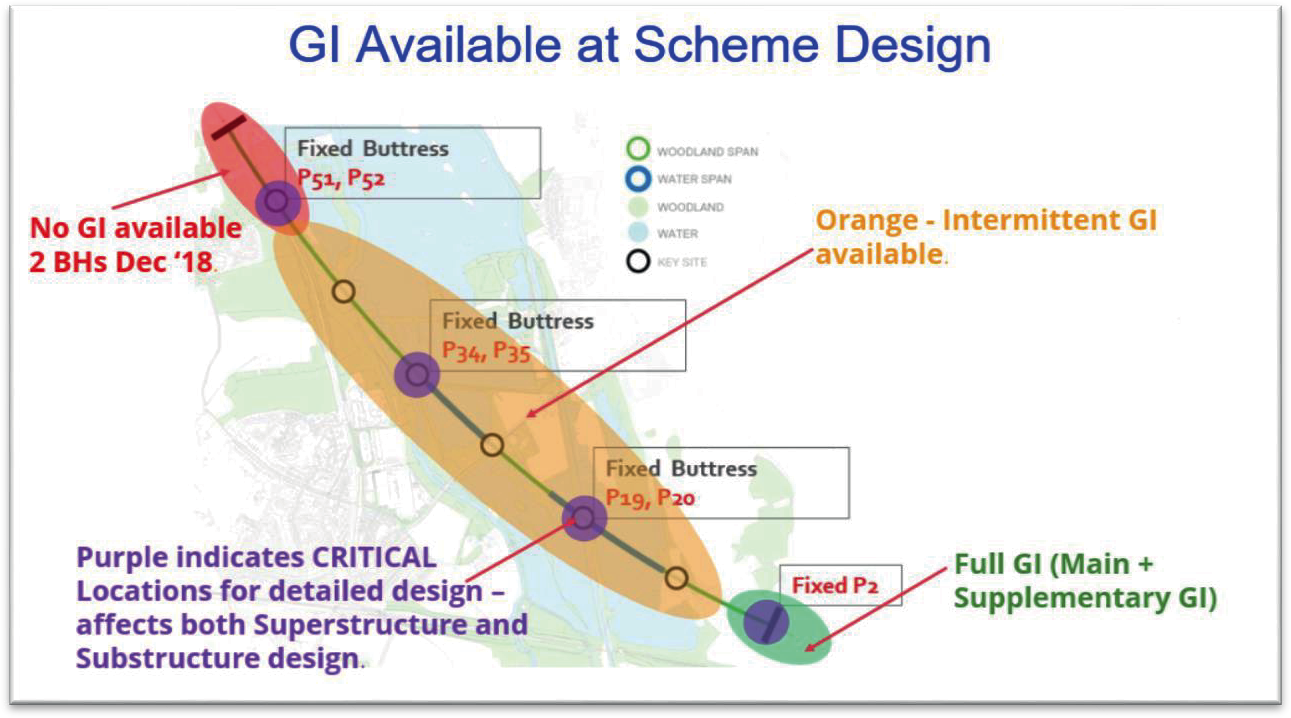
The GI works along the line of the viaduct were undertaken between 2017 and 2021. The initial works (Main GI) was undertaken by HS2 Ltd, and whilst they covered the extent of the viaduct, access was limited, and the boreholes could not be targeted to pier foundations as these locations had not yet been decided.
Interpretation of the Main GI data revealed that the chalk below the valley was subject to deep weathering and degradation, probably due to faulting – which was identified across the full width of the valley – and chemical erosion, exacerbated by the presence of a number of groundwater abstraction sites from this Principal Aquifer.
The basic arrangement of the viaduct – splitting it into four modules, divided by expansion joints – was established during the Scheme Design stage, which allowed the locations of the abutments and 56 intervening piers to be confirmed. Preliminary pile design allowed pile lengths to be estimated, which was used to define the depth of Supplementary GI. Initially, it was proposed that two boreholes would be undertaken at each pier, although this was later reduced so that this number was only undertaken at the ‘critical’ fixed buttresses, with a single borehole acceptable at the more standard vertical piers.
A detailed ground model was developed for the viaduct, which was updated at key stages as the GI progressed, to provide a full understanding at each pier of the soil and rock types, weathering profile and condition of the chalk and location of geological faults (see Figure 2).
Scheme Design
The initial sizing of the bored pile foundations occurred during the Scheme Design phase in 2018. As the GI was undertaken over several years, most piers at Scheme Design had to be designed without ‘pier specific’ GI. In these cases, a preliminary ground model was created based upon the data available from GIs at adjacent piers, off-line GI points, along with geological knowledge and experience. Consequently, the pile design at Scheme Design included a degree of caution to allow for the uncertainties of the ground conditions at that early stage.
Although most of the axial capacity of the piles came from the Chalk, some resistance is provided by the overlying superficial deposits. Pile shaft resistance in coarse-grained materials was calculated using the effective stress method (Equation 1).
(1)
Where
Ks was taken as = 0.7 (ICE Manual of Geotechnical Engineering[5])
σ’v was the effective vertical overburden pressure and
δ was the angle of interface friction on the pile, taken as the soil friction angle,ϕ’ (and 0.7 ϕ’ for permanent casing).
In fine-grained soils, the pile shaft resistance was calculated using the total stress method (Equation 2), with a check also carried out using the effective stress method (Equation 1).
(2)
Where,
α was taken as 0.5
Cuwas the average undrained shear strength.
In both fine and coarse-grained soils, the limiting average unit shaft resistance was taken as 110 kPa (ICE Manual of Geotechnical Engineering[5]).
Within the Chalk, the axial capacity of the piles was calculated based on the guidance given in C574 for piles in chalk.
For structured chalk, C574 suggests the expression in Equation 3 to calculate shaft resistance:
(3)
Where,
τsf is unit shaft resistance (limited to 320 kPa),
σ’v is vertical effective stress,
β is a constant that has been confirmed by pile load testing (= kstan δ )
C574 suggests β = 0.80 for competent chalk (with a reduced β = 0.63 for weathered chalk
based on traditional effective stress design).
End bearing was taken to be 200 x Standard Penetration Test (SPT) N value, in accordance with C574 guidelines, with a maximum value of 5 MPa.
Upon finalising the CVV Scheme Design, the bored pile lengths ranged from 39m at Pier 2 to 66.5m at Pier 40. These lengths were based on a typical diameter of 1.5m, with 1.8m diameter piles at the fixed buttresses, where the lateral loading governed.
Preliminary Pile Tests
Following Scheme Design, eight test piles, 1.5m diameter, were carried out at either end of the proposed CVV alignment (four at ‘Location 1’ in the north and four at ‘Location 2’ in the south). The locations were chosen to test a range of chalk weathering conditions, allowing for the constraints of land access. The test piles were constructed to depths of 45m and 60m based on typical lower and upper bound pile lengths calculated at scheme design. They were constructed under both bentonite support fluid (four) and polymer support fluid (four), with the intention that the chosen support fluid for the main works would be based on the outcome of the preliminary test piles. This would include consideration of the performance of the piles in terms of capacity, the results of groundwater monitoring during pile testing and the logistics of using each support fluid for the construction team.
On one of the 60m bentonite test piles (LTP4), concrete placement was delayed by 51 hours to allow a build-up of bentonite filter cake (considered to be a worst-case scenario for the design of the Chiltern tunnel shaft diaphragm walls).
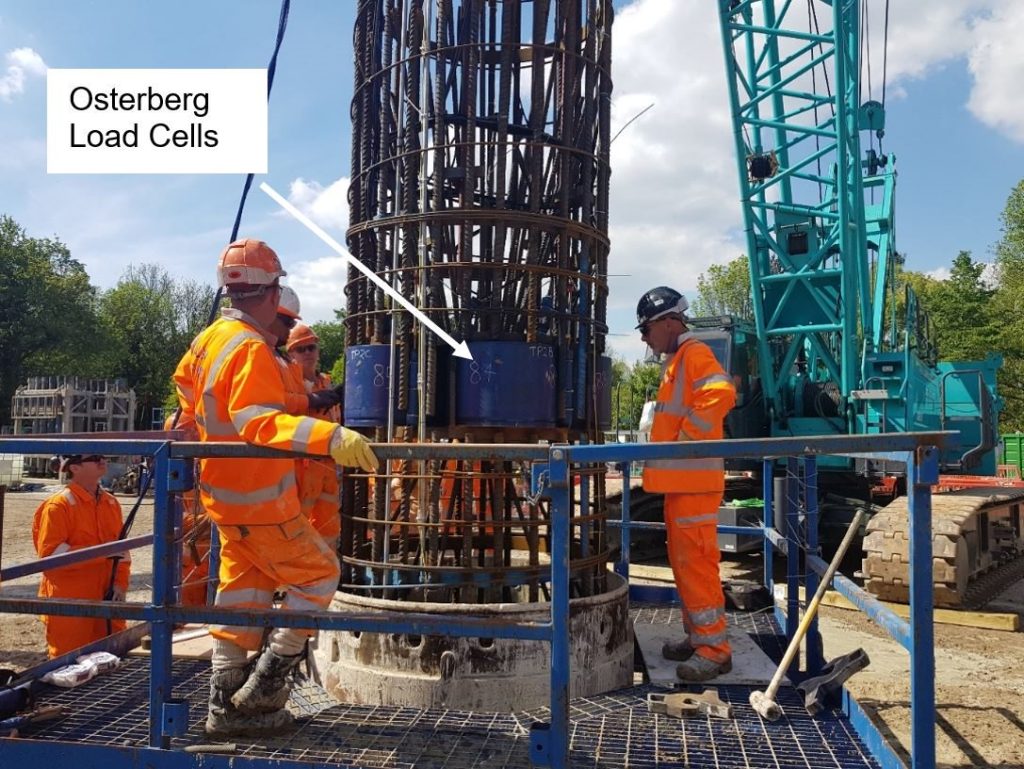
Osterberg load Cells (O-Cells) were cast into the piles to apply the bi-directional load to the test piles (Figure 4) and vibrating wire strain gauges were positioned at various levels in the pile, to allow calculation of the load distribution along the pile shaft. The load was incrementally applied to the test piles until the estimated ultimate load of the pile was reached. Each increment of load was held until the rate of O-Cell expansion was less than 0.25mm/hour, with a maximum three-hour hold period. Upon reaching the maximum specified test load, the test was continued by increasing the load further in small increments to effectively ‘fail’ the pile. All load tests were terminated upon the O-Cells approaching maximum expansion (approximately 225mm) or the O-Cells being unable to sustain the required pressure.
The pile testing regime was designed to “fail” the piles geotechnically, which was assumed as the total pile movement exceeding 10% of the pile diameter (150mm), in accordance with industry guidance. The required test loads were calculated based on the estimated ultimate capacity of the test piles using the scheme design methodology presented in the previous section.
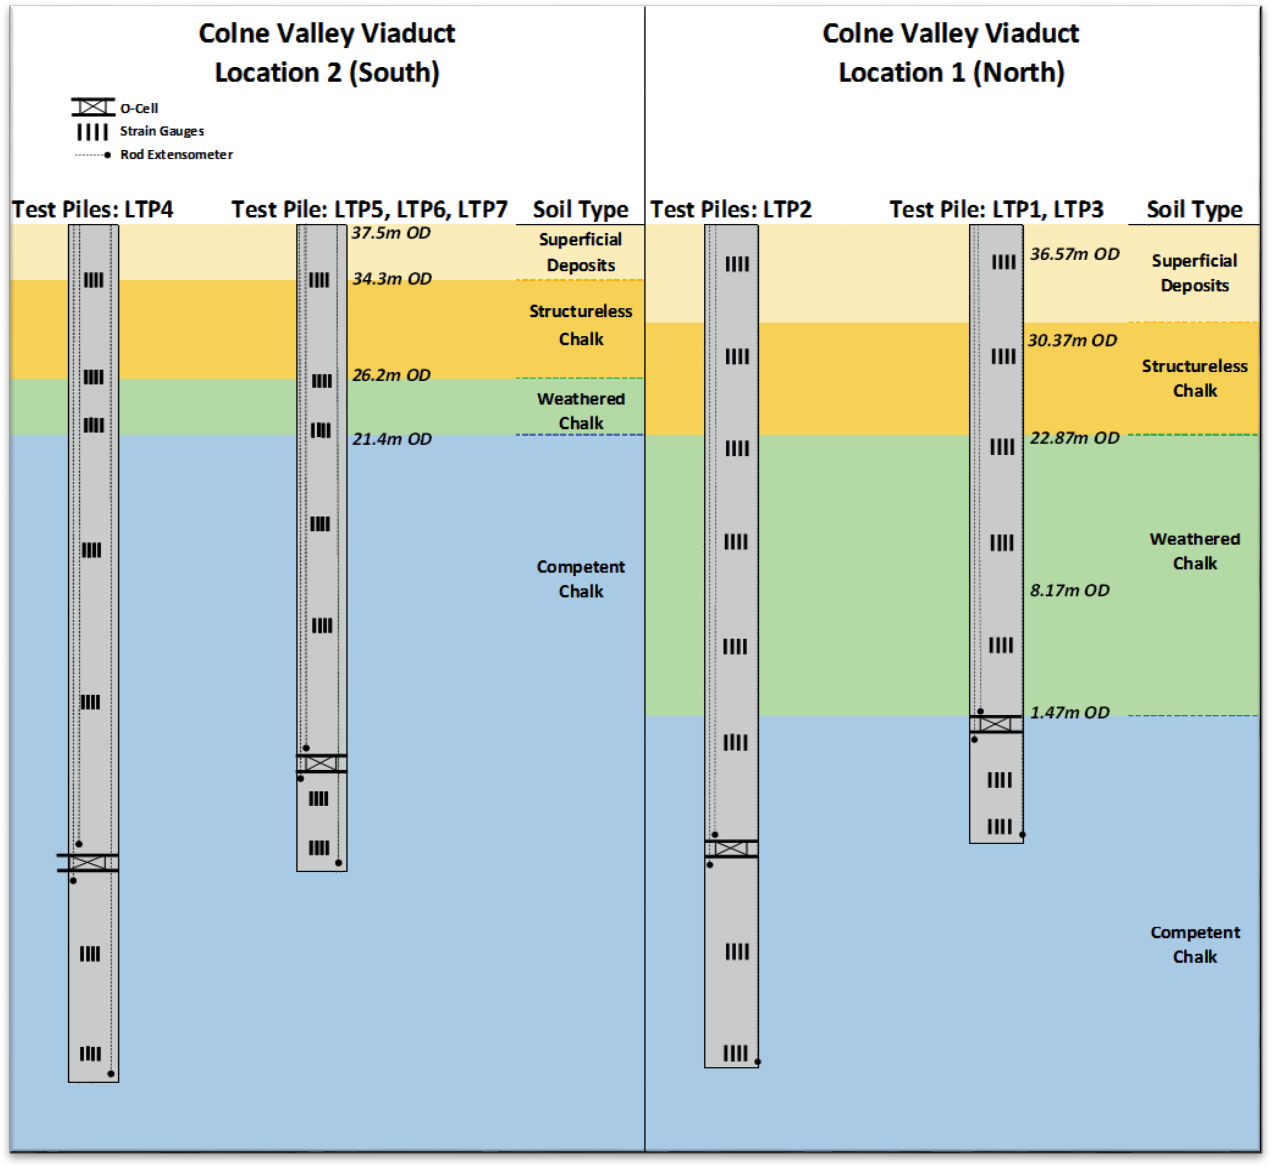
A rough schematic of the test piles and the outline ground models adopted for the pile test locations are presented as Figure 5 and comprise superficial deposits overlying structureless chalk, weathered chalk and structured chalk of the Seaford Chalk Formation.
Bentonite Test Piles
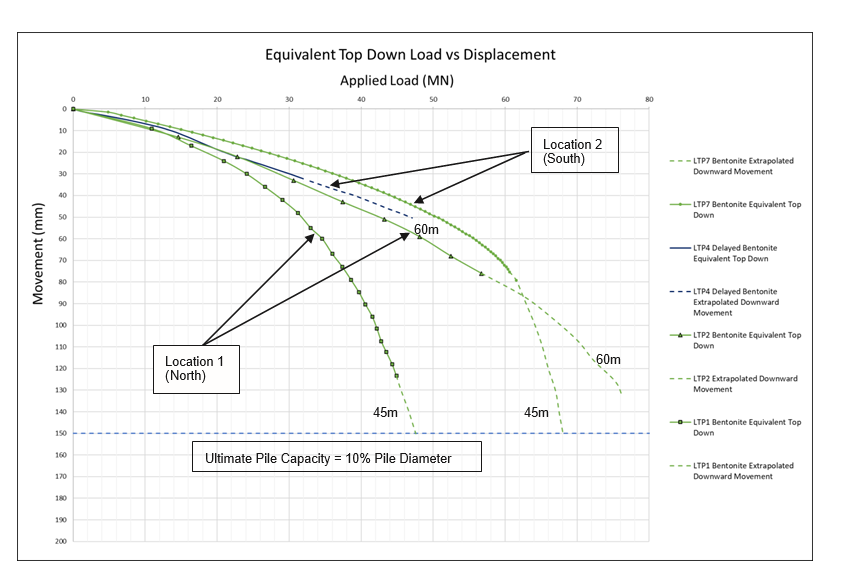
After careful processing of the load test data, and identification of unreliable strain gauges, the equivalent top-down load versus displacement curves for each test were developed by adding together the upward and downward O-Cell load for equal magnitudes of movement. These can then be used to make an assessment of the ultimate capacity of the test pile. The curves for piles constructed under bentonite support fluid are shown in Figure 6.
The two 60m long piles (LTP4 and LTP2) performed very similarly despite the slightly poorer ground conditions at Location 1. The delay in concreting LTP4 was therefore considered to cause a reduction in pile capacity similar to constructing the pile in ground conditions with a 20m deeper weathering profile in the chalk.
The 45m pile at Location 2 (LTP7) showed approximately 20MN greater ultimate capacity than the 45m pile at Location 1 (LTP1). This was considered to be a result of the more competent chalk at shallower depths at Location 2, thereby giving increased skin friction.
Based on the results of the test piles, the limits on shaft friction adopted for piles constructed using bentonite support fluid in chalk are presented below. These are lower than recommended in C574 and are possibly a result of lower chalk quality in this area due to groundwater abstraction.
- 180 kPa from 0 to 45m depth
- 240 kPa below 45m depth
- A beta (β) value of 0.63 for weathered chalk (CRS) and 0.8 for competent chalk (CR) in line with the initial design.
The limit on base resistance for competent chalk (CR) was indicated to be 10 MPa (i.e. double that used at Scheme Design).
Polymer Test Piles
Four test piles were carried out using an acrylamide based polymer support fluid. The equivalent top-down load vs displacement curves for the polymer test piles are shown in Figure 7.
The four polymer test piles displayed a similar behaviour. In each case, the capacity of the load cell was exceeded prior to the geotechnical failure criterion occurring. It was therefore not possible to determine the ultimate capacity of the piles. Up to 30 MN loading, however, the pile behaviour between the four piles was almost indistinguishable.
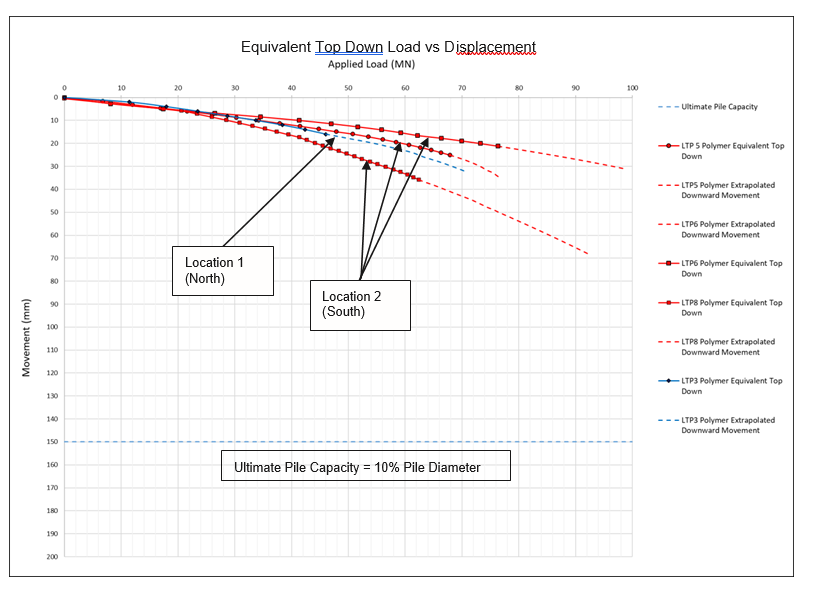
Based on the results of the polymer tests, the ultimate skin friction within the chalk was in excess of 500 kPa, equivalent to a beta (β) value well in excess of 1.0 and significantly greater than the maximum value of 320 kPa suggested in C574.
A beta (β) value in excess of 1.0 indicates that the friction on the side of the pile exceeds the effective stress at the pile/soil interface. This may imply that the polymer had somehow provided additional adhesion along the shaft, although this could not be confirmed. The durability of this added adhesion over the design life of the piles, was unknown and was considered an unnecessary risk to the project.
For design, therefore, reduced limits on shaft friction in chalk were considered appropriate for piles constructed using polymer support fluid, albeit that it still represented an overall increase in shaft friction from the C574 values:
- 320 kPa from 0 to 45m bgl
- 400 kPa below 45m bgl
- A beta (β) value of 0.63 for weathered chalk (CRS) and 1.0 for competent chalk (CR).
The limit on base resistance for the polymer piles was taken as 10 MPa (i.e. similar to the bentonite piles). This value was selected as a conservative lower bound in the absence of being able to fully mobilise the test piles and more accurately determining the base resistance.
During the design however, the proposed acrylamide based polymer used in the trial piles was not approved for general use by the Environment Agency, as there was concern over the use of acrylamide in such close proximity to groundwater abstraction points. The need for additional trials and testing of alternative polymers was not feasible under the construction programme, therefore, it was decided that polymer support fluid would not be used and all production piles would be constructed using bentonite.
Settlement at Working Load
The results of the preliminary pile tests were used to assess the likely settlement which would occur at pile working (SLS) loads. Pier 55 was used for comparison purposes as it is located near to the northern test pile site. The smaller (green) box shown on Figure 8 represents the load and predicted settlement when the pile cap, viaduct pier and cantilevered section of deck have been constructed, but prior to locking off the deck sections. The settlement that occurs up to this point will not affect the final structure. The larger (yellow) box shown on Figure 8 represents the load and predicted settlement at the pile working load. The difference in settlement between the two is the predicted total settlement that will occur at the head of the pile after locking off the deck (i.e. the point at which foundation settlements can no longer be adjusted for at bearing level), albeit ignoring any group effects.
Applied Load (MN)
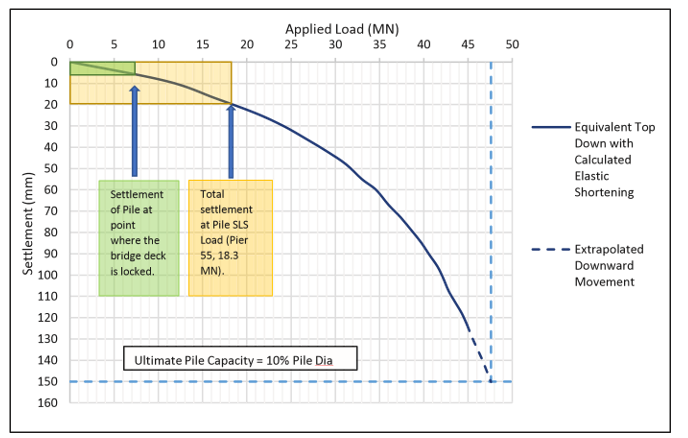
The pile test results indicated that at the working load for Pier 55, the pile resistance was almost entirely provided by the shaft, with settlement of the order of 10mm – 15mm. This verified that for piles constructed using bentonite support fluid, the pile lengths calculated at scheme design would likely satisfy the SLS requirements of the structure, with potential for further optimisation of pile length within the detailed design phase.
Effect of piling using bentonite on groundwater quality
As part of the preliminary pile testing, four bespoke monitoring boreholes were drilled in the test location to assess the effects on groundwater quality parameters measured at the well head, including pH, electrical conductivity, turbidity and a range of organic and inorganic parameters assessed in the laboratory. Full details are given in, MWCC C1 – The effect of piling using bentonite as a support fluid on groundwater quality in the Chalk of South Eastern England[9].
The assessment confirmed that even in fractured chalk, turbidity generation by piling is limited and no significant bentonite migration occurs, and when voids are encountered in the Chalk, the loss of bentonite can be managed so that it does not have a significant effect on groundwater quality.
Detailed Design Development
The viaduct design strategy underwent significant development from the initial Scheme Design in 2018, mainly as a result of further information being available on ground conditions and the results of the preliminary pile load tests.
Table 2 identifies the main design development between the initial Scheme Design and Detailed Design.
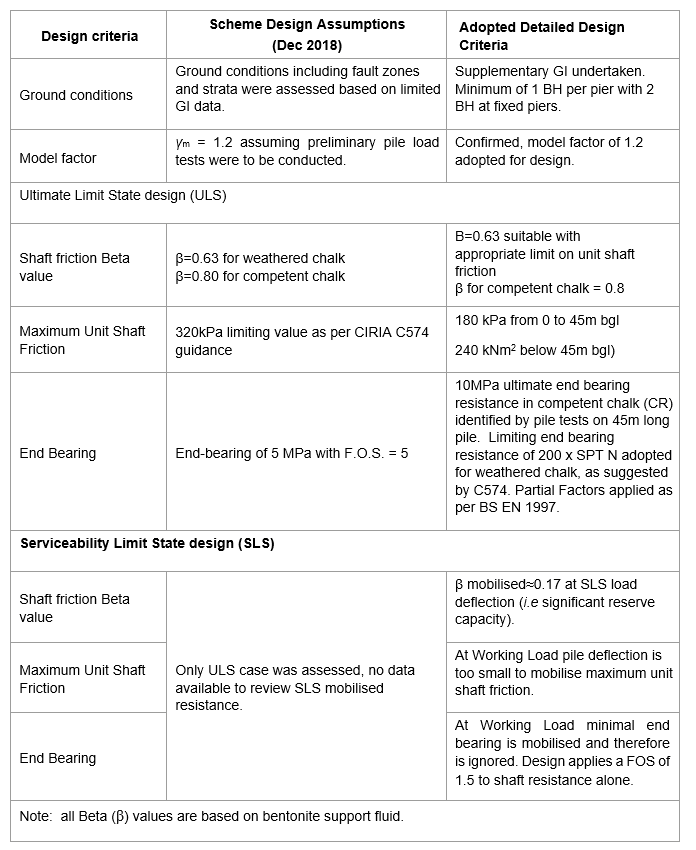
In terms of design, allowing for the full end bearing with the normal EC7 partial factors, in combination with the SLS check based on the shaft capacity alone, had the most impact on the final pile lengths.
Detailed Design Approach
BS EN 1997 (EC7)[3] was followed for the foundation design, with the design method for piling in chalk also based on the recommendations given in C574[1].
In order to undertake a robust design with regard to settlement and to allow for possible dissolution features to be present in the chalk, the design was based on achieving a minimum factor of safety of 1.5 on the shaft capacity alone under serviceability (SLS) loading. This is not a requirement of EC7[3], but was adopted to limit settlement and is in accordance with the advice provided in BS 8004:2015 ‘Code of Practice for Foundations’[4]. A minimum factor of safety of 1.2 is suggested (in BS 8004), in order to limit pile settlement to less than 1.5% of its diameter. By adopting a factor of safety of 1.5, settlements were expected to be less than 1% of the pile diameter (ICE Manual of Geotechnical Engineering[5]). This design approach was also confirmed by the pile test results.
The pile group analysis was carried out using REPUTE (Version 2.5), a 3D soil-structure interaction boundary element analysis software, developed by Geocentrix Ltd.
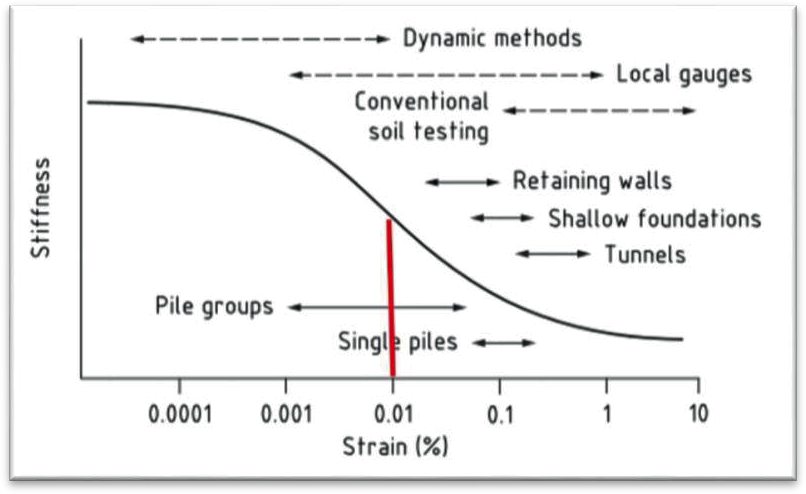
The drained Young’s Modulus used in design was taken at 0.01% strain level. (Figure 9).
To account for the increased strains which occur near the top of laterally loaded piles, the horizontal stiffness was taken as 50% of the vertical stiffness.
For piers subject to dynamic loading from braking, traction and accidental loading, the horizontal soil modulus was not reduced, to account for the short duration of the loading.
A long-term concrete Youngs Modulus equal to 17.5 GPa was adopted, with a corresponding short-term modulus of 35 GPa. The short-term modulus was adopted for the seismic and accidental/dynamic (braking and traction) load cases.
For the seismic analysis, upper and lower bound seismic case spring stiffness matrices were obtained from the REPUTE analysis and used in the structural model to determine the seismic loading on the piers. The relevant upper and lower bound spring stiffness values were taken as:
- Lower bound: based on soil modulus at 0.01% strain and long-term concrete stiffness values. Lateral soil modulus was taken as 50% of the vertical value.
- Upper bound: based on soil modulus at 0.01% strain with no reduction in lateral soil modulus and short-term concrete stiffness values.
The EC7 model factor was reduced from 1.4 to 1.2 following the preliminary pile testing. No working pile tests were carried out, therefore the EC7 resistance factors remained as 1.6 on the shaft and 2.0 on the base.
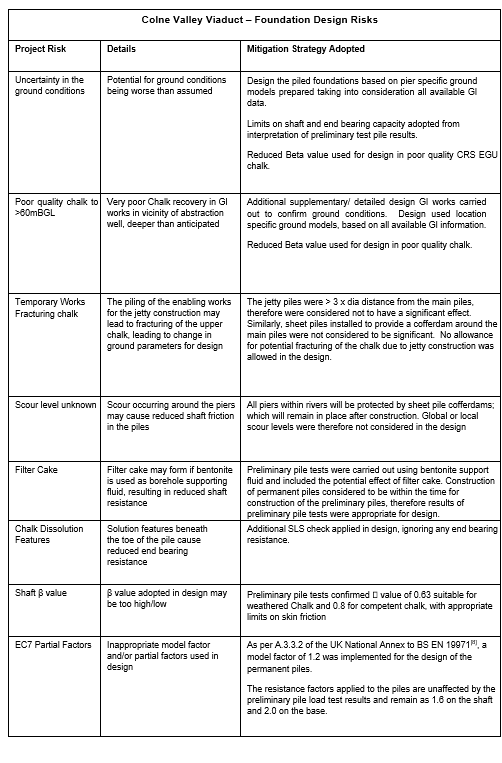
Design Risks
Various design risks, associated with the viaduct foundations, were identified during the design. These risks are indicated in Table 3, together with the mitigation strategy adopted in the design
Effect of Increased Faulting and/or Water Abstraction
Existing Conditions
As part of the ground model determination for each pier, the extent of existing fracturing, caused by faulting or previous groundwater abstraction, was assessed and ‘Zones of Increased Fracturing’ identified. These zones were primarily identified in the more competent (CR) chalk bedrock. For design, where these zones occurred, the chalk was downgraded to weathered (CRS) chalk and the respective skin friction and end bearing resistance reduced accordingly.
Future Deterioration
An assessment was carried out of the effect on pile capacity, caused by potential increased chemical weathering and fracturing of the chalk in the vicinity of the abstraction wells, due to ongoing water abstraction over the 120-year design life of the viaduct. It was considered important to try to make an assessment of potential future change, as this abstraction condition is unusual and not generally considered in pile design.
The assessment of potential future degradation is highly subjective, with no definitive answer; however, for the viaduct piles, a methodology was adopted which could be carried through to the design. In Summary:
- Records show that since installation, the lower parts of nearby groundwater abstraction boreholes had collapsed and it was interpreted that this was due to increased chemical weathering of the chalk as a result of increased flows due to pumping.
- Zones of potential future degradation were identified by looking at the core recovery obtained in each of the boreholes, comparing Total Core Recovery (TCR) against Solid Core Recovery (SCR) and Rock Quality Designation (RQD), as well as reviewing CCTV and results of geophysical surveys.
- The average skin friction values, identified from the northern Trial Piles, carried out approximately 230m west of an existing groundwater abstraction point, were considered appropriate for the current degree of fracturing within the Chalk.
- The potential for increased chemical weathering of the chalk was considered to reduce as the size of the fractures increase, as flow velocities will be less.
- Increases in weathering/fracturing ranging from about 10% – 40%, dependent on original fracture size, corresponded to a reduction in shaft capacity of about 5% over the zone affected, when considering the length of available ‘solid’ chalk in contact with the pile shaft providing resistance.
For design therefore, the pile shaft capacity was reduced to 95% in the zones identified as potentially being affected by future chemical weathering due to ongoing water abstraction.
Pier Loading
The following Ultimate Limt State (ULS) and Serviceability Limt State (SLS) load cases were considered:
- ULS – Set C (DA1 C2): used to assess pile capacity,
- ULS – Set B (DA1 C1): used to assess pile stresses for structural design of pile,
- SLS Characteristic: used to assess lateral and vertical pile deflections and a check on pile length under shaft capacity only (FOS > 1.5),
- SLS Quasi Permanent: used to assess crack width.
- ULS – Seismic Load Case
- ULS – Accidental Load Case
The dynamic effects of the structure were initially accounted for in the design loads by applying appropriate dynamic factors, as per BS EN 1991[6,7]. Subsequent detailed analysis of the dynamic response of the viaduct structure confirmed that the applied BS EN 1991 dynamic factors effectively covered the dynamic effects of the structure.
Passive earth pressure resistance was considered in the design of the north abutment foundations, given the geometrical arrangement of the abutment and the north approach embankment extending in front of the abutment. The passive earth pressures were only considered for the seismic and accidental load cases. For the service conditions (ULS and SLS), at rest pressures were adopted (see Figure 10).
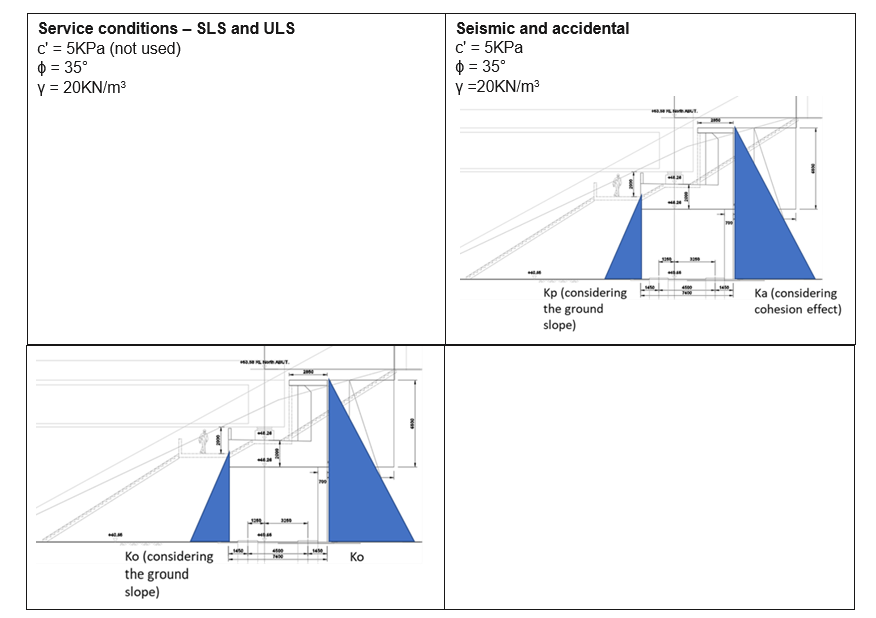
Passive earth pressures were not considered in the design of the pile foundations for the piers or south abutment.
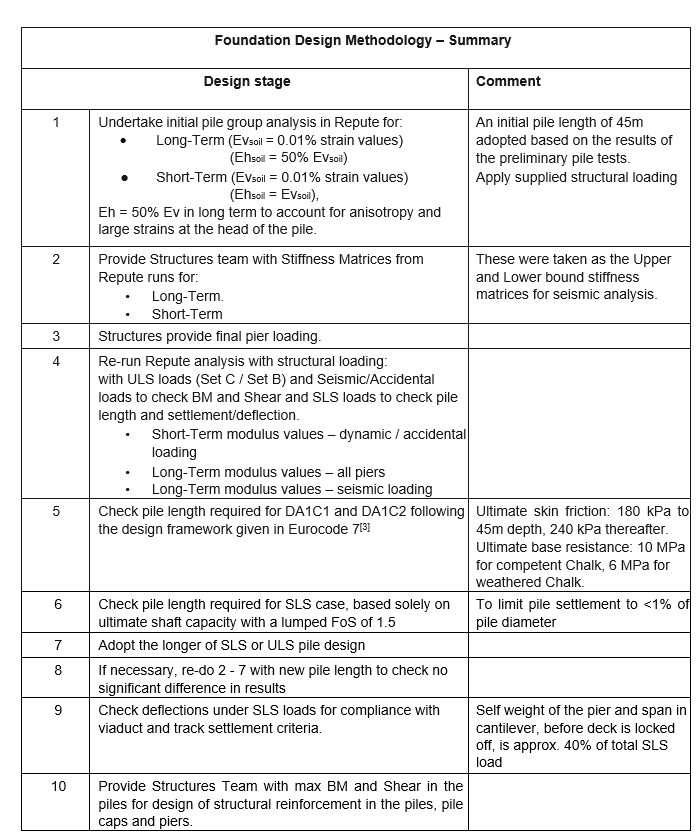
Detailed Design Methodology – Summary
An iterative design approach was carried out for the pile design, looking at the soil-structure interaction and requiring the super-structure and foundation design teams to work in close harmony. The foundation design methodology is summarised in Table 4.
Conclusions
The Scheme Design of the foundations for the Colne Valley Viaduct was carried out using the recommendations given in C574 for piles in Chalk[1]. The subsequent investment in GI, ground modelling and preliminary pile testing enabled the ground conditions to be well understood and the design to be optimised.
For piles constructed using bentonite support fluid, the beta () values suggested by C574 were found to be reasonable, however, the limiting skin friction values were significantly less than suggested. Conversely, piles constructed using polymer support fluid, indicated skin friction far greater than suggested in C574, as was the limiting skin friction. In both cases, bentonite and polymer, the end bearing resistance was significantly higher than suggested by C574, although this was only mobilised at high pile settlements.
Use of polymer support fluid was not possible, as the chemical constituent in the polymer (namely acrylamide) was not acceptable to the Environment Agency for use near a drinking water abstraction borehole.
The design included allowance for potential long-term degradation of the chalk bedrock caused by continued water abstraction from the chalk aquifer over design life of the viaduct.
Adopting the skin friction and end bearing resistances derived from the preliminary pile tests, in combination with the additional serviceability check to limit settlements, resulted in a reduction of about 24% in the average pile length from Scheme to Detailed Design, with associated savings in both material costs and programme.
This project has provided some useful data on what governs the overall pile design in chalk, which, as expected, is the settlement of the pile under working loads (SLS load case), rather than the very high ultimate pile capacities.
At the time of going to press, approximately 40% of the piles have been installed. Construction is progressing well and to programme and the design has proved buildable and representative of the actual ground conditions encountered.
Acknowledgments
Main Works Civil Contractor – Contract C1: Align JV
References
- Lord, J.A, Clayton, C.R.I, Mortimore, R.N, (2002). Engineering in Chalk. Ciria C574.
- HS2 Technical Standard – General Track Specification (2019). HS2-HS2-RT-STD- 000-000004.
- BS EN 1997-1:2004+A1:2013. Eurocode 7: Geotechnical Design – Part 1: General Rules. British Standards Institute.
- BS 8004:2015 Code of Practice for Foundations. British Standards Institute.
- ICE Manual of Geotechnical Engineering (2013) Vols 1 and 2. Institution of Civil Engineers.
- BS EN 1991-2:2003. Eurocode 1:Actions on Structures. Part 2: Traffic loads on bridges. British Standards Institute.
- NA to BS EN 1991-2:2003. UK National Annex to Eurocode 1:Actions on Structures. Part 2: Traffic loads on bridges. British Standards Institute.
- NA to BS EN 1997-1:2004+A1:2013. UK National Annex to Eurocode 7: Geotechnical Design – Part 1: General Rules. British Standards Institute.
- Hobbs, S. MWCC C1 – The effect of piling using bentonite as a support fluid on groundwater quality in the Chalk of South Eastern England. HS2 Learning Legacy paper, 2021
Peer review
- Adrian St JohnEKFB
- Chrysanthi TrygousiHS2 Ltd