Comparison of predicted versus actual ground settlement during tunnelling
The “Traction Substation package” for HS2 comprises the construction works for the relocation of an existing London Underground Ltd substation on the corner of Drummond Street and Melton Street. The works involved two sprayed concrete lining tunnels, excavated from a construction access shaft, that tie into the existing LUL infrastructure and connect to a piled box which will houses the new substation.
The construction of these new structures was carried out in a tight area in the centre of London, surrounded by quite sensitive assets. A Ground Movement Assessment for the area was undertaken and impact assessments for each of the assets was carried out in order to detect potential failures and identify the required mitigations measures to reduce the impact on the asset to an accepted level. Instrumentation and Monitoring supplemented the above with two main goals: on the one hand, asset protection or risk management, to trigger pre- planned contingency actions; and on the other hand, design verification, confirming if assumptions were correct and feeding back into the design for next stages.
This paper focusses on the main tunnel, known as the “combined ventilation and cable tunnel Part 1”. And it describes the comparison between ground movement prediction and actual monitoring data for ground surface settlement induced by the construction of this tunnel. Furthermore, the paper aims to correlate the above to volume loss and open the possibility for further analysis.
Introduction
This paper is presented as part of the works to deliver the Euston station construction project which is part of the High Speed Two (HS2) Phase one works, being delivered by the Euston Integrated Project Team (IPT) including Mace Dragados joint venture (MDJV).
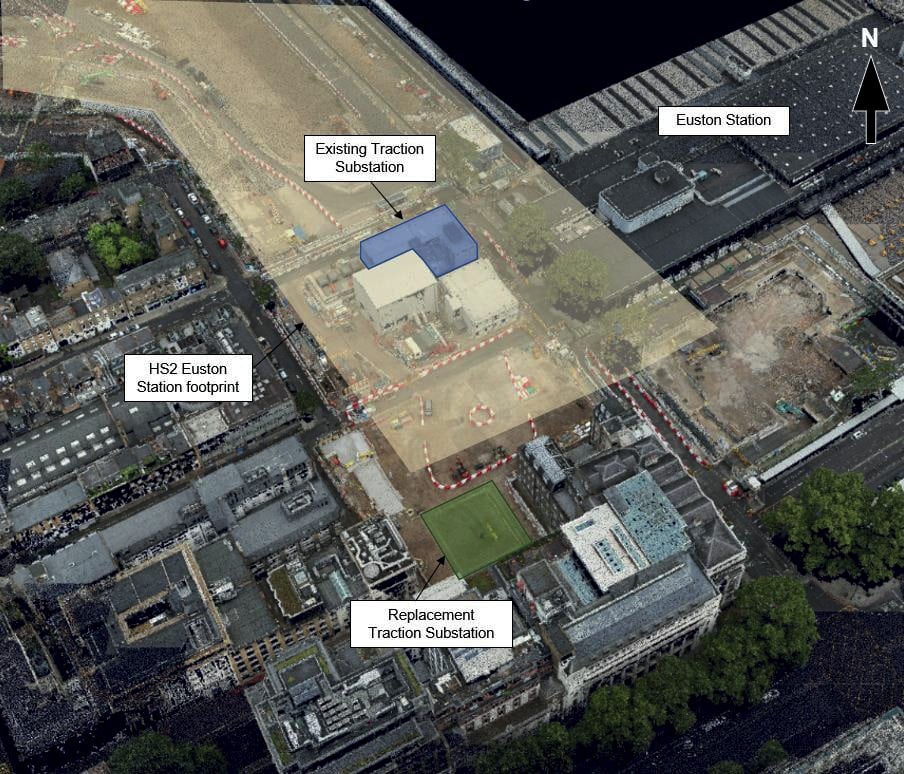
The existing Euston London Underground Limited (LUL) Northern Line traction substation and vent shaft – known as “Melton Street Substation” – is located at the corner of Drummond and Melton Streets in London.
In order to facilitate the construction of the HS2 Euston Station, the existing substation is required to be relocated. The chosen location for this relocation is Wolfson House, 4 Stephenson Way, London (see Figure 1).
The structures occupying the site were demolished by HS2’s Early Works Contractor. The proposed new structure is a concrete framed building over 3 levels of basement comprising: plant space, cable routing and pressure relief vents for the underground tunnels.
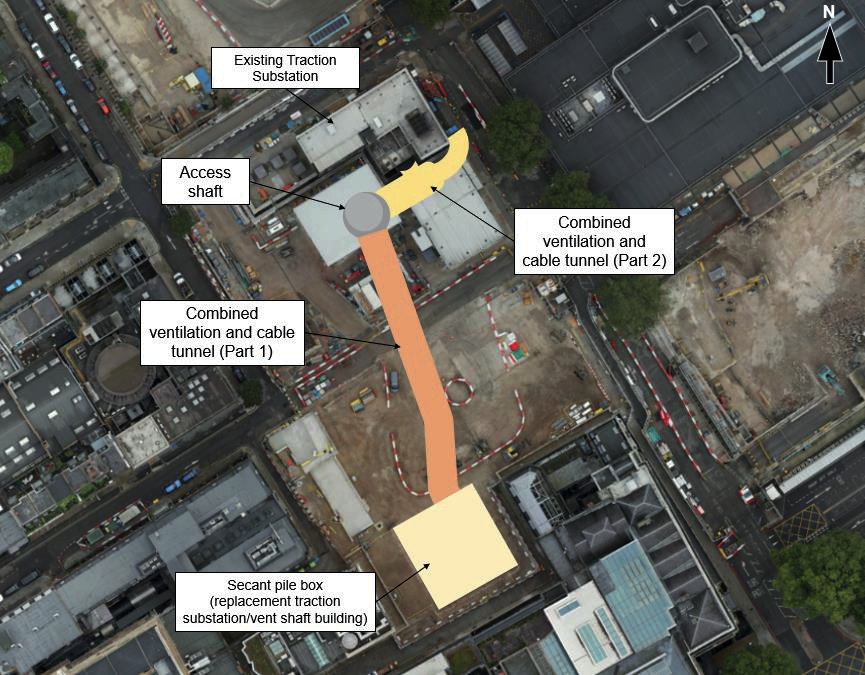
The Traction Substation (TSS) work package includes the construction of the replacement traction substation, vent shaft building and supporting infrastructure. It includes a construction access shaft; a connection tunnel between the access shaft and the new buildings; and a connection tunnel between the access shaft and the existing LUL assets as shown in Figure 2. The tunnels and adits will connect the existing London Underground assets (Drummond Street Substation Tunnels) into a new piled box structure.
The combined ventilation and cable tunnel part 1, with 6.5m internal diameter and 66m long, is the main tunnel of this package, connecting the access shaft and the replacement traction substation.
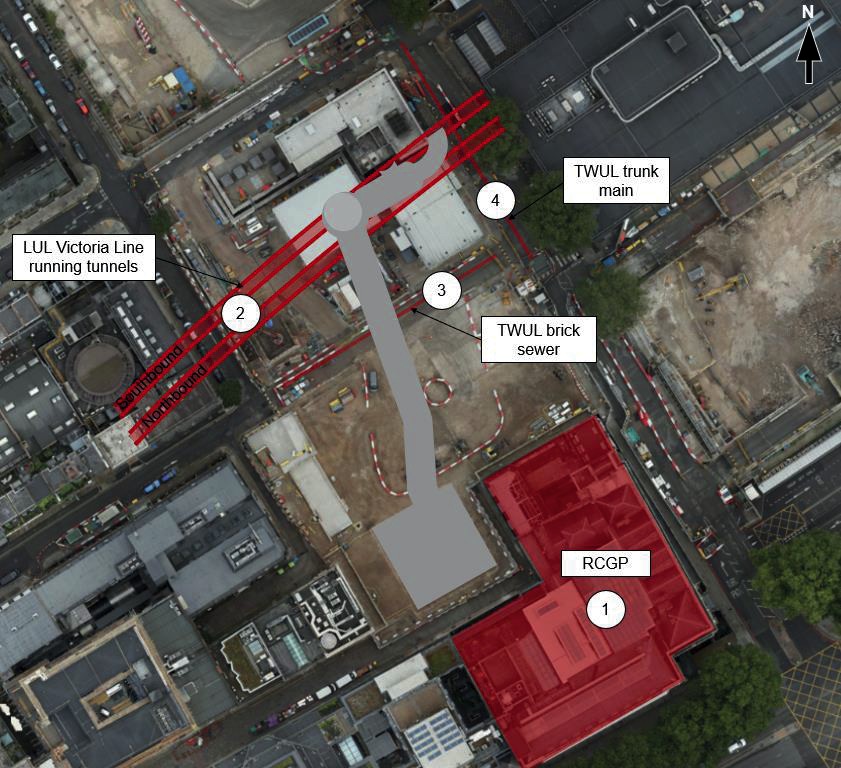
The area surrounding the works is highly congested with multiple existing assets of a different nature, such as utilities assets, third party buildings, Network Rail Euston Station and Transport for London assets, among others. The location of the more critical assets is shown in Figure 3 and a brief description as follows:
- The Royal College of General Practitioners is a six‐storey Grade II* Listed building located at the corner of Euston Road and Melton Street. The building, as it stands today, was constructed in multiple phases, between 1906 and 1932. The entire building underwent an invasive renovation and refurbishment process in 2010‐12 and currently serves as the South London faculty centre for the Royal College of General Practitioners. The building is founded on shallow foundations.
- The LUL Victoria Line running tunnels comprise deep level underground tunnels at the same level as the Northern line Bank branch at Euston Station. These tunnels opened in 1968 formed from cast iron rings with an internal diameter of 12 feet 2 inches (3.7m). Approximate crown levels of the running tunnels vary between -7.53 mOD (41.5m below Melton Street ground level) to the west of Euston Station and -4.22mOD (26.2m below ground level) to the east of Euston Station.
- A Thames Water Utilities Ltd (TWUL) brick sewer running along Euston Street. It was built in the 60’s and it is 70.94m long, 1168x787mm egg-shaped sewer located at an average depth of 5.5 mbgl (metres below ground level).
- A TWUL 42″ cast iron water main running along Melton St, one of the largest in London. It is understood that this water main burst in 1987 causing significant disruption to the surrounding area.
The settlement induced by the tunnelling works have formed the main focus of this paper, concentrating on the Combined Ventilation and Cable Tunnel Part 1 (see Figure 2). The actual movement, captured through an instrumentation and monitoring (I&M) scheme within the zone of influence of the works, have provided an opportunity to compare actual data against the prediction from the Ground Movement Assessment (GMA). This will help to have a better understanding about the ground behaviour in the area and potentially be used to refine ground movement models in future assessments.
Ground conditions and tunnel excavation
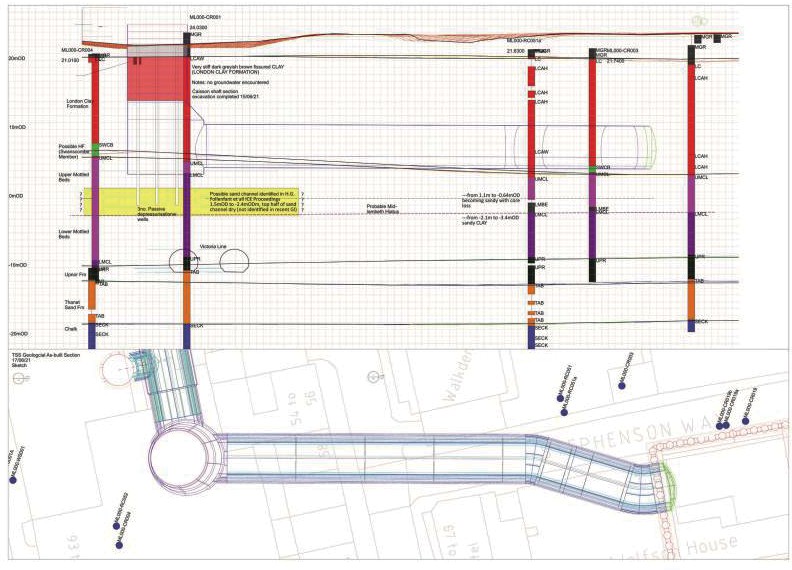
Ground investigation in the area allowed understanding of the ground conditions where the tunnel would be excavated through. Figure 4 shows the Tunnel Part 1 layout and location of closest boreholes in the area.
`
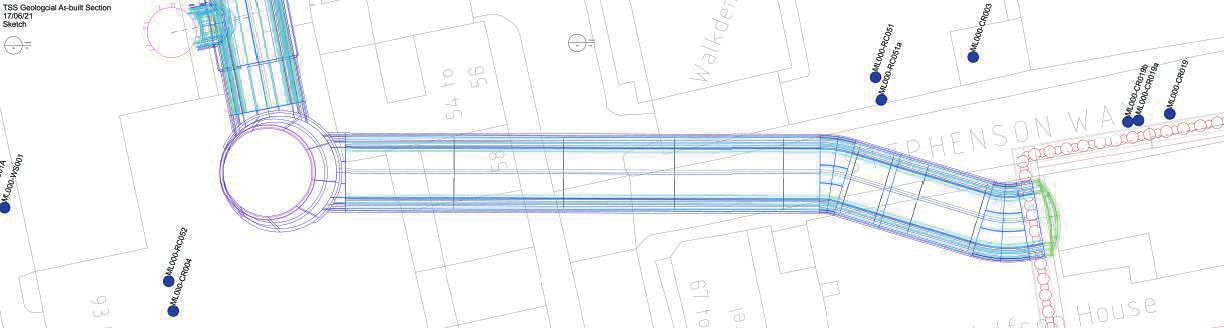
Figure 5 includes a section along the Tunnel Part 1 alignment and the geological strata of the boreholes.
Based on the available information, the soil profile presented in Table 1 was used in the ground models.
Soil Layer | Top Level (m OD) | Thickness (m) |
|---|---|---|
|
Made Ground |
24.0 |
2.6 |
|
London Clay |
21.4 |
19.7 |
|
Lambeth Group (cohesive) |
1.7 |
17.2 |
Therefore, the tunnel was assumed to be fully excavated in London Clay material through its entire length. Table 2 and Figure 6 include further details about the Tunnel Part 1.
| Attribute | Description |
|---|---|
|
Tunnel Construction |
Tunnel mined from the construction access shaft towards the piled box through London Clay material. SCL method with top heading and invert sequence. |
|
Tunnel axis level |
6.9 m to 7.1 m OD |
|
Length |
66 m |
|
Diameter (external) |
6.80 m (diameter of equivalent circle, tunnel is axisymmetric) |
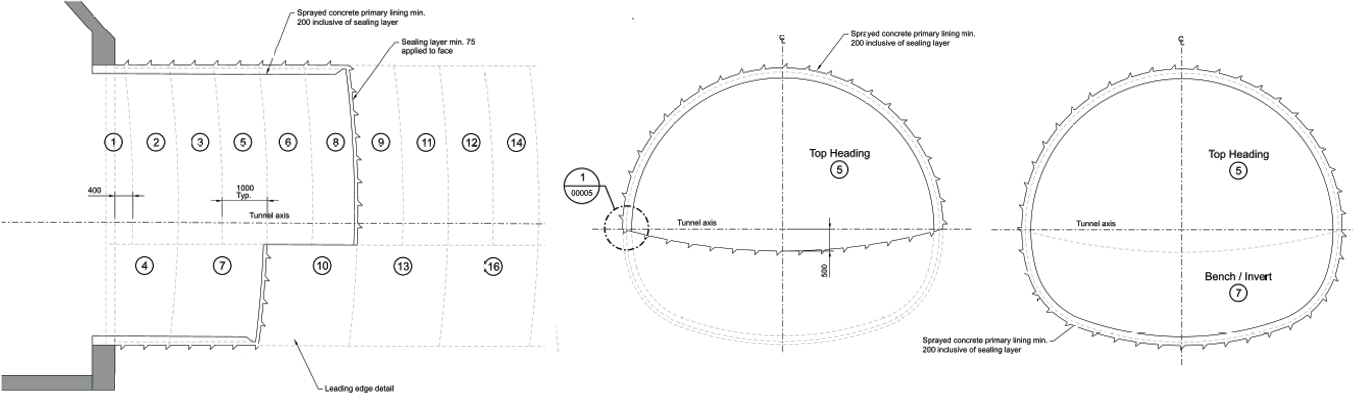
As shown in Table 2 and Figure 6, SCL method with top heading and invert sequence was used for the excavation of the tunnel. The excavation advances were defined at 1m length and the SCL section for the primary lining comprised a 200mm layer, sealing inclusive.
During the tunnel excavation, geological excavation face logging provided evidence of a very stiff, closely fissured, dark brown/grey silty clay, part of the London Clay formation. However, presence of Lambeth Group material had also been identified in some sections of the tunnel at invert level, with very stiff, closely fissured, red brown / light grey mottled silty clay.
Table 3 includes average excavation and spraying durations during the construction of Tunnel Part 1. From Table 3 durations and the excavation sequence shown in Figure 6, an average time of 10.25h can be considered to complete ring closure for a full face.
| Excavation (h) | Spraying (h) | |
|---|---|---|
|
Top Heading |
1.86 |
0.99 |
|
Invert |
3.35 |
1.20 |
|
TOTAL |
2.34 |
1.06 |
Ground Movement Prediction
Mott MacDonald, on behalf of Mace Dragados, produced a ground movement model to predict the ground movements induced by the Traction Substation works. Not only does this model consider the TSS works, but it also refers to any previous works in the area undertaken by the Enabling Works Contractor, with the aim to generate a cumulative assessment.
With the main objective of comparing the ground surface settlement predictions induced by a single tunnel against the actual settlement monitored on site, the MDJV Asset Protection team predicted ground surface settlement in Euston St, strictly induced by the TSS tunnel Part 1 (refer to Figure 2).
Tunnelling induces ground surface settlement. For tunnels excavated through London Clay, this settlement is commonly described by an inverted normal probability (Gaussian) curve in the transverse direction (O’Reilly & New, 1982 [1]) and a cumulative probability (Gaussian curve) in the longitudinal direction of the tunnel (Attewell & Woodman, 1982 [2]).
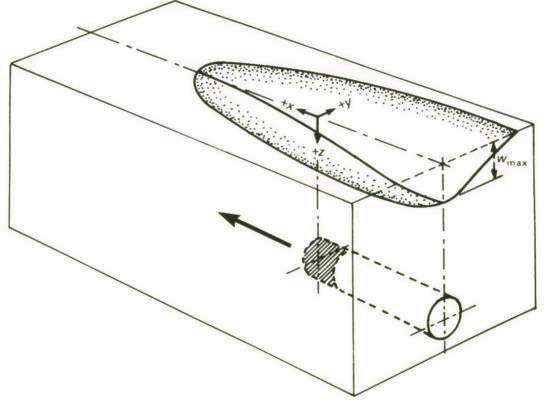
For a single tunnel, considering only vertical ground displacement at the surface, Figure 8 illustrates the shape of the settlement at ground surface level, in the transverse direction of the tunnel.
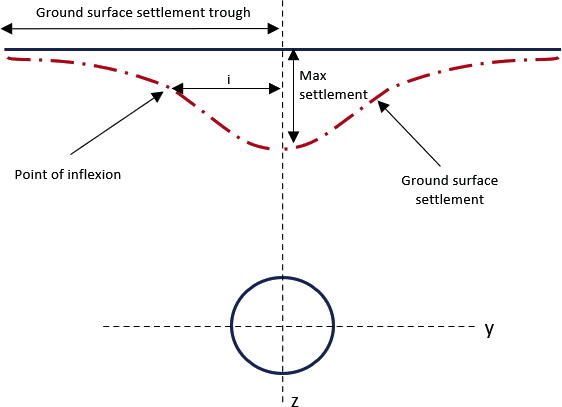
According to O’Reilly & New(1982) [1], the shape of the settlement trough above the tunnel would follow Equation (1):
(1)
Where i represent the horizontal distance from the tunnel axis to the point of inflexion of the Gaussian curve (standard deviation). As per Equation (2), i is proportionally related to Z0, the depth of the tunnel axis from ground surface; while K is an empirical constant of proportionality, the settlement trough parameter, which is dependent upon the ground conditions. A K value of 0.5 has been assumed for London Clay as per HS2 Technical Standard [3].
(2)
Sv max is the maximum settlement at the centre of the trough, calculated following Equation (3):
(3)
Vl is the volume loss expressed as percentage of the tunnel excavated volume. Four ground movement sources are understood to be producing the volume loss: an unsupported excavation face; movement prior supporting the heading; lining deformation; and, where applicable, movement associated with the passage of the shield.
The ground movement assessment of the Traction Substation tunnels was done considering undrained conditions, where there is no short-term change in volume of the soil. In this condition, the volume loss can be determined from the volume of the ground surface settlement trough per unit length.
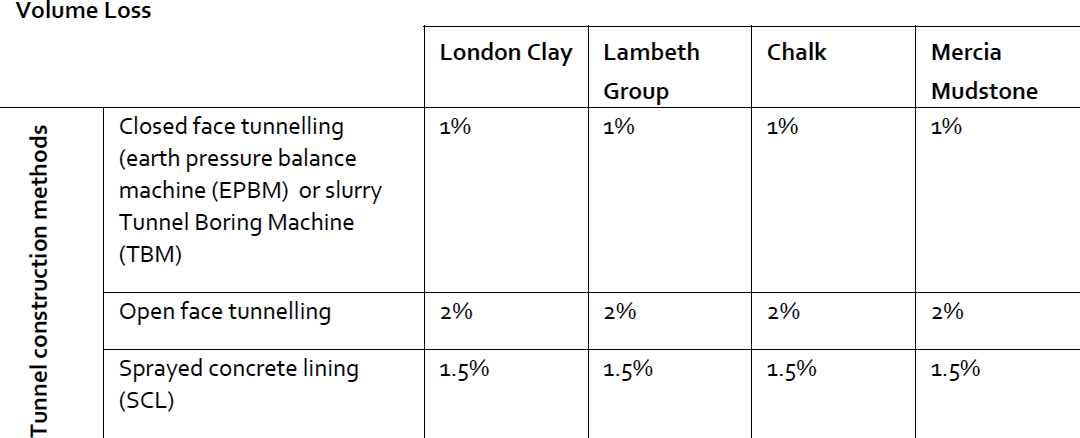
A volume loss of 1.5% was used for the TSS tunnels, as advised by the HS2 Technical Standard [3], where values of volume loss for various ground conditions and tunnel construction methods are provided (see Figure 9).
The width of the ground surface settlement trough is assumed directly proportional to the depth of the tunnel and the nature of the surrounding soils. An approximated value can be obtained from Equation (4)
(4)
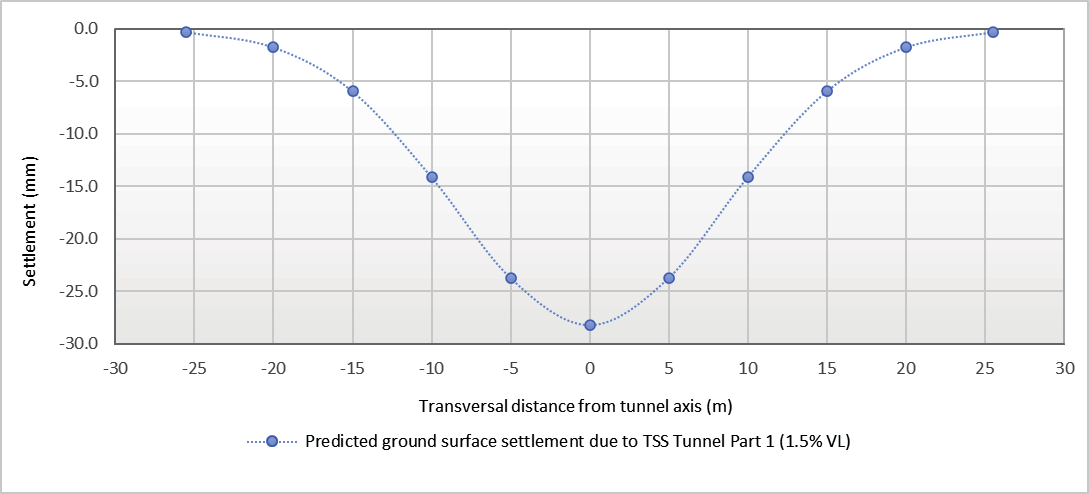
Following the described methodology, the TSS tunnel Part 1 would produce a ground surface settlement shape in the transversal direction to the tunnel as shown in Figure 10, with a maximum settlement of around 28.2 mm in the centre of the trough.
Regarding the longitudinal direction to the tunnel, an estimation of the ground surface settlement can be calculated with a cumulative normal distribution as per Equation (5):
(5)
Where x, y are the planar coordinates parallel and perpendicular to the tunnel axis, and r is the excavated radius of the tunnel. ∅(x) is the cumulative normal distribution function; and
Sv max is the maximum settlement at the centre of the trough, calculated following Equation (3).
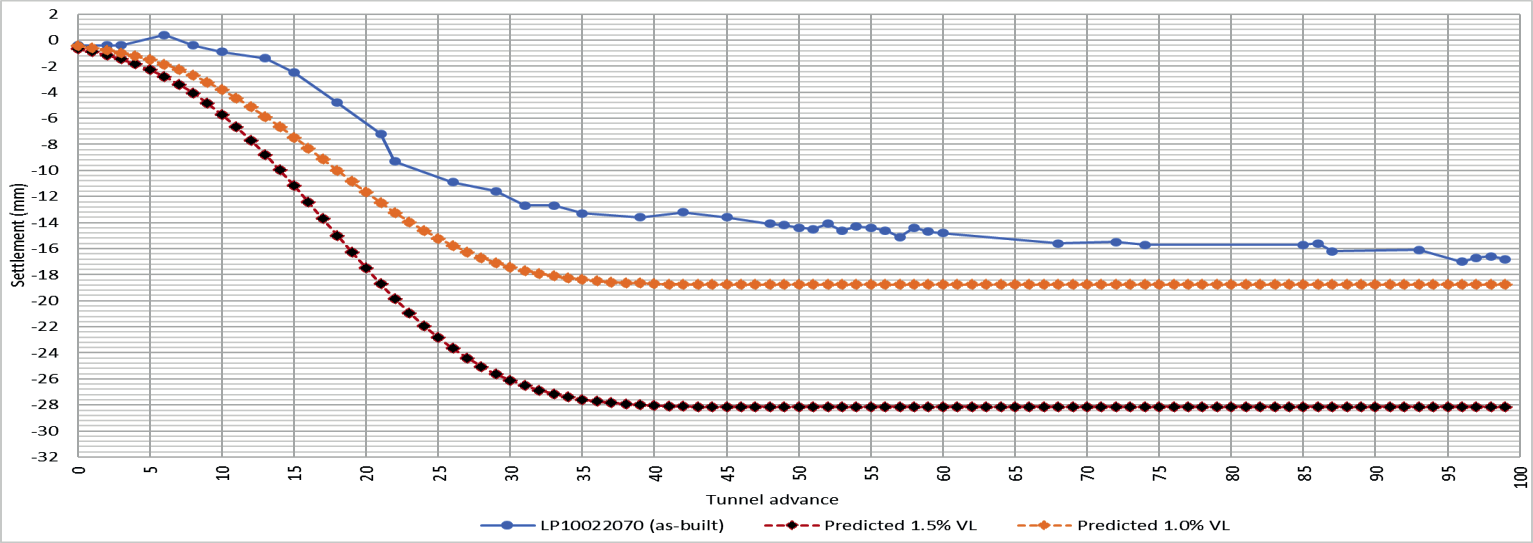
Figure 11 shows the predicted settlement development profile in the longitudinal direction of the TSS tunnel Part 1, for a point at ground surface located above tunnel axis, where y=0.
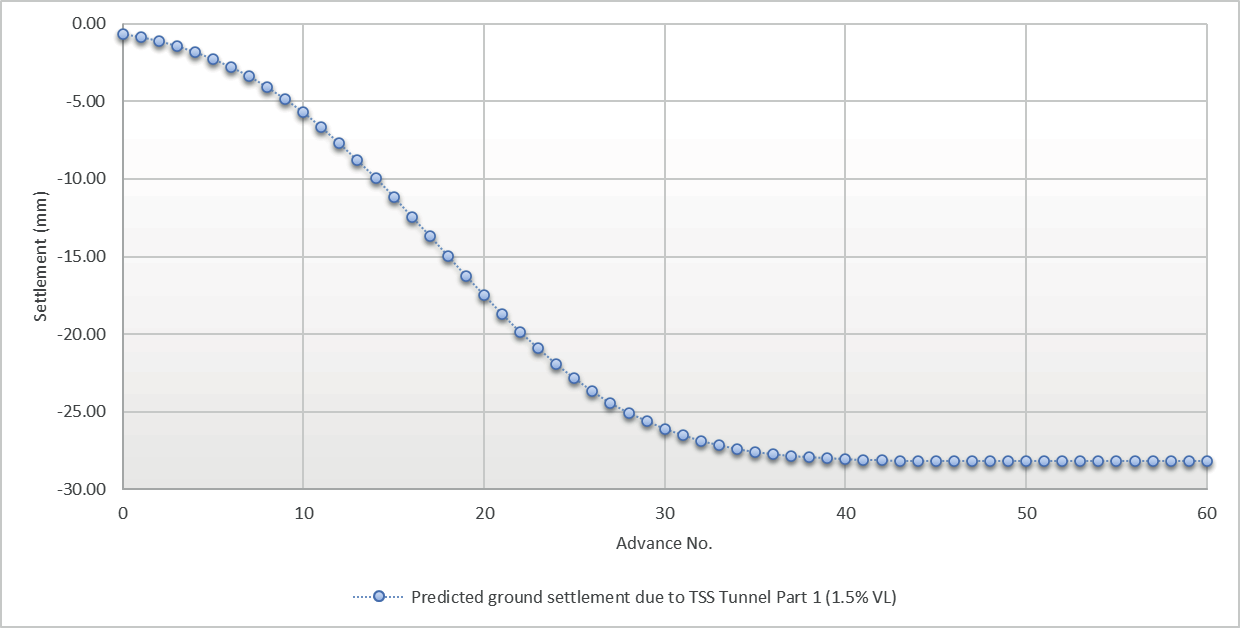
As shown in Figure 10 and Figure 11, a maximum ground surface settlement of 28.2 mm would have been expected in Euston St due to the TSS tunnel Part 1, where a single tunnel case scenario could be applied for a simplified estimation of ground settlement.
Instrumentation and Monitoring
A site wide ground surface I&M scheme formed by precise levelling points (PLP) was installed by MDJV. This I&M scheme is covering the TSS predicted Zone of Influence, delimited by the1mm settlement contour at ground surface.
Due to site constrains, PLP installation was not possible along the whole length of the tunnel. Two arrays were installed on Euston Street, in a transversal direction to tunnel alignment.
The PLPs are located at both sides of the road, labelled as arrays 021 and 022, and each array contains points every -approximately- 10m and 5m respectively. Daily manual monitoring was undertaken for these PLPs during the works.
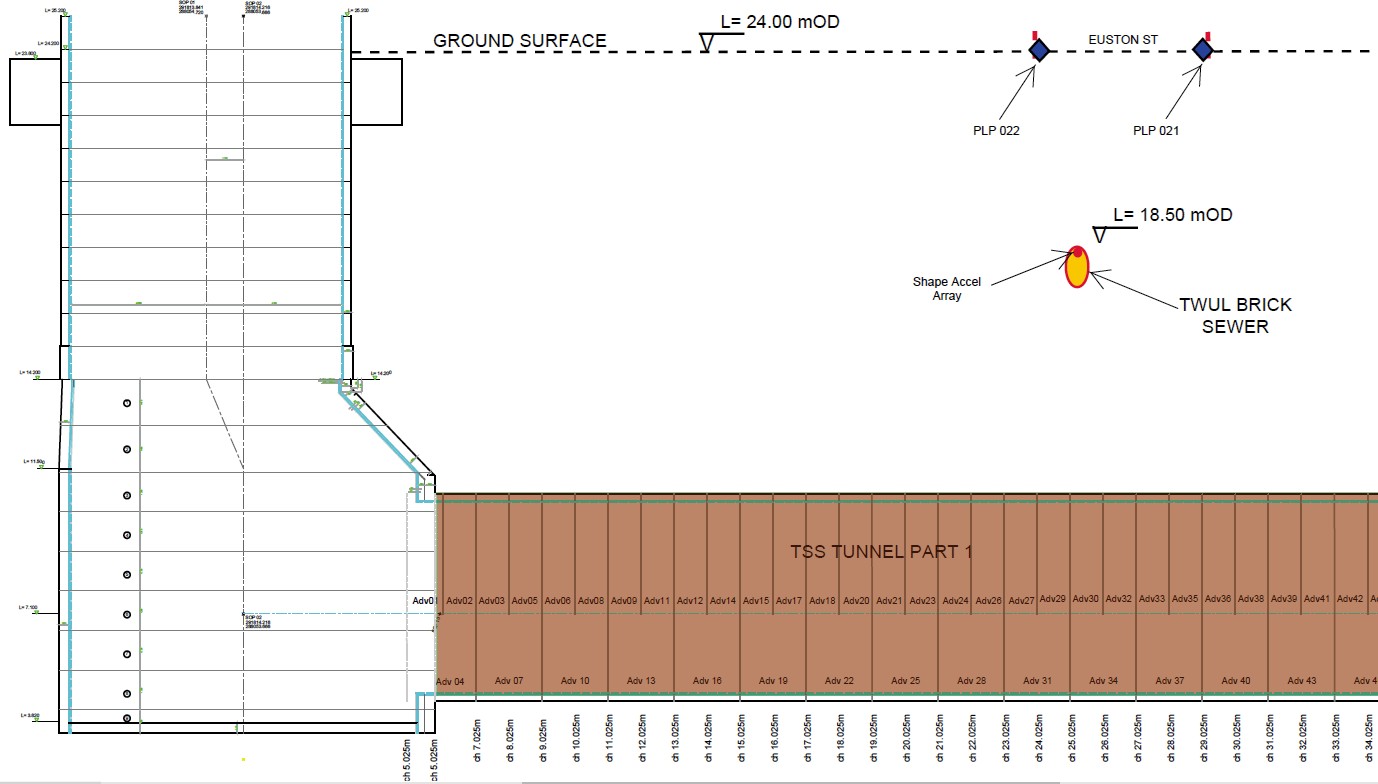
A shape accelerometer array (SAA) was installed within the TWUL brick sewer, at crown level, extending further beyond the predicted zone of influence to set fixed references. The SAA would inform in real time about the movement directly induced by the tunnelling works on the existing TWUL brick sewer. However, due to its location and alignment (transversal to tunnel running directly on top of it), the data was also fairly useful to understand ground settlement at depth due to tunnelling.
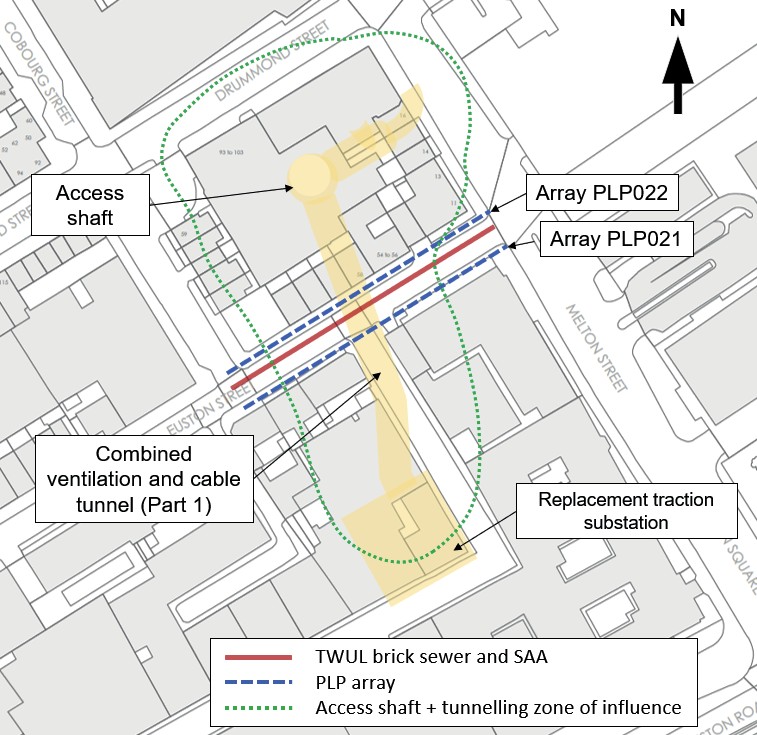
Figure 12 shows the approximate location of the PLPs and SAA in Euston Street.
The tunnelling works for the TSS tunnel Part 1 commenced on mid-September 2021 and were completed by end November 2021. This tunnel connects the access shaft with the piled box. The tunnel advanced in stages with maximum excavation round length 1000mm.
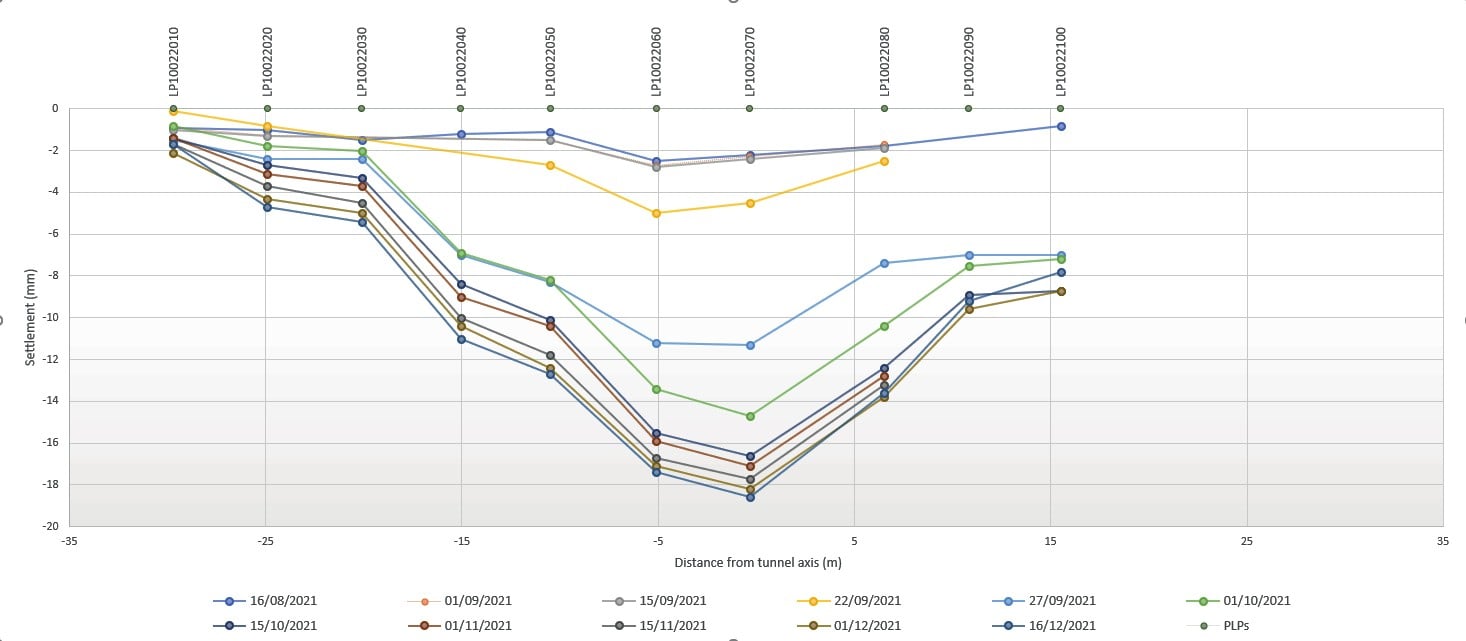
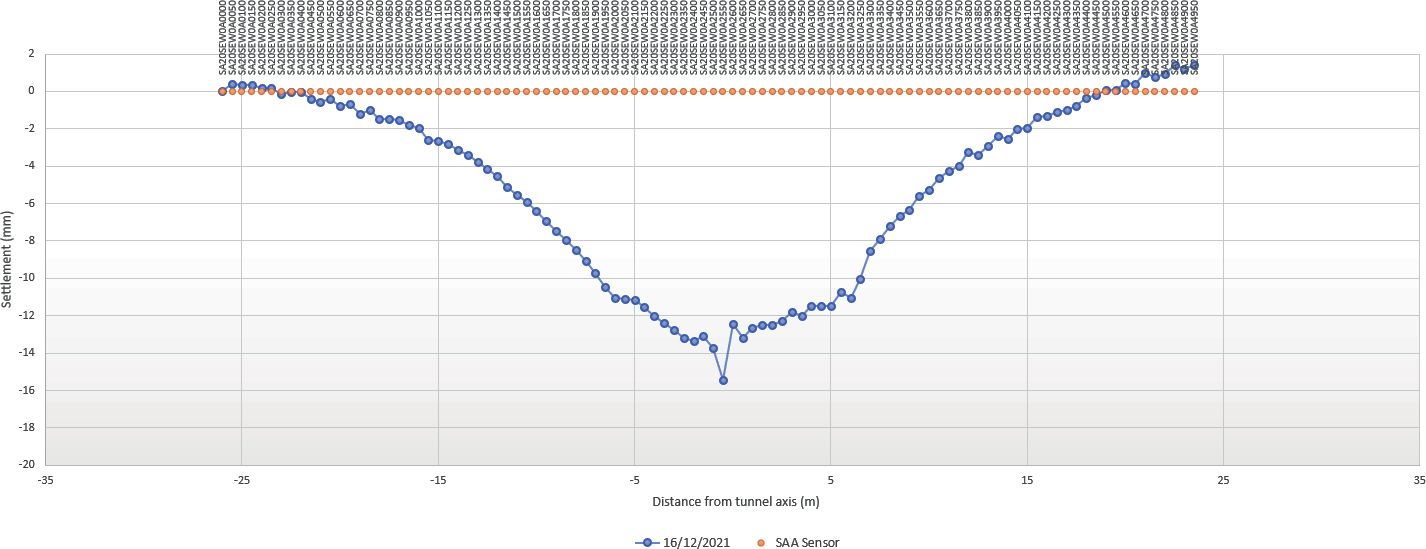
The manual instrumentation and monitoring allowed the actual settlement development profile to be plotted. Figure 13 and Figure 14 show the settlement profile at different dates during the tunnelling works, and the last set of readings available for this paper.
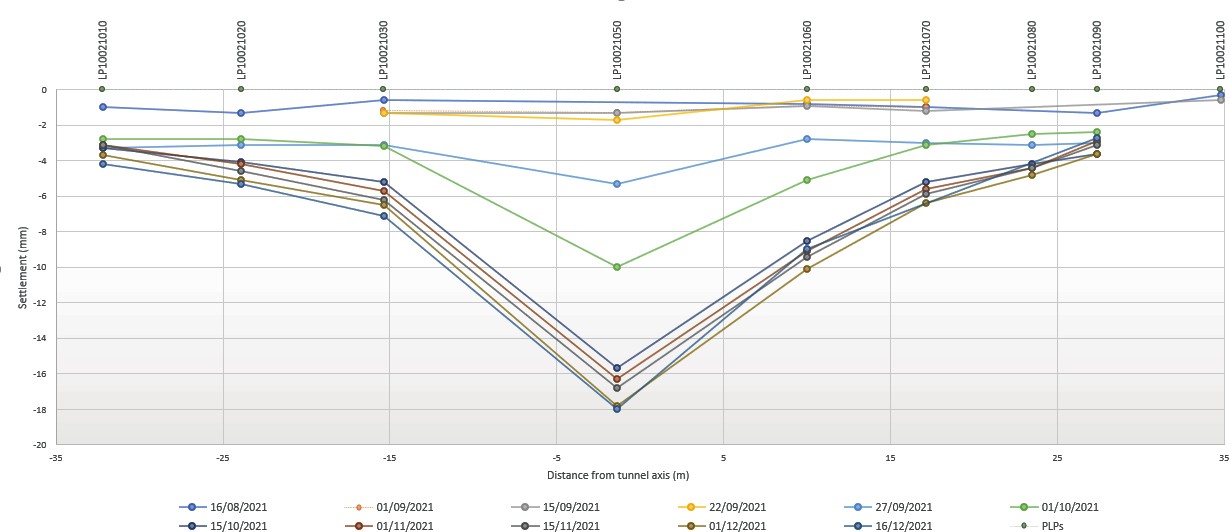
Moreover, it is worth noting that, although some minimum fluctuations are still being captured due to tolerance related to manual readings (circa ±2 mm), the movement is stable.
As expected, the settlement follows an inverted normal probability curve (see Figure 10). This is more evident in Figure 14, as a more detailed profile can be plotted due to the higher number of PLPs in this array compared with PLP 021 in Figure 13. However, data for all the precise levelling points was not able to be captured during the works, as some of the PLPs at array 022 were not accessible due to different site constrains. Despite that, the “East section” of the array contains data for all its points and the comparison with the available data in the “West section” would assume a fairly symmetric behaviour would have been occurred.
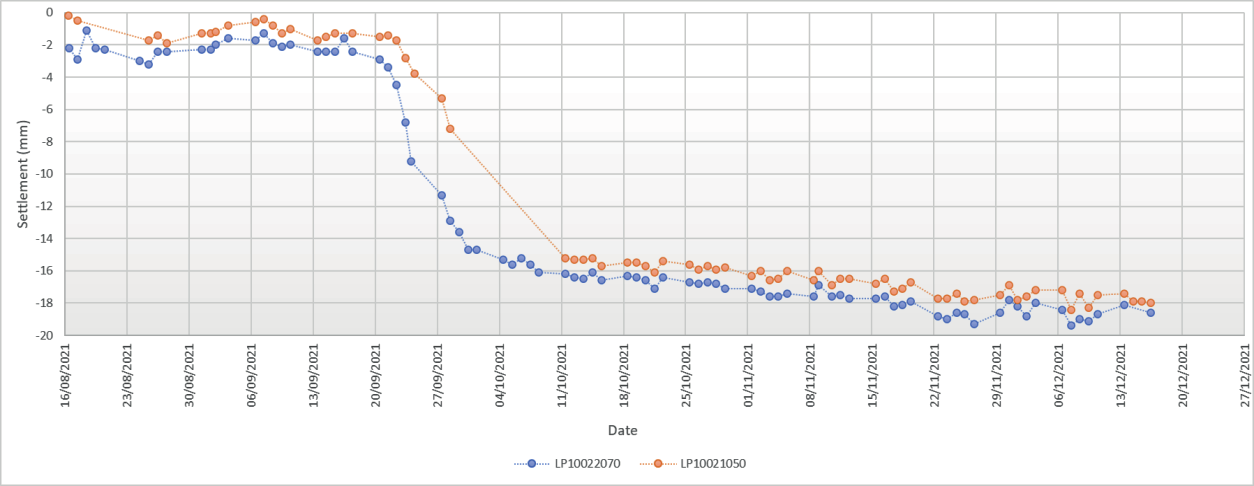
The maximum settlement monitored in arrays 021 and 022 is 18.0mm and 18.6mm respectively. These values have been obtained at the closest PLPs to the tunnel axis, PLPs named as LP10021050 and LP1002207, shown in Figure 15.
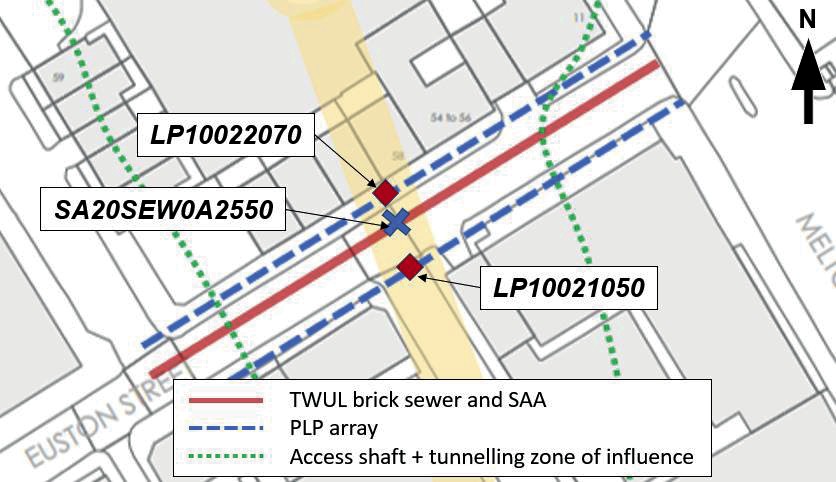
Focusing on these two points, the settlement development profile is shown in Figure 16.
The SAA also provided useful data that could be used for the purpose of this analysis. The sensors within the array are at every 500mm, and real-time data (every 10 mins) was received. This provided an important amount of data with a high accuracy due to the nature of the system and the automatic data collection. Figure 17 and Figure 18 show the settlement development along the array and settlement development for the sensor right above tunnel axis (y=0).
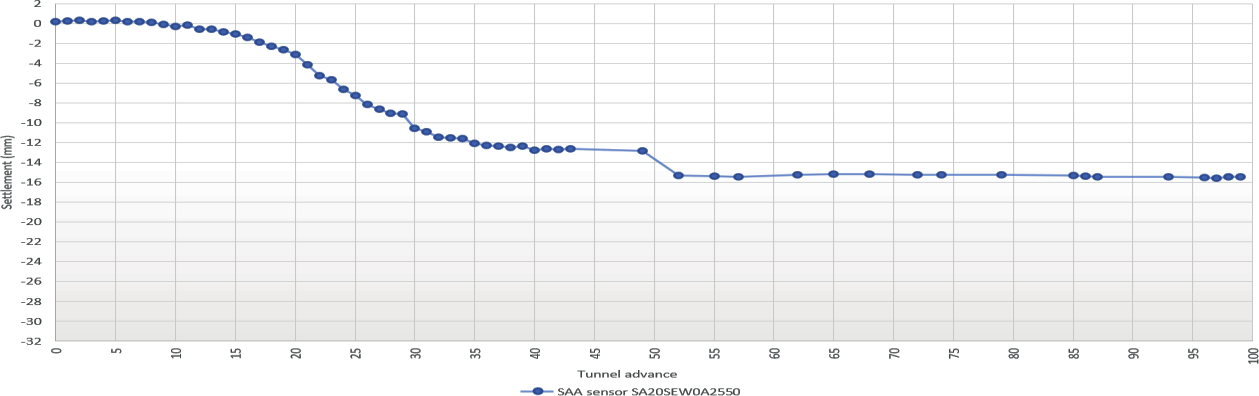
The maximum settlement captured by the SAA was 15.4mm. Due to location of the SAA (see Figure 19), around 5.8mbgl, ground settlement at this depth would have been expected to be higher than at surface level. However, a more complex analysis was required in this case, due to the interaction of the manmade asset and ground. A specific ground movement impact assessment was undertaken to understand the impact on the TWUL brick sewer due to the tunnel excavation. The assessment predicted up to 38mm settlement experienced by the brick sewer.
locations
Discussion
Upon completion of the tunnelling works, once the monitoring data is stable, there is an opportunity to compare the actual data against predictions. As the results from both PLP arrays referenced so far are consistent, PLP array 022 will be used for the purpose of this discussion.
Therefore, if the predicted settlement in the transversal direction to the tunnel (refer to Figure 10) is plotted against actual data captured in PLP array 022 (refer to Figure 14), it is possible to make some firm statements. Figure 20 below shows this overlap between predicted and actual data. Looking at the data collected in the graph below, the first thing that stands out is the maximum achieved settlement of 18.6mm, which means it is only 66% of the predicted value (28.2mm). However, the width of the settlement trough is larger. This means that, while a more extensive area has been impacted by the works (Zone of Influence), the impact within this area is lower than predicted, with a 34% reduction on maximum settlement.
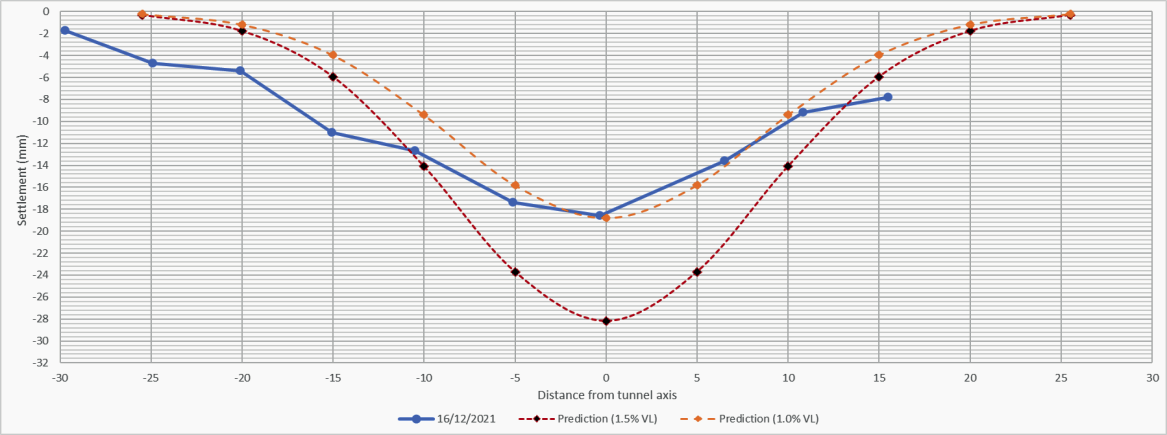
An estimation of the actual volume loss can be done using the actual settlement profile in Figure 20 and following the same calculus described within this paper. The maximum settlement from the monitoring data comes into a 1.0% volume loss approximately.
Furthermore, Figure 21 shows the comparison between predicted settlement development for a point at ground surfaced over tunnel axis (refer to Figure 11) and the actual monitoring data. As previously mentioned, the actual data relates to lower volume loss value than used for the GMA purposes.
From the comparison between the two graphs, two more notes can be raised. On the one hand, the settlement trough in the longitudinal direction to the tunnel is smaller than expected, which means the zone of influence from tunnel excavation face being shorter. On the other hand, although the final captured settlement (18.6mm) corresponds to approximately 1.0% volume loss, the development of this settlement took more time than expected, with residual settlement happening after tunnel excavation completion.
The results from the SAA within the TWUL brick sewer can also be related to the above conclusions. The volume loss value is a key input for the ground movement impact assessment on existing assets due to the tunnel construction. The actual settlement date is far less than predicted.
Conclusion
This paper describes the principles for predicting ground surface movement due to single tunnel construction and analyses a real case within the TSS works for the HS2 Euston Station.
The actual data captured from precise levelling points confirms the volume loss due to the tunnelling works being less than expected, around a 1.0% against the 1.5% volume loss considered for the settlement prediction.
The actual data from the shape accelerometer array within the TWUL brick sewer also shows a reduction in settlement values compared against the ground movement assessment predictions.
These results invite readers to think more deeply about the possibility to further refine the volume loss values for the London Clay. The ground movement models and impact assessments on existing assets due to tunnelling and underground works are directly dependant on the volume loss assumptions. Preventive asset protection and mitigation works are often required for existing assets within the zone of influence of the tunnelling and underground works that exceed standard acceptance criteria.
Refined values of volume loss, linked to the application of the Observational Method, could reduce and/or eliminate the amount and magnitude of preventive mitigations. This could not only contribute to reducing the carbon footprint but would also have direct benefits related to cost and programme.
Further analysis would be required in conjunction with the Designers and HS2 in order to validate the assumptions and understand the limitations of the single tunnel analysis as well as interaction with humanmade structures.
Acknowledgments
Special thanks to Shawn Sismondi and John Roseler, sound experts on ground movement and tunnelling, who always supported the author during his experience with the Traction Substation works referenced within this paper.
Hector Romero, TSS Design Manager who managed the challenge of inheriting ground movement assessments and refine them for the TSS works.
References
- O’Reilly & New (1982) Settlements above tunnels in the United Kingdom Their magnitude and prediction – Transport and Road Research Laboratory
- Attewell & Woodman (1982) Settlement development caused by tunnelling in soil – Ground Engineering November 1985 edition.
- High Speed Two (2019) Technical Standard Ground movement and assessment from underground construction (HS2‐HS2‐TN‐STD‐000‐000005)
Peer review
- Adrian St JohnEKFB
- Ruby KitchingInstitution of Civil Engineers