Design optimisation and challenges with the deepest shaft on HS2
This paper describes the design development of the deepest ventilation shaft along the C1 alignment – Chalfont St Peter Ventilation Shaft. The developed design solution was a 17.8m internal diameter, 65m deep shaft constructed within Chalk strata using 1200mm thick, 78m deep diaphragm walls. The Tunnel Boring Machines (TBMs) forming the twin running tunnels are positioned at 25m centre to centre spacing and directly intersecting the shaft walls to form the ventilation openings and service access routes into each bore. Specific technical challenges associated with the design are presented in this paper together with details of how advanced soil-structure interaction modelling using PLAXIS3D[7] finite element program has been utilised to optimise the design and construction of the shaft.
The detailed modelling of the stage construction and TBM advancement provided a clear insight of the load path and the arching/relaxation effects of the surrounding ground during different stages of the construction. This allowed reliable optimisation of the diaphragm walls and the collar structure design around the shaft openings without any temporary propping requirements inside confined work environment. The design forces for the critical elements of the shaft structure were directly extracted from the PLAXIS3D model to inform the detailed structural design.
- Written by
-
Raj Sivakumar (Align/Jacobs Engineering Ltd)

-
S. Sivakanthan (Align/Jacobs Engineering Ltd)

-
Peter Gilbert (Align/Jacobs Engineering Ltd)

-
Arirajasingham Maheetharan (Align/Jacobs Engineering Ltd)

- Resource type
- Resource type: Technical Paper
- Tags
- high speed rail posts
- HS2 posts
- Shaft posts
- tunnel posts
Background
The Chalfont St Peter Ventilation Shaft is part of the central section of High Speed Two (HS2) Phase One – Lot C1 – which includes the Colne Valley Viaduct and Chiltern Tunnels and is the responsibility of the ALIGN Integrated Project Team.
A schematic C1 alignment is shown below (Figure 1).
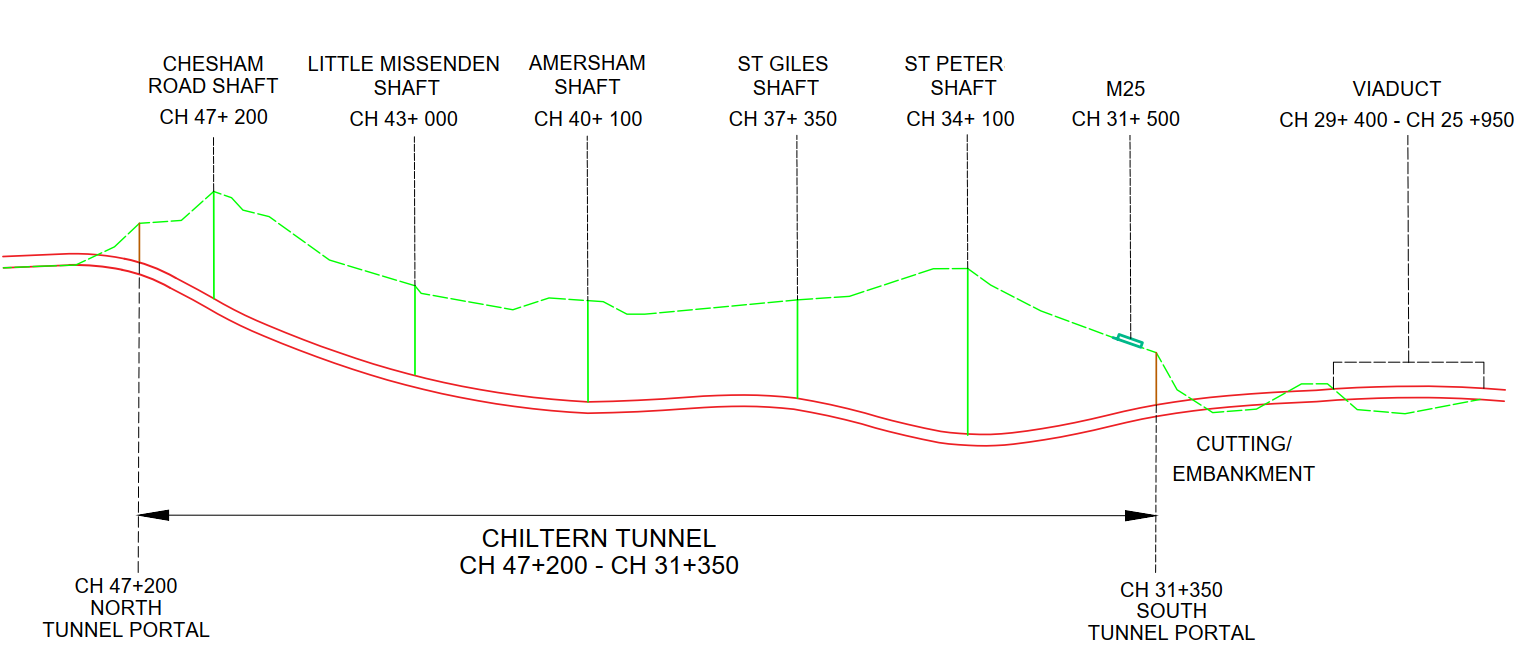
There are five shafts along the Chiltern Tunnel. The first shaft to be constructed is located at Chalfont St Peter (chainage: 034+143), lying just outside the Chilterns Area of Outstanding Natural Beauty (AONB). The shaft is principally to be used for fire fighter/emergency services intervention and to manage the tunnel environment during normal, congested, maintenance and emergency scenarios. At this location the depth to rail level is 63.2m below ground level.
Scheme design development
As part of scheme design, Align adopted a multi-criteria analysis methodology that involved option identification, evaluation and development of the preferred design option specific to the Chalfont St Peter Shaft site as well as the overall Chiltern Tunnel alignment.
The shaft comprises primary and secondary Reinforced Concrete (RC) linings with an internal diameter of 17.8m. The overall depth of the shaft formation level is 67m from the ground level. The 9.1m internal diameter twin tunnels are on an alignment of 25m centre to centre at this location and will intersect with the shaft walls just above the shaft base slab to allow construction of tunnel ventilation system openings and service access routes. The tunnel access adit will be T-shaped in plan and will provide access from the shaft to the tunnels. Tunnel and adit openings through the shaft wall will be strengthened by means of RC collars (Figure 2).
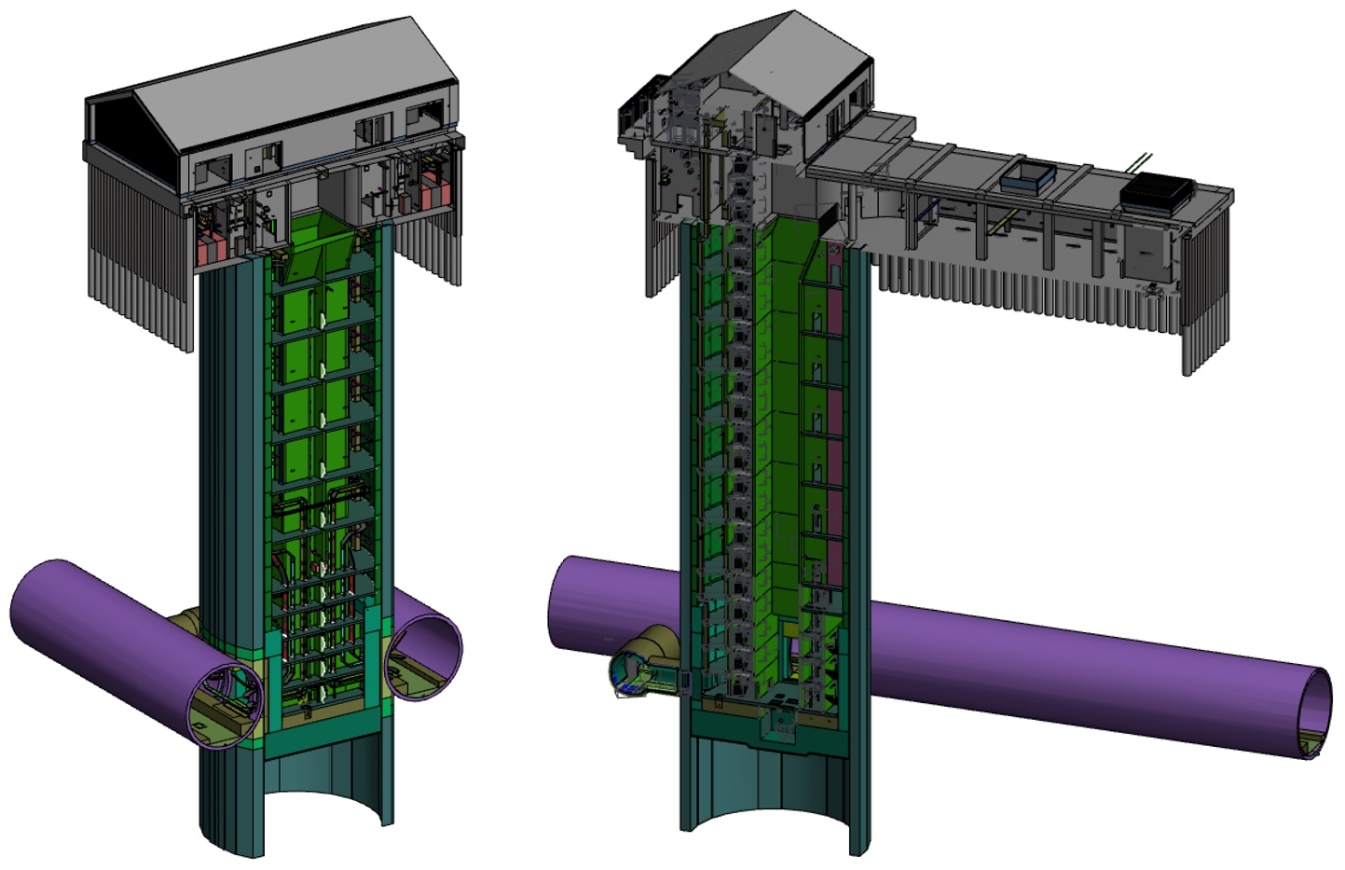
The shaft has been sized to accommodate the intervention lift core, space to facilitate tunnel ventilation (based on a maximum airflow of 200 m3/s), services and specified technical rooms. Ventilation fans and a number ancillary and support spaces are positioned horizontally within a below ground level scant piled wall basement. The design allows for a relatively small, architecture sympathetic headhouse and compound arrangement to be developed and integrated into the existing landscape in cognisance of HS2’s Design Vision.
Ground conditions & geotechnical parameters
Ground Conditions
The ground conditions are obtained from various Ground Investigation (GI) factual reports that cover the extent of the C1 Contract Area. The ground investigation and desk study information indicate that at Chalfont St Peter shaft, the geological sequence comprises:
- Superficial deposits (Beaconsfield Gravels);
- Seaford Chalk;
- Lewes Nodular Chalk Formation.
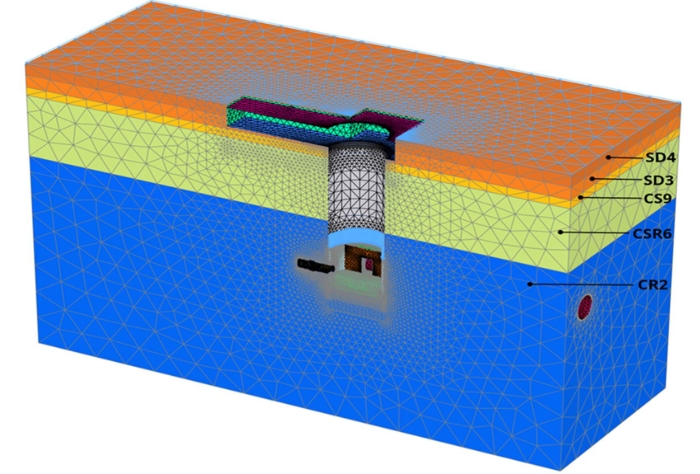
The interpreted ground condition for the shaft design is shown in Figure 3.
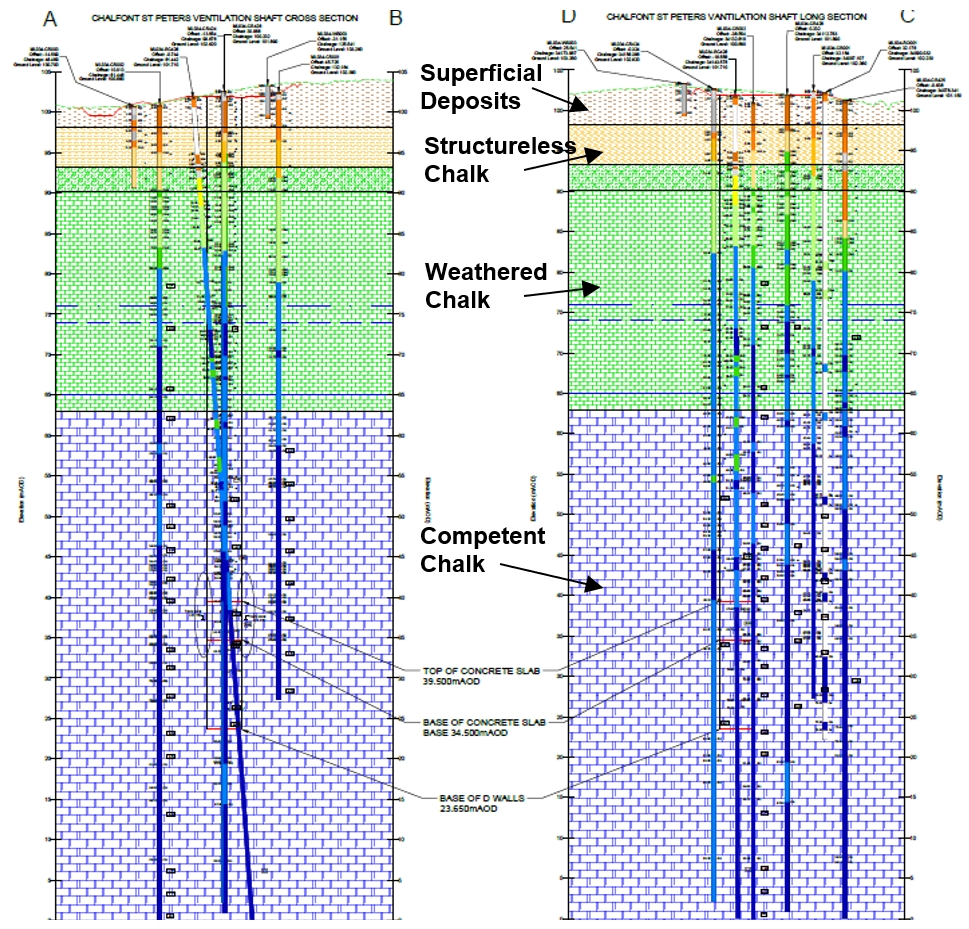
The ground condition at the shaft location comprises approximately 10m thickness of superficial deposits predominantly clay with flints, 4m thickness of structureless chalk, 16m thickness of weathered chalk and then competent chalk.
As part of the GI works, various in-situ testing including High Pressure Dilatometer (HPD) and Cross hole seismic testing and other general laboratory testing were carried out to obtain the design geotechnical parameters. Groundwater levels have been monitored and were reasonably well understood from the GI works. Pumping tests were carried out to assess the mass permeability of the Chalk which was used to assess the water control requirements during the bulk excavation to the shaft formation level.
Geotechnical Parameters
The geotechnical parameters were derived based on scheme wide and shaft specific supplementary GI information. The summary of the geotechnical design parameters is given in Table 1.
| Engineering Geological Units | [kN/m3] | c’ [kPa] | ’ [º] | [-] | E’ [MPa] | K0 [-] |
|---|---|---|---|---|---|---|
|
Superficial Deposit (SD4) |
19 |
0 |
22 |
0.2 |
12 |
0.60 |
|
Superficial Deposit (SD3) |
19 |
5 |
26 |
0.3 |
22.5 |
0.60 |
|
Structureless Chalk (CS9) |
19 |
5 |
34 |
0.4 |
45 |
0.5 |
|
Weathered Chalk (CRS5/CRS6) |
19 |
10 |
32 |
0.3 |
700 |
1.2 |
|
Competent Chalk (CR2) |
20 |
40 |
34 |
0.2 |
1500 |
1.5/2.0 |
|
Competent Chalk (CR3/CR2) |
20 |
40 |
34 |
0.2 |
1500 |
1.5/2.0 |
|
Competent Chalk (CR1) |
20 |
40 |
34 |
0.2 |
1500 |
1.5/2.0 |
The Chalk stiffness at the tunnel region, the lateral earth pressure coefficient at rest (K0) and the location of the water table are the key ground parameters that dictates the shaft design. For the ground, a Mohr-Coulomb model [7] has been adopted in the analysis.
Ground Stiffness
Considering the small strain levels associated with the circular shaft construction, the stiffness values corresponding to 0.1% shear strain level have been generally adopted for the design except for the tunnel zone where the stiffness values corresponding to 1% shear strain have cautiously adopted allowing for potential relaxation due to tunnelling works.
Groundwater levels
The groundwater table was obtained from ground investigation data. The following design groundwater levels have been used for the design of the shaft.
- +65.0 mAOD for short term (during construction) based on recorded GW levels;
- +76.0 mAOD for long term considering 120 years design life plus climate change effects.
Lateral Earth Pressure Coefficient at rest
One of the challenges in the shaft design is determining the lateral earth pressure coefficient at rest (K0) which is a critical parameter controlling the diaphragm wall thickness. Also, there is limited published field data on the actual earth pressures measured at the back of retaining structures in Chalk. CIRIA 574 (Lord et al., 2002) [1] mentions that in practice it is commonly assumed that at shallow depth K0 lies between 0.5 and 1.0; however, at greater depths, Twine and Wright (1991) [10] adopted K0 of unity based on limited data. CIRIA 760 [2] cites that based on back analysis of retaining walls in very weak rock, Richards et al (2004) [8] and Hayward (2000) [3], a value of K0 close to unity should be adopted given the high stiffness of the rock mass. According to Warren (2018) [11], for the North Downs Tunnel, K0 values in the range 0.5 to 1.5 were adopted for Chalk for the tender design based on the results of pressure meter tests in boreholes located along the route and a review of the published information for the Channel Tunnel. Hydro fracture tests results indicate that K0 values varies between 0.6 to 2.0 along the North Downs Tunnel.
Schwamb (2014) [9] studied the K0 of the Chalk for the Lee tunnel shafts in East London and examined whether modelling the wall installation or assuming a WIP (wished-in-place) wall influences the results. They installed strain gauges to measure the hoop strain and back calculated the earth pressure coefficient (K) at the end of shaft construction. The back-calculated K value varies between 0.7 to 1.4 depending on the assumed effective wall thickness and E value of the concrete They concluded that the assumed value of K of unity at the end of wall installation best matches the measured deflection data at the end of excavation to formation level.
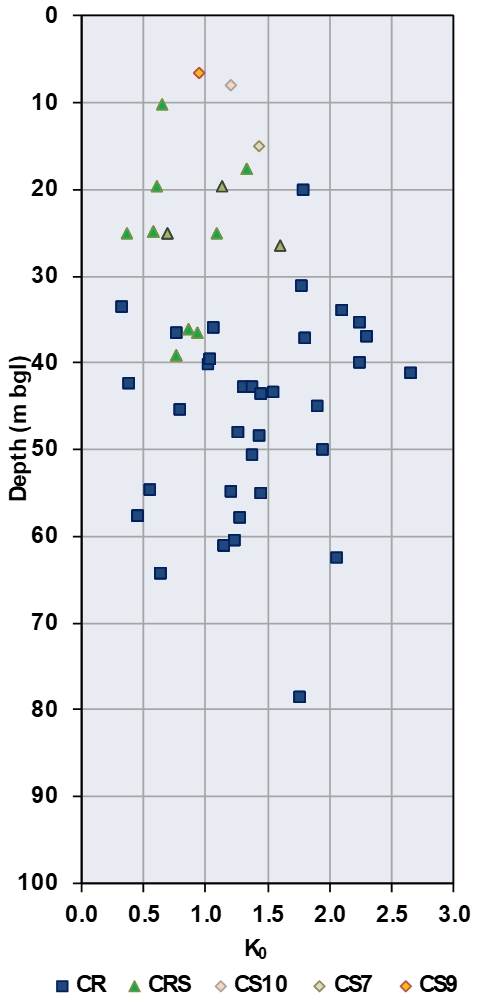
The results obtained from the HPD tests carried out at this site are shown in Figure 4: K0 values derived from HPD testing. Based on these results K0 value at this site generally lies 0.5 to 2.5; the wide scatter showing the difficulties in reliably measuring the K0 in Chalk. It is therefore considered prudent to carry out two checks for the shaft design as follows:
- Case 1 (Best Case Scenario): K0 = 1.5 with a load factor of 1.35 applied to the results obtained from the PLAXIS model to obtain the ULS structural forces.
- Case 2 (Worst Case Scenario): K0 = 2.0 with a load factor of unity applied to the results obtained from the PLAXIS model to obtain the ULS structural forces.
Lateral earth pressure coefficient value at the end of wall installation
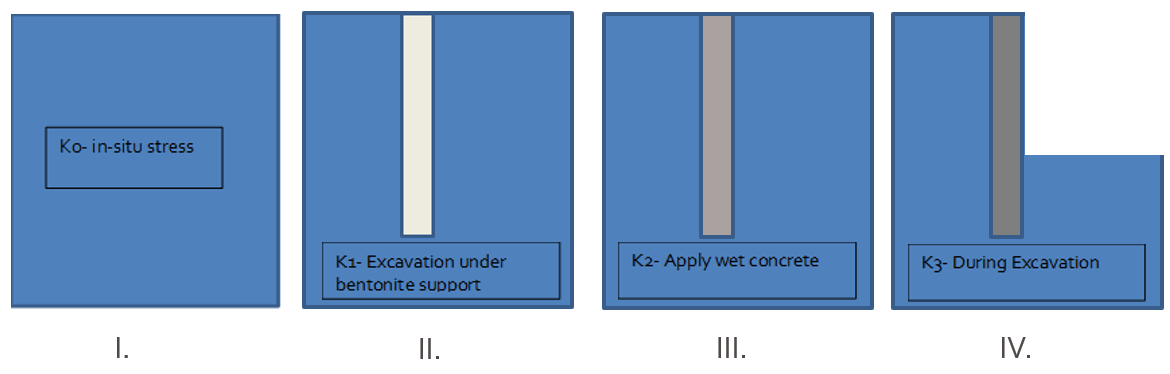
The diaphragm wall construction method will cause relaxation of the ground with the consequence of reduction in the lateral earth pressure coefficient from the in-situ value (K0). This relaxation effect has been assessed by modelling the detailed construction sequence of the diaphragm wall installation using PLAXIS3D. The detailed modelling stages adopted in PLAXIS are as follows (see Figure 5):
Stage I: Initial K0 conditions;
Stage II: Trench excavation for the first diaphragm wall panel (2800mm wide) construction under bentonite support; in PLAXIS, this is achieved by excavating the trench in stages whilst simultaneously applying the bentonite pressure (using bulk unit weight of 11.5 kN/m3) at the sides and the base of the excavation;
Stage III: Fill the trench with concrete in stages whilst simultaneously replacing the bentonite pressures with bi-linear wet concrete pressure [2];
Stage IV: Assign harden concrete properties for the concrete;
Stage V: Repeat Stages I to IV, for four adjacent panels either side, two each side of the first panel, to capture the full benefit of the relaxation effect on the design.
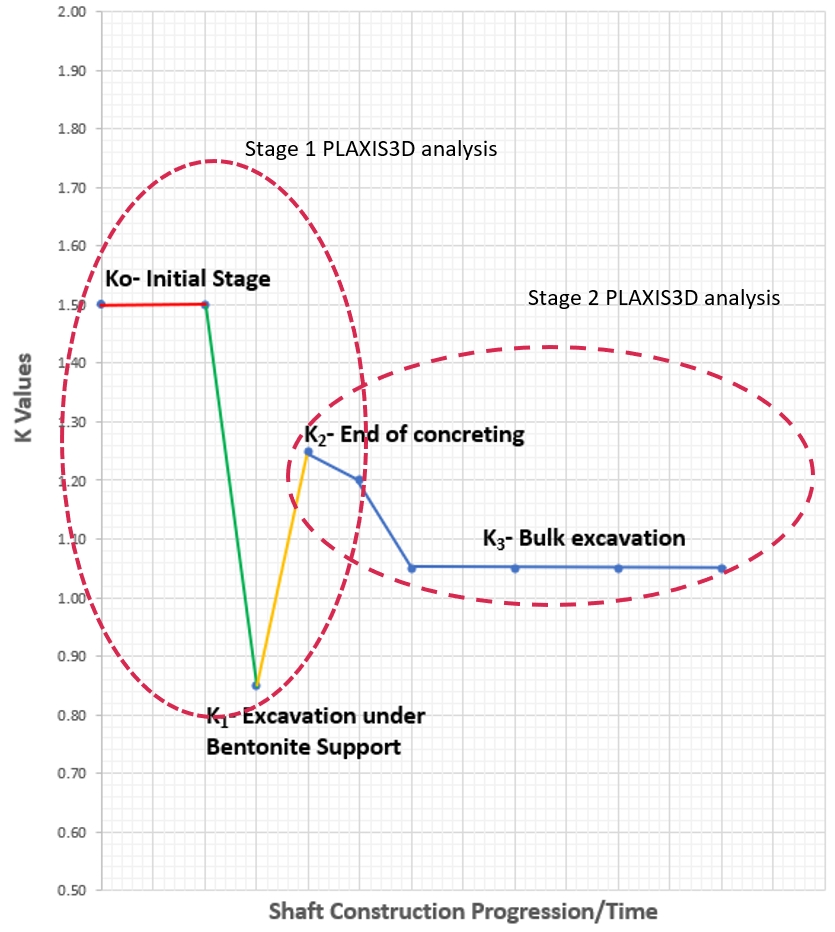
The variation of lateral earth pressure coefficient (K = σh’/σv’) in the competent Chalk zone at depth obtained from the PLAXIS3D model at various stages is shown in Figure 6. The initial K value of 1.5 (K0) drops to 0.85 (K1) at the end of trench excavation and jumps back to 1.25 (K2) at the end of wall construction. The reduction in K value is approximately 17% due to wall installation.
The value of 1.25 has been used as the starting value for the separate PLAXIS3D model developed to simulate the bulk excavation and other works associated with the shaft construction as explained later in this paper. For completeness, the bulk excavation works for the shaft construction resulted in further reduction of the K value to 1.05 as shown in the Figure 6.
Shaft design details
General
The depth to formation level of the Chalfont St Peter shaft is 67m from the ground level. The shaft will be formed using 1200mm thick 6 No 6.5m wide diaphragm wall panels and 10 No 2.8m wide closing panels. The diaphragm wall will be designed to resist the full ground and groundwater pressure during construction and permanent conditions. A 400mm thick inner lining wall will be formed using Steel Fibre Reinforced Concrete designed to resist the full groundwater pressure. A waterproofing membrane will be placed in between the diaphragm wall and the inner lining wall to provide double protection to potential water leak.
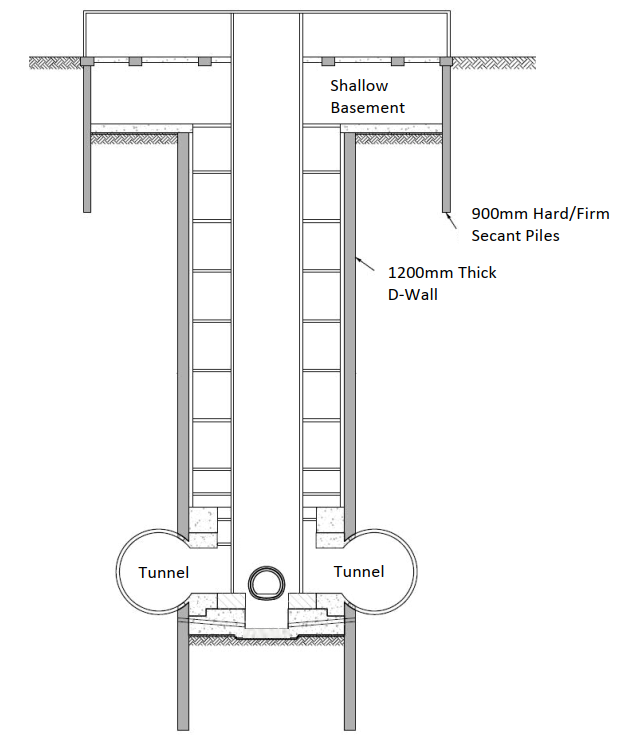
Due to the intersection of the TBM tunnels and the shaft wall, the openings size is different at inside and outside faces of the shaft lining; an elliptical shape opening with 11.0m at major axis level and 7.88m at minor axis level is formed at the internal face of the shaft. In addition, another 4m diameter opening is to be formed in the shaft wall to connect the SCL access passageway. A collar structure is provided to strengthen the diaphragm wall prior to forming these openings. A typical schematic cross section of the shaft structure is shown in Figure 7: Cross-section of Chalfont St Peter Shaft.
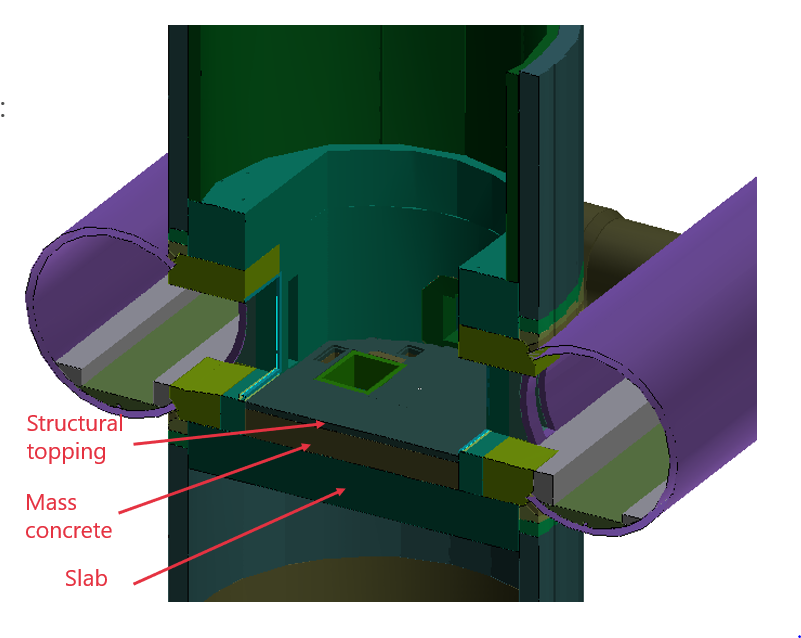
The collar structure will have to be constructed prior to the TBM arrival with appropriate geometry and details to resist the TBM thrust and the lateral forces from the tunnel structure due to unbalanced earth loading. To this effect, the section of the collar structure to be cut by the TBM is formed using mass concrete (with no reinforcement) and the rest of the collar structure section provides a credible and safe load path during all stages of the tunnel opening works.
In addition to the main openings formed by the TBMs, the service openings will be formed subsequently and are separated from the main openings by 4m (high) x 1.3m (wide) x 0.85m (thick) concrete columns – referred as ‘Openings Column’ hereafter. A typical Tunnel/Shaft interface detail including service openings is shown in Figure 8.
One of the key geotechnical challenges with any shaft construction is the control of water which could otherwise lead to hydraulic instability issues. Considering the depth of the shaft, the global uplift following the shaft base slab construction is not critical for this shaft. However, during the excavation to the shaft formation level, hydraulic uplift forces could cause base instability at formation level. This risk is managed by designing an appropriate de-pressurisation system to control the groundwater pressure below a specified threshold value until the base slab is poured and the concreted has reached the design strength; the depressurization system should be in place 24/7 with an appropriate backup system.
Advanced Soil-Structure Interaction Analysis
As described in section 5.1, the interaction of the tunnel with the shaft is a complex design situation involving several micro stages of construction. In such a situation, the temporary situation is more onerous than the permanent condition. A careful consideration and understanding of the load path at each micro construction stage is vital to achieve a safe and economical design. It was therefore decided to model the shaft construction and tunnelling works with sufficient detail using PLAXIS3D finite element model to assist the structural design of the shaft walls and the collar structure.
Considering the complexity of the design situation, two PLAXIS3D models were developed:
Model 1:
The purpose of this model was to understand the overall behaviour of the shaft structure including the collar structure. The results from the analysis were used to optimise the thickness the diaphragm wall and base slab, and to provide the necessary forces for the structural design of the diaphragm wall. The collar structure was not modelled with sufficient fineness to accommodate the micro-stages associated with the detailed construction of the collar structure following the TBM breakout.
In this model, the shaft wall was assumed to be ‘wished-in-place’ and the lateral earth pressure coefficient obtained from the end of wall installation analysis (see section 5.6) used as the starting point; i.e. the relaxation effect is explicitly included by assigning the earth pressure coefficient.
The modelling stages for this model included the following:
- Set the ground model with lateral earth pressure coefficient set to K2;
- Bulk excavation in 3m stages to water table level;
- Activate de-pressurisation to the specified pressure;
- Continue bulk excavation in stages of 3m to shaft formation level;
- Construct shaft base slab;
- Place mass concrete above the base slab;
- Construct collar structure;
- De-activate de-pressurisation;
- Advance TBM1 in 2m stages starting the process;
- Advance TBM2 as above;
- Form the main openings;
- Form SCL access passageway;
- Shallow basement construction;
- Simulate long term water conditions.
A typical view of the PLAXIS3D model is shown in Figure 9. The diaphragm wall, tunnels and access passageway were modelled using plate elements. However, the shaft base slab and the collar structure were modelled using volume cluster elements.
During the TBM advancement, the tunnel slurry pressure of 240 kPa (groundwater pressure at the tunnel axis level +10 kPa ) was applied on the unlined section of the tunnel and the TBM advanced in 2m stages. In addition, 120 kPa pressure was applied to simulate the TBM cutter head load during the breakout of the shaft. When the 2m length of tunnel segment was activated in stages, the tail grouting pressure of groundwater pressure +110 kPa was applied around the new tunnel segments. This modelling process was repeated 15m either side of the shaft to capture the impact of TBM on the shaft. The stiffness of the tunnel lining was adjusted considering radial and longitudinal joints between the segments.
Model 2:
Model-2 is very similar to Model-1, however, the region of the shaft openings and the collar structure have been modelled with sufficient fineness to accommodate each and every micro-stage associated with the opening works. The purpose of this model was to understand closely the influence of the intermediate construction stages associated with the opening works which have significant influence in the final design forces. In particular, the opening of both ventilation and the service openings (which is not considered in Model-1) are modelled in detail such that design forces on the critical ‘Openings Columns’ could be assessed reliably. This model also included the details of the temporary works within the tunnel which add to the challenge.
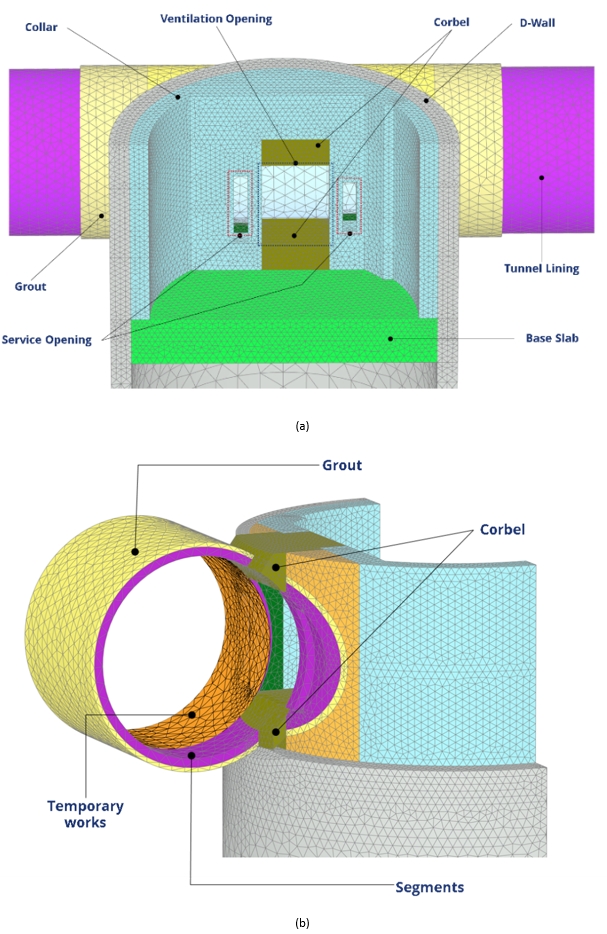
Due to the fineness of the finite element mesh adopted and to achieve computational efficiency, the top 38m of the ground was not included in the model, but the ground stresses were simulated by applying the equivalent surcharge; i.e. only the soil continuum up to 20m above the formation level was included in the model. Further, the diaphragm wall, tunnels and the collar structure were modelled using volume cluster elements to improve the accuracy of the results. The infill concrete between the collar and the tunnel was modelled with tension cut-off. The Typical PLAXIS3D model is shown in Figure 10 a & b.
Results and discussion
Diaphragm wall Thickness (Model-1)
One of the critical outputs from the PLAXIS3D analysis was the determination of the hoop compression forces and the horizontal bending moments in the diaphragm wall. The diaphragm walls will be constructed with the maximum vertical tolerance of 1:400 and this information has been used to assess the effective wall thickness at depth where the hoop stresses are high. The effective wall thickness has been further reduced by allowing for horizontal moment effect and the resultant maximum compressive stress is verified for code compliance.
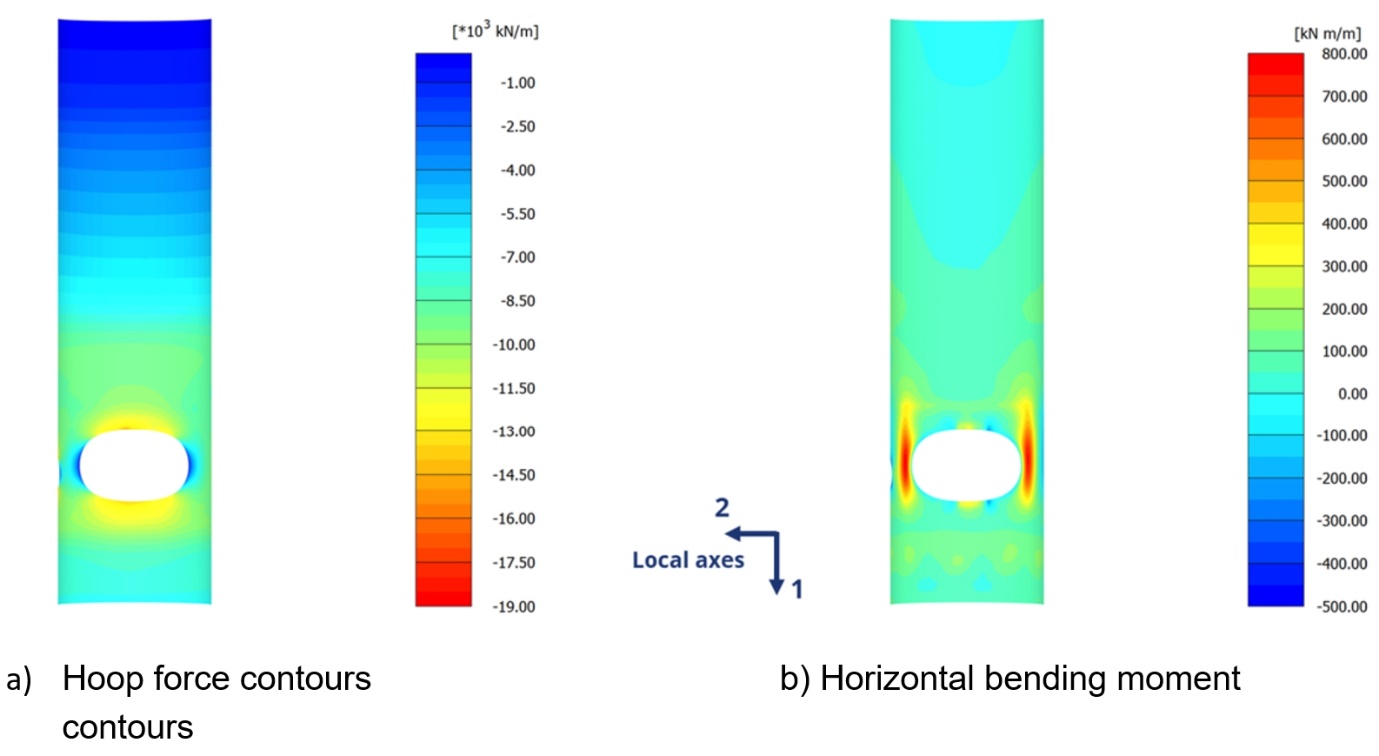
Hoop force, horizontal bending moment, axial force, vertical bending moment and shear force for the diaphragm wall have been obtained at various stages of the PLAXIS3D model (Model-1) to check and verify the adequacy of the design. Typical results are shown in Figure 11 and Figure 12.
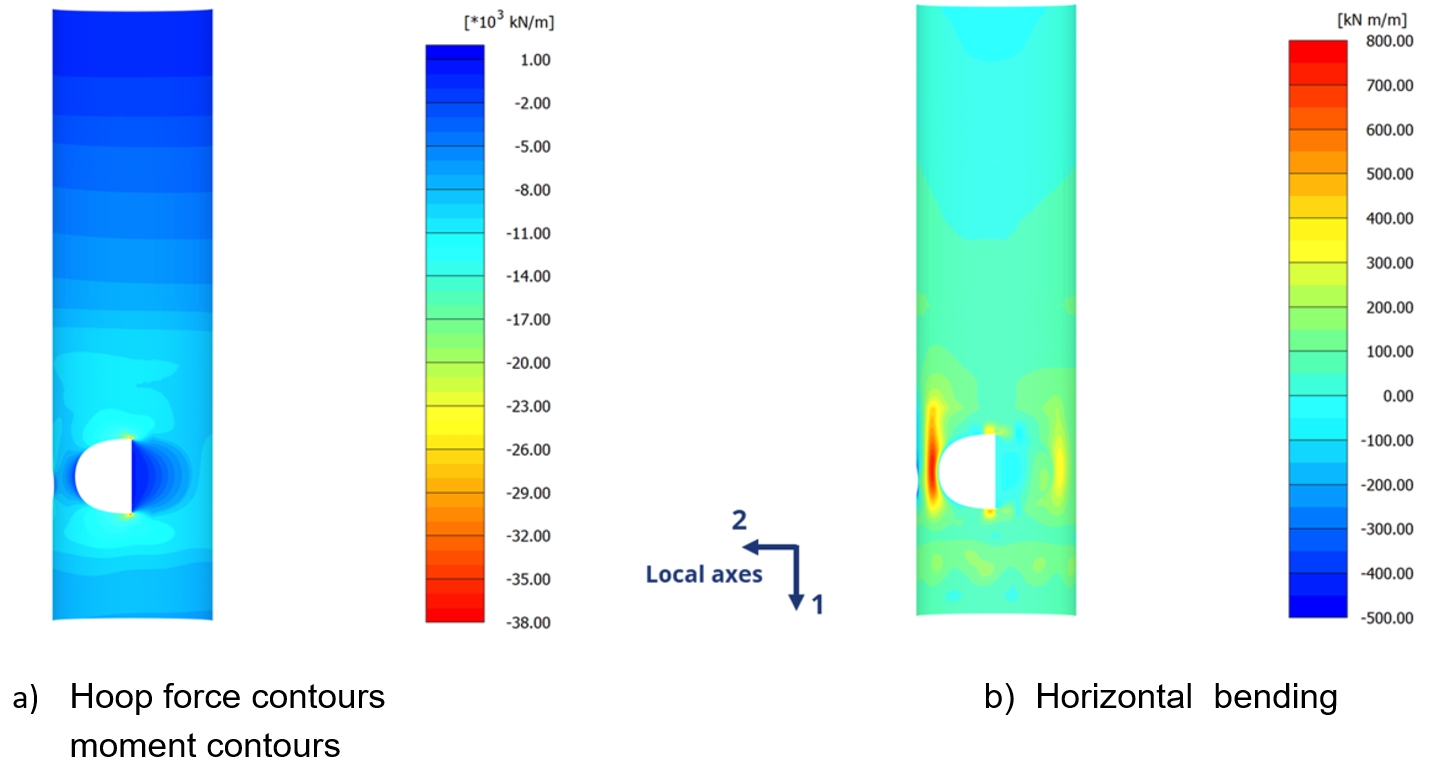
As highlighted, there is a high concentration of stress around the corner (100 mm zone) during the TBM at half-way through the opening of shaft. This is a very localised effect due to the sharp TBM engagement adopted in the modelling, however, in reality the cutting-edge radius of the TBM will not induce such stress concentrations. For design compliance purposes, the compressive forces have been averaged over the distance of 1m (the same order as the thickness of the wall). At end of TBM passing, stresses are less critical – approximately 25% lower than the during cutting situation, partly due to cutter head load.
Based on the results of the PLAXIS3D work, the wall thickness has been reduced from 1500mm assumed during the scheme design to 1200mm for the wall concrete grade of C50/60 as the optimum design solution.
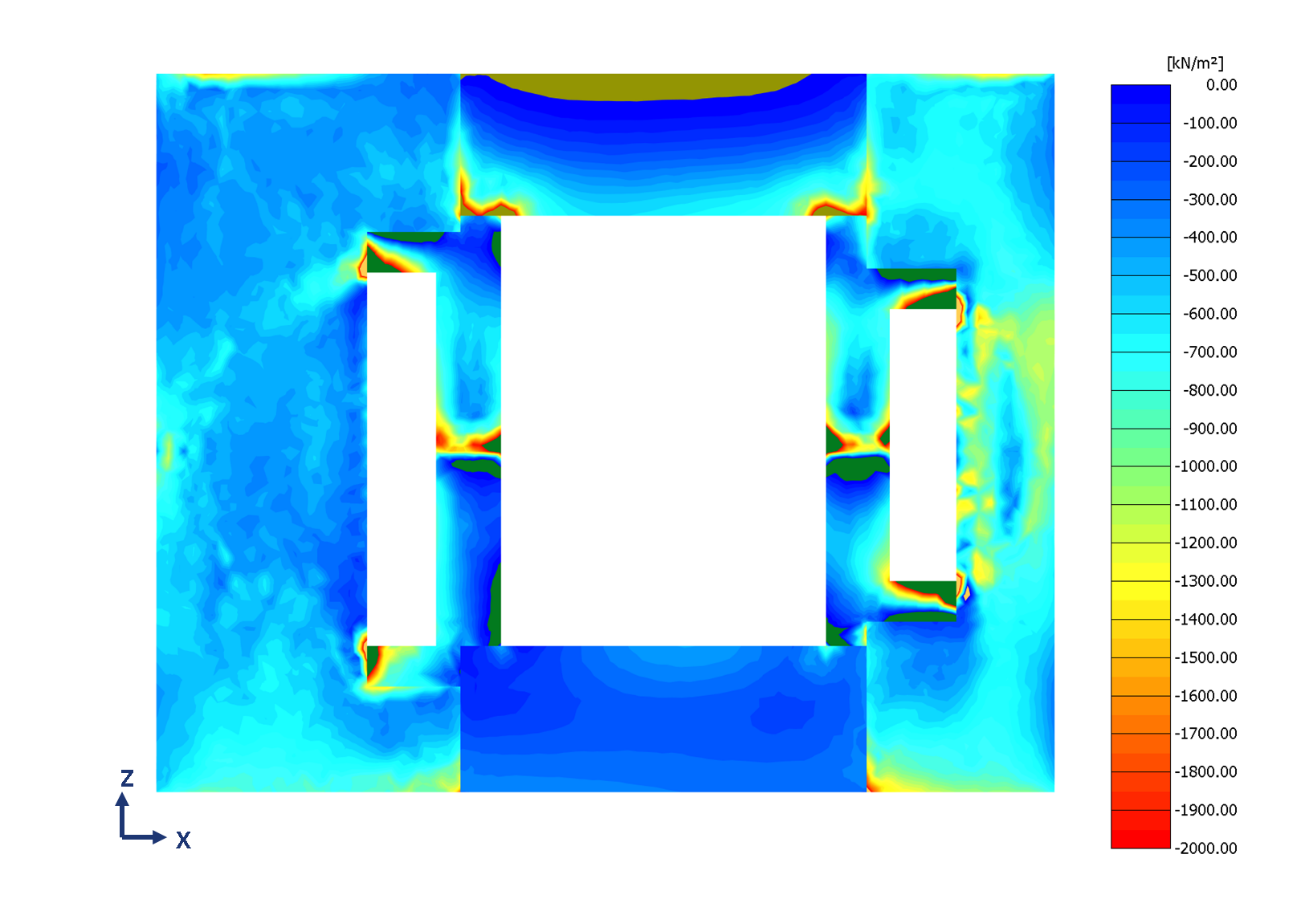
Shaft Opening Design (Model-2)
For the detailed design of the collar structure, the lateral asymmetrical force from the tunnel, following TBM break-out, is obtained from Model-1 and applied as an equivalent uniform pressure on the detailed structural model of the collar structure. The rest of the opening works were then simulated in the structural model. This resulted in a significantly high stress concentration on the ‘Opening Columns’ that required major alteration to the internal structural layout/temporary work requirements, affecting the previous optimal decisions. This was considered a conservative approach, as in reality, the arching effect of the stiff Chalk strata would re-distribute the ‘unbalanced’ lateral pressure more effectively to the stiffer part of the shaft structure. This encouraged the design team to develop a very detailed PLAXIS3D model (Model-2) to accommodate this complex shaft-ground-tunnel interaction situation accommodating the micro-construction stages. The pressure distribution and the associated ‘Opening Column’ forces were obtained at each and every stage of the construction to inform the detailed structural design. Typical normal stress distribution obtained during the critical stage is shown in Figure 13.
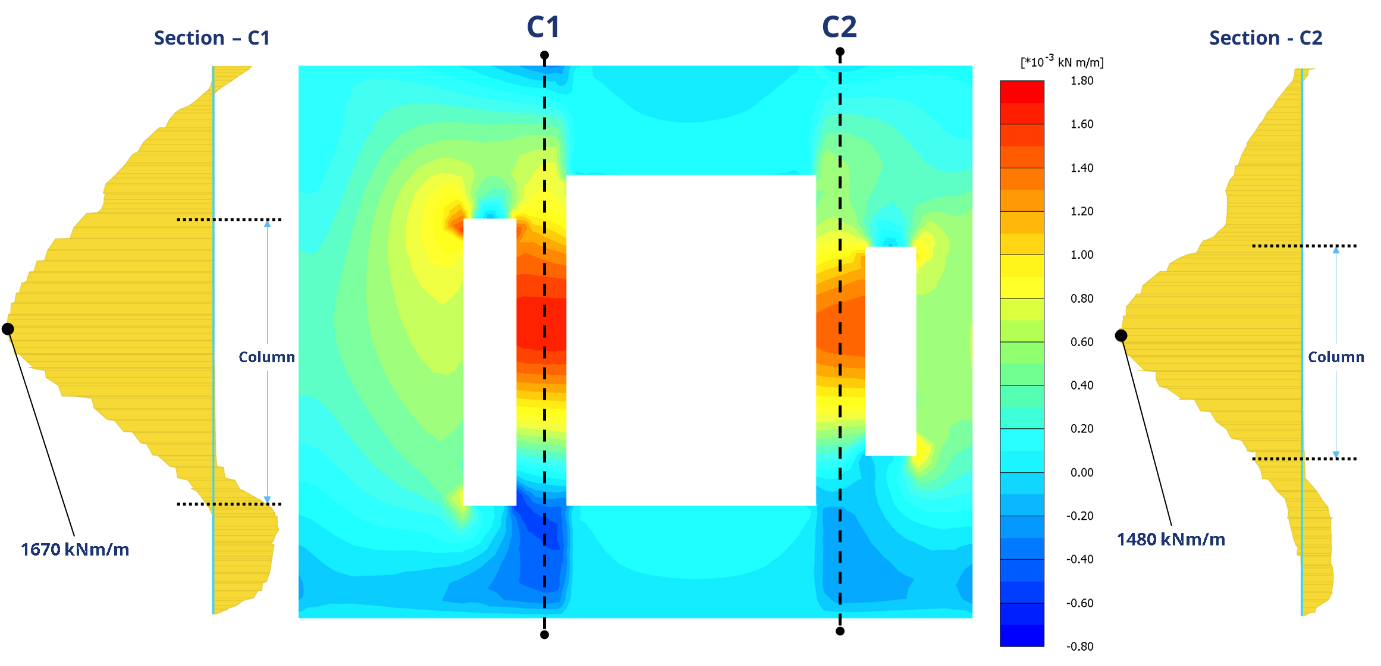
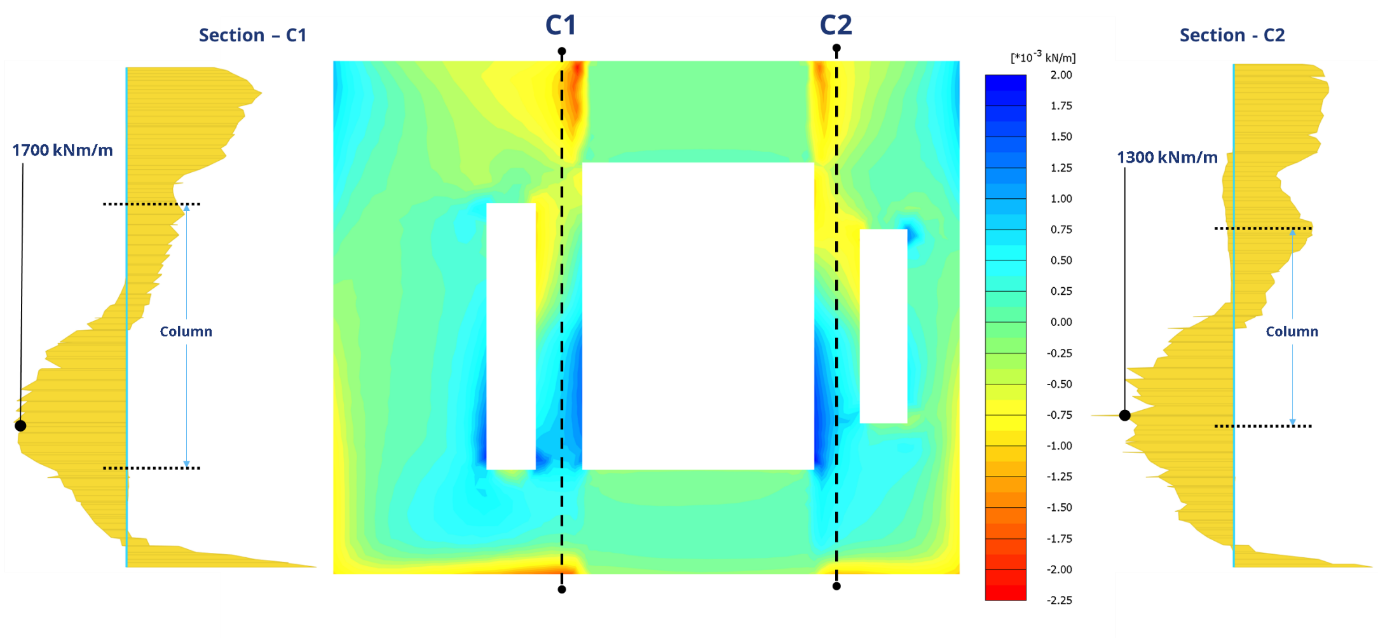
The structural forces on the ‘Openings Columns’ were also obtained from the PLAXIS3D analysis for the detailed design of these columns. The critical bending moments and shear forces on the ‘Opening Columns’ are shown in Figure 14 and Figure 15 respectively. These forces could be accommodated in the structural design without altering the collar structure arrangements.
Verification of PLAXIS3D Results
It was necessary to verify the development and the proper functioning of the PLAXIS3D model to ensure the results are reasonable and explainable. In some cases, the results can be benchmarked against closed form or approximate solutions. The following verifications were carried out:
- The hoop stress in the shaft wall has been checked when the excavation is at formation level using hand calculations and PLAXIS results are found to be 10% lower. This is attributed due to further relaxation of the earth pressure coefficient during the bulk excavation for the shaft construction in the PLAXIS model.
- The tunnel lining forces have been checked using Moller and Vermeer[6] method and the PLAXIS hoop forces and bending moments results are found to be 7% and 11% lower respectively. This can be attributed to additional ground relaxation effect at the tunnelling head area which is modelled in the PLAXIS.
- The hoop force distribution around the ventilation opening has been calculated using Inglis (1913)[4] method (extension of Kirsch’s equation[5] for circular opening) and PLAXIS results are found to be 5% lower both at the opening axis and crown levels.
In addition to the above, the load distribution observed in the PLAXIS model was reviewed in detail to ensure overall load equilibrium is achieved.
Workmanship, instrumentation and monitoring
The design performance of the shaft is critically dependant on forming each of the diaphragm wall panels using compact concrete to the design strength, to resist the high hoop stresses that would be developed. Particular care has been taken to achieve a well-balanced design concrete mix, based on extensive trial mix designs, to provide the required stability and flowability with good quality assurance and control measures. Each of the diaphragm wall panels will be provided with sonic tubes to check the integrity of the panels prior to the commencement of the bulk excavation works.
In addition, several inclinometers will be installed in the selected panels to monitor any unexpected lateral movements as a part of the construction control measures. Several strain gauges will also be installed to measure the hoop stresses in the wall when the excavation reaches the formation level, and this will provide an excellent opportunity to verify the lateral earth pressure coefficient value adopted in the design prior to critical shaft opening works. Strain gauges will also be installed in the collar structure to measure the hoop stresses.
The measurements from these strain gauges will provided very valuable information to the construction industry.
Summary and conclusions
This paper describes how the sophisticated soil-structure interaction modelling has been utilised to achieve an efficient design development for the deepest shaft (67m) serving the Chiltern tunnel.
The shaft wall will be formed using diaphragm wall panels working in hoop compression to resist the ground loading. The design thickness of the diaphragm wall is primarily controlled by the in-situ earth pressure coefficient, verticality of the wall and the grade of the concrete. The diaphragm wall installation process has been modelled in detail using PLAXIS3D finite element program and demonstrated that the wall installation will cause approximately 20% reduction in the lateral earth pressure coefficient from the in-situ K0 value.
The TBM forming the twin bore Chiltern Tunnel will directly cut through the shaft wall to form the openings in the shaft. A collar structure will be constructed to strengthen the shaft wall prior to the TBM break out. Two separate PLAXIS3D models have been developed to model the shaft-ground-tunnel interaction effects by modelling the detailed sequence of construction, one to understand the overall impact on the diaphragm walls due to the opening and the other model in order to obtain the design forces on the critical elements of the collar structure to inform the structural detailed design.
Based on the above modelling work, the design concludes that 1200mm thick diaphragm walls formed using Grade 50/60 concrete constructed to a maximum verticality tolerance of 1:400 is adequate for the shaft.
The paper emphasises the importance of forming each of the diaphragm wall panels using compact sound concrete using a suitable design concrete mix and the need to verify the workmanship on site by appropriate testing, instrumentation and monitoring during the shaft construction. Strain gauges are also specified at critical locations in the diaphragm wall and in the collar structure to monitor the hoop stresses and thereby giving an opportunity to verify the design assumptions, in particular the in-situ earth pressure coefficient, prior to the critical TBM break-out operation. The data from these monitoring works will provide very valuable information to the construction industry considering the dearth of field data with deep shafts in Chalk strata.
References
- Engineering in Chalk. Lord, J.A, Clayton,C.R, Mortimore R.N,London. CIRIA C574 (2002).
- Guidance on embedded retaining wall design. CIRIA C760 (2017).
- Hayward, T (2000) Field studies, analysis and numerical modelling of retaining walls embedded in weak rock, PhD thesis, University of Southampton, Southampton, UK.
- Inglis, C. E, (1913). Stress in a plate due to the presence of cracks and sharp corners.
- Kirsch, (1898), Die Theorie der Elastizität und die Bedürfnisse der Festigkeitslehre. Zeitschrift des Vereines deutscher Ingenieure, 42, 797–807.
- Moller, S.C, and Vermeer, P.A, (2005). Prediction of settlements and structural forces in linings due to tunnelling. In Proceedings of the 5th International Symposium on Geotechnical Aspects of Underground Construction in Soft Ground, Amsterdam, The Netherlands, pages 621-621.
- PLAXIS 3D manual CONNECT Edition V20.03 – June 01, 2020. Bentley.
- Richards, D J, Clayton, C R I, Powrie, W and Hayward, T (2004) “Geotechnical analysis of a retaining wall in weak rock” Proceedings of the ICE – geotechnical engineering, vol 157, 1, Institution of Civil Engineers, London, pp 13–26.
- Schwamb T et al, (2014), Fibre optic monitoring of a deep circular excavation, Geotechnical Engineering, Vol 167.
- Twine, D and Wright, R H (1991).Deep Foundations Conf, Stresa. AA Balkema, Rotterdam, pp 147–155.
- Warren, C. D (2018), Geology and geotechnics of the HS1 North Downs tunnel.
Notation
AONB Area of Outstanding Natural Beauty
c’ Effective Cohesion
C1 Contract 1
CR Structured Competent Chalk
CRS Structured Weathered Chalk
CS7 Structureless Chalk (Medium dense to dense Granular)
CS8 Structureless Chalk (Very loose to Medium dense Granular)
CS9 Structureless Chalk (Firm to Stiff Cohesive)
CS10 Structureless Chalk (Very soft to Firm Cohesive)
ϕ’ Effective angle of shear resistance
E’ Effective Young’s Modulus
GI Ground Investigation
yBulk unit weight
HPD High Pressure Dilatometer
K Earth pressure coefficient
K0 Lateral earth pressure coefficient at rest
mBGL Metres Below Ground Level
mAOD Metres Above Ordinance Datum
MWCC Main Works Civil Contractor
RC Reinforced Concrete
SCL Sprayed Concrete Lining
SD Superficial Deposits
SSI Soil Structure Interaction
σh’ Horizontal effective stress
σv’ Vertical effective stress
TBM Tunnel Boring Machine
ULS Ultimate Limit State
VL Volume Loss
v’Poisson’s ratio
WIP Wished-in-place
Peer review
- Colin Rawlings, Lead Tunnel EngineerHS2 Ltd