Development of practical approaches to predicting flow-induced sound from termination devices in large-scale railway tunnel ventilation systems
Railway tunnel ventilation systems present particular problems for predictions of sound emissions, including the relatively high volumetric flow rates, and a lack of well-established models and empirical data. An investigation was undertaken to support the acoustical design of tunnel ventilation systems on the UK High Speed Two (HS2) project, in view of the project environmental commitments and noise constraints. This was aimed at developing practical prediction models for the flow-induced sound generated by two types of termination device: (i) mesh grilles, and (ii) air curtains. Existing literature was reviewed to identify potential prediction models or approaches. The information obtained from the review was used to develop practical models, validated using available empirical data, including over a relatively wide range of flow velocities.
It is hoped that the learning legacy of this work includes an understanding of some key aspects of the acoustics involved in flow-generated sound from ducted ventilation system termination devices for railway and industrial applications, together with relatively simple and practical approaches to predicting their sound emissions.
Background and industry context
Ventilation systems serving railway tunnels provide vital air refreshment and temperature control during normal use, as well as fume or smoke extraction in emergency situations. They differ from typical building ventilation services insofar as they are typically of a considerably larger scale, to accommodate the large volumes of air movement, and may operate at higher air flow velocities than might be encountered in other types of system.
Ventilation systems generally require atmospheric terminations, to allow air to enter or leave the system. Atmospheric terminations are often covered with a form of grille, which acts to prevent solid agents from entering the system, which could otherwise cause damage. From the perspective of control of ventilation sound emissions, the termination device may present particular difficulties, because, by obstructing the flow, the ensuing turbulence inevitably causes sound to be generated. To maintain the required system ventilation performance, protection provided at atmospheric terminations must maintain an acceptable pressure loss, which requires sufficient open area. Mesh grilles are one way to provide system protection while maintaining an acceptable pressure loss.
Flow-generated sound caused by contractions or obstructions in the flow is typically dipolar or quadrupolar, with energy that scales exponentially with flow velocity (1). Accordingly, the relatively high flow velocities associated with a tunnel ventilation system make atmospheric terminations a key system element contributing to the total sound emission into the external environment. Furthermore, since, this occurs at the final point in the system ‘chain’ before propagation into the external environment, there is no opportunity to attenuate this flow-generated sound downstream using typical in-duct measures such as sound attenuators. This means that reliable estimates of the flow-generated sound power of the termination are important, since the emitted sound energy could then contribute to adverse environmental impact at noise-sensitive locations.
Air curtains are commonly used to achieve a thermal separation between different ventilation zones. These comprise a rectangular nozzle with a high aspect ratio, which emits a narrow, planar air jet. The nozzle is connected to the duct system via a transition piece with a rapid gradient of change in cross-section, as shown in the illustrative diagram (Figure 1). A railway tunnel application of this technology is likely to differ from commercial air curtains (used over entranceways) in scale but also insofar as the fan is connected to the air curtain via a duct, rather than as an integrated unit. This offers the opportunity to attenuate the fan sound within the duct system, but not the flow-generated sound emanating from the termination nozzle.
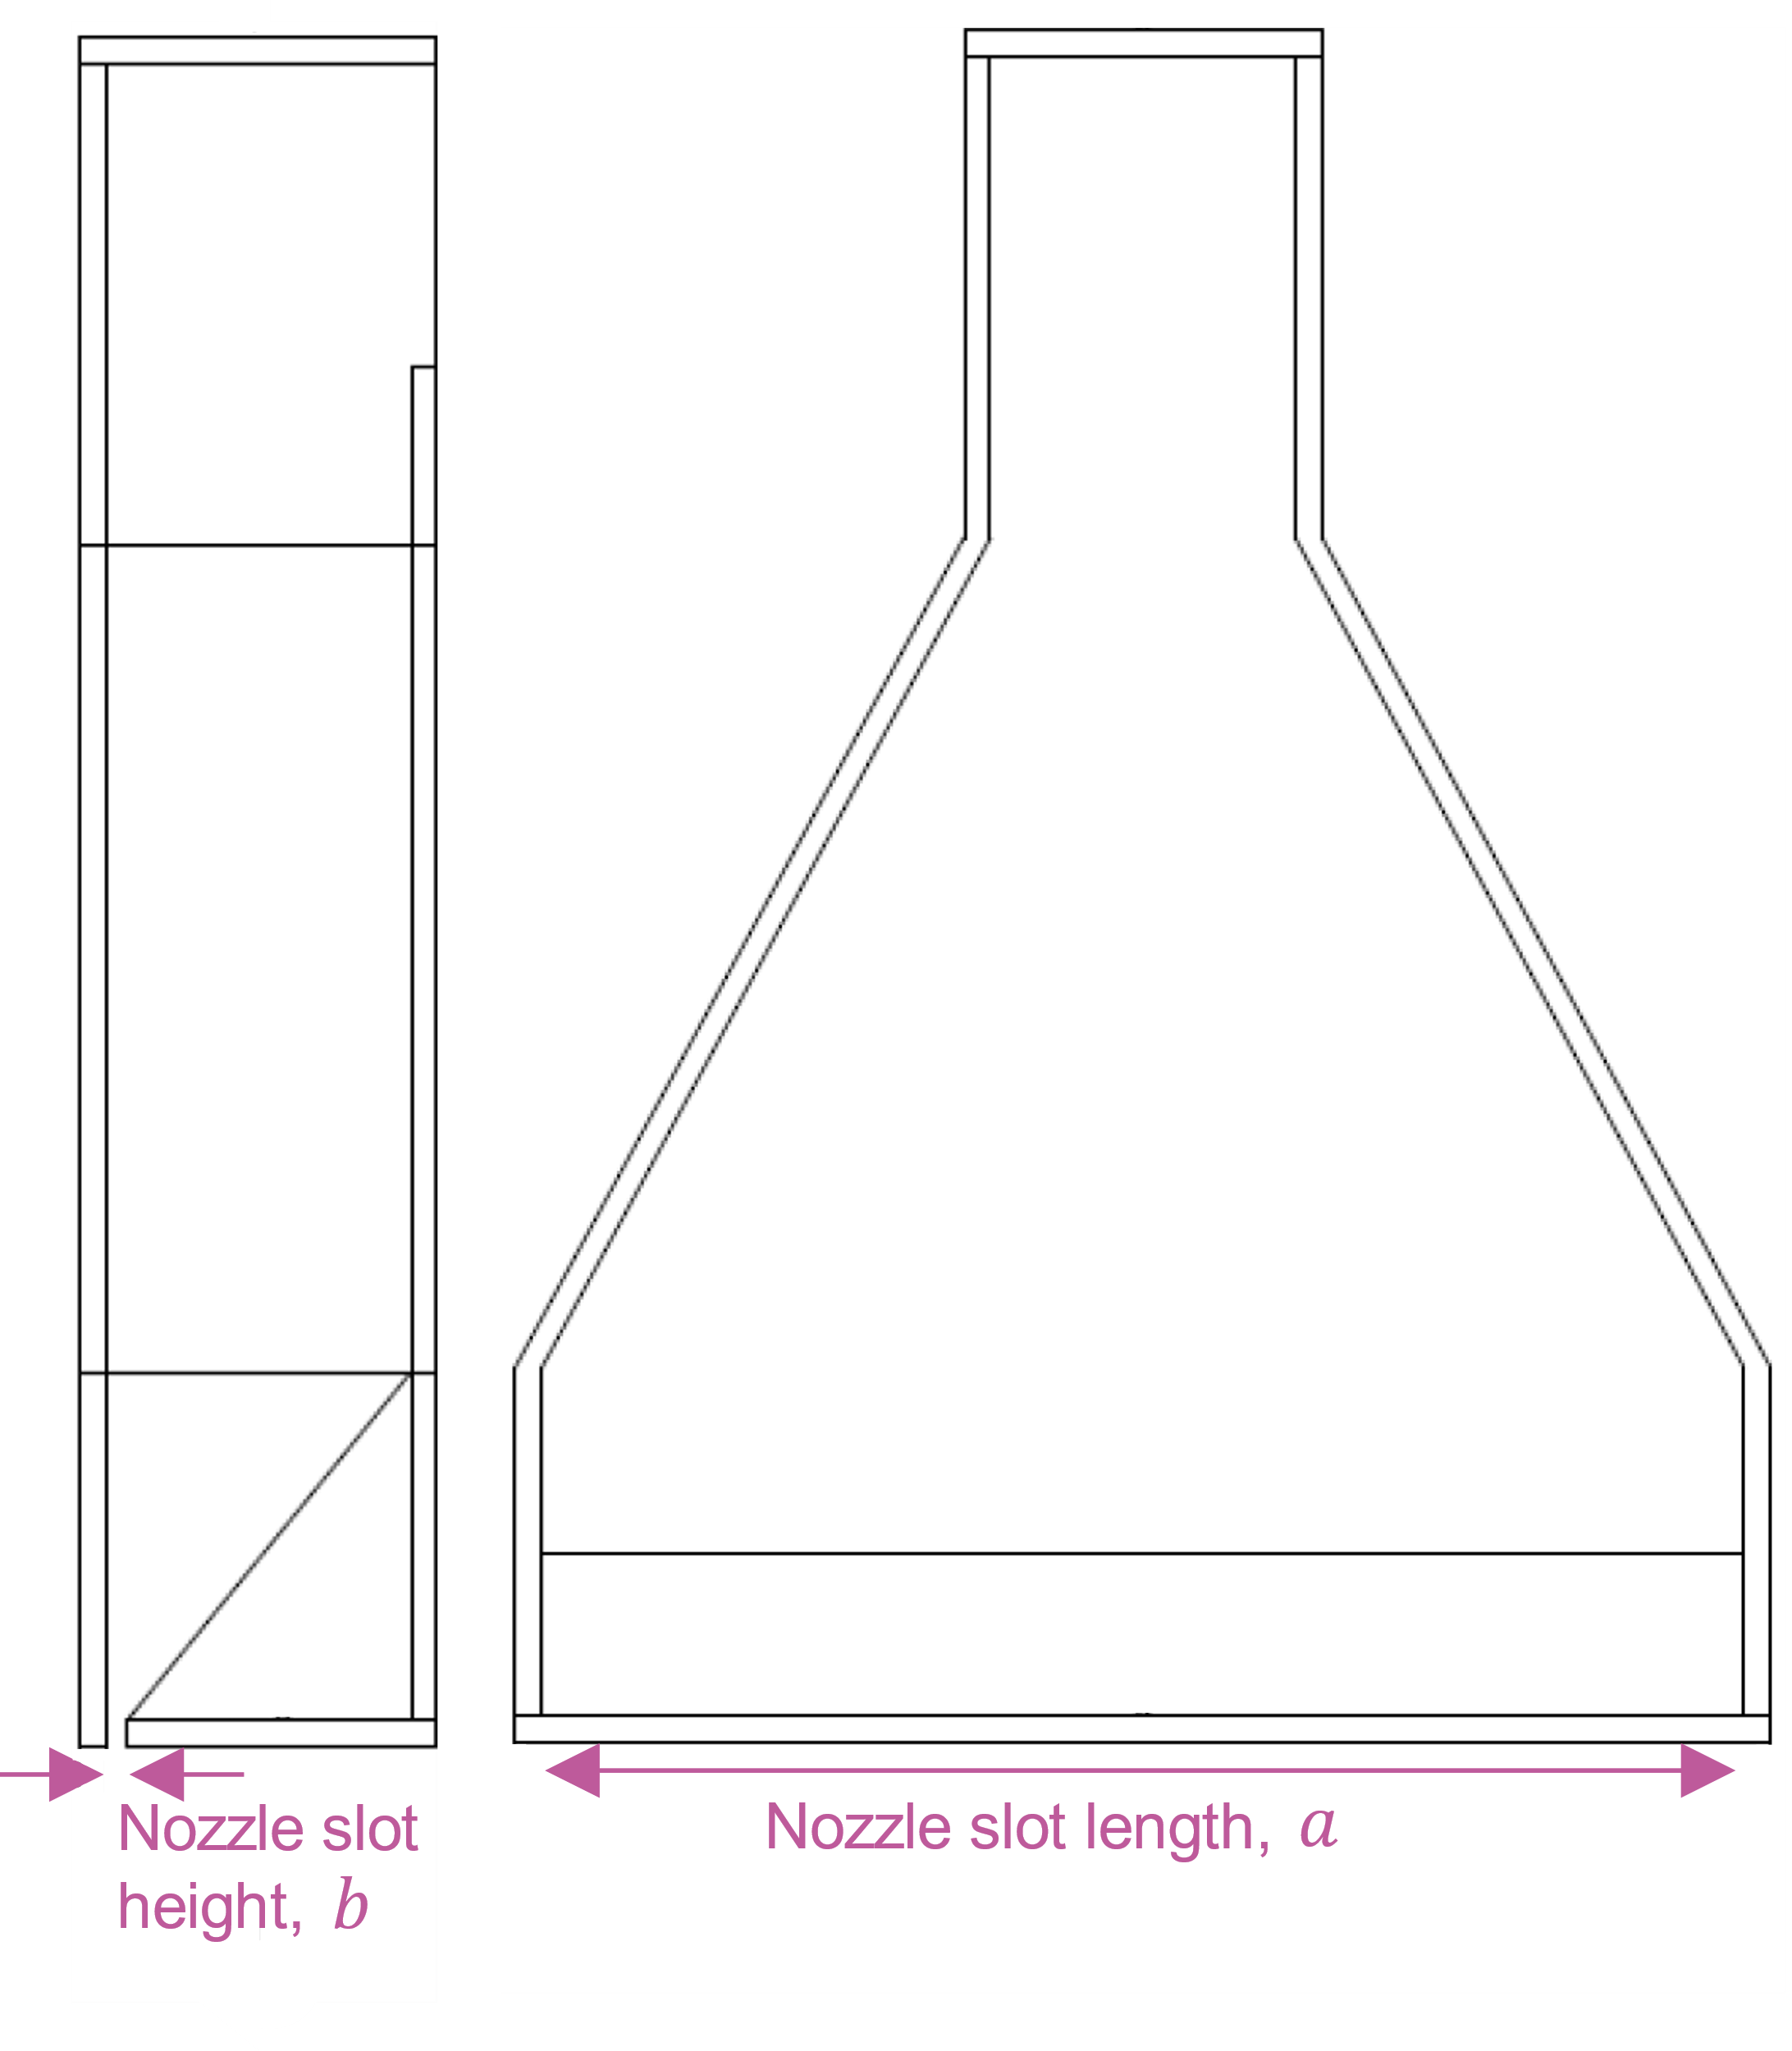
As part the acoustic design development of the High Speed Two (HS2) tunnel ventilation systems, predictions and analysis were undertaken to evaluate potential risk associated with system flow-generated sound, in view of the project environmental commitments and noise constraints.
Widely-used engineering codes of practice governing predictions of ducted ventilation plant sound sources include CIBSE Guide B4 (2), and the ASHRAE handbook (3), the latter of which declines to offer any prediction method for flow-generated sound of termination devices. Guidance on flow-generated sound predictions within the CIBSE Guide B4 comprises Appendix 4.A2, the two parts of which address ‘bends, takeoffs, transitions’, and ‘duct terminations’, respectively. The CIBSE guidance is focussed primarily on indoor applications, and ‘room diffuser’ type terminations; its wider applicability to atmospheric terminations comprising mesh grilles, especially large-scale systems operating at relatively high flow velocities, were uncertain. Similarly, the CIBSE guidance does not specifically address air curtain termination devices, and these elements also represented an uncertainty in the design risk evaluation.
Approach
To address the potential risk, archive empirical data were obtained for tests of mesh grille flow-generated sound at relatively high system velocities (4). These test data were available for three grille designs, including two types of metal circular-strut mesh, and a plastic ‘eggcrate’ design grid (see Supporting Materials Table 2 and Table 3 device references A, B and C — additional test data were subsequently incorporated, as discussed below).
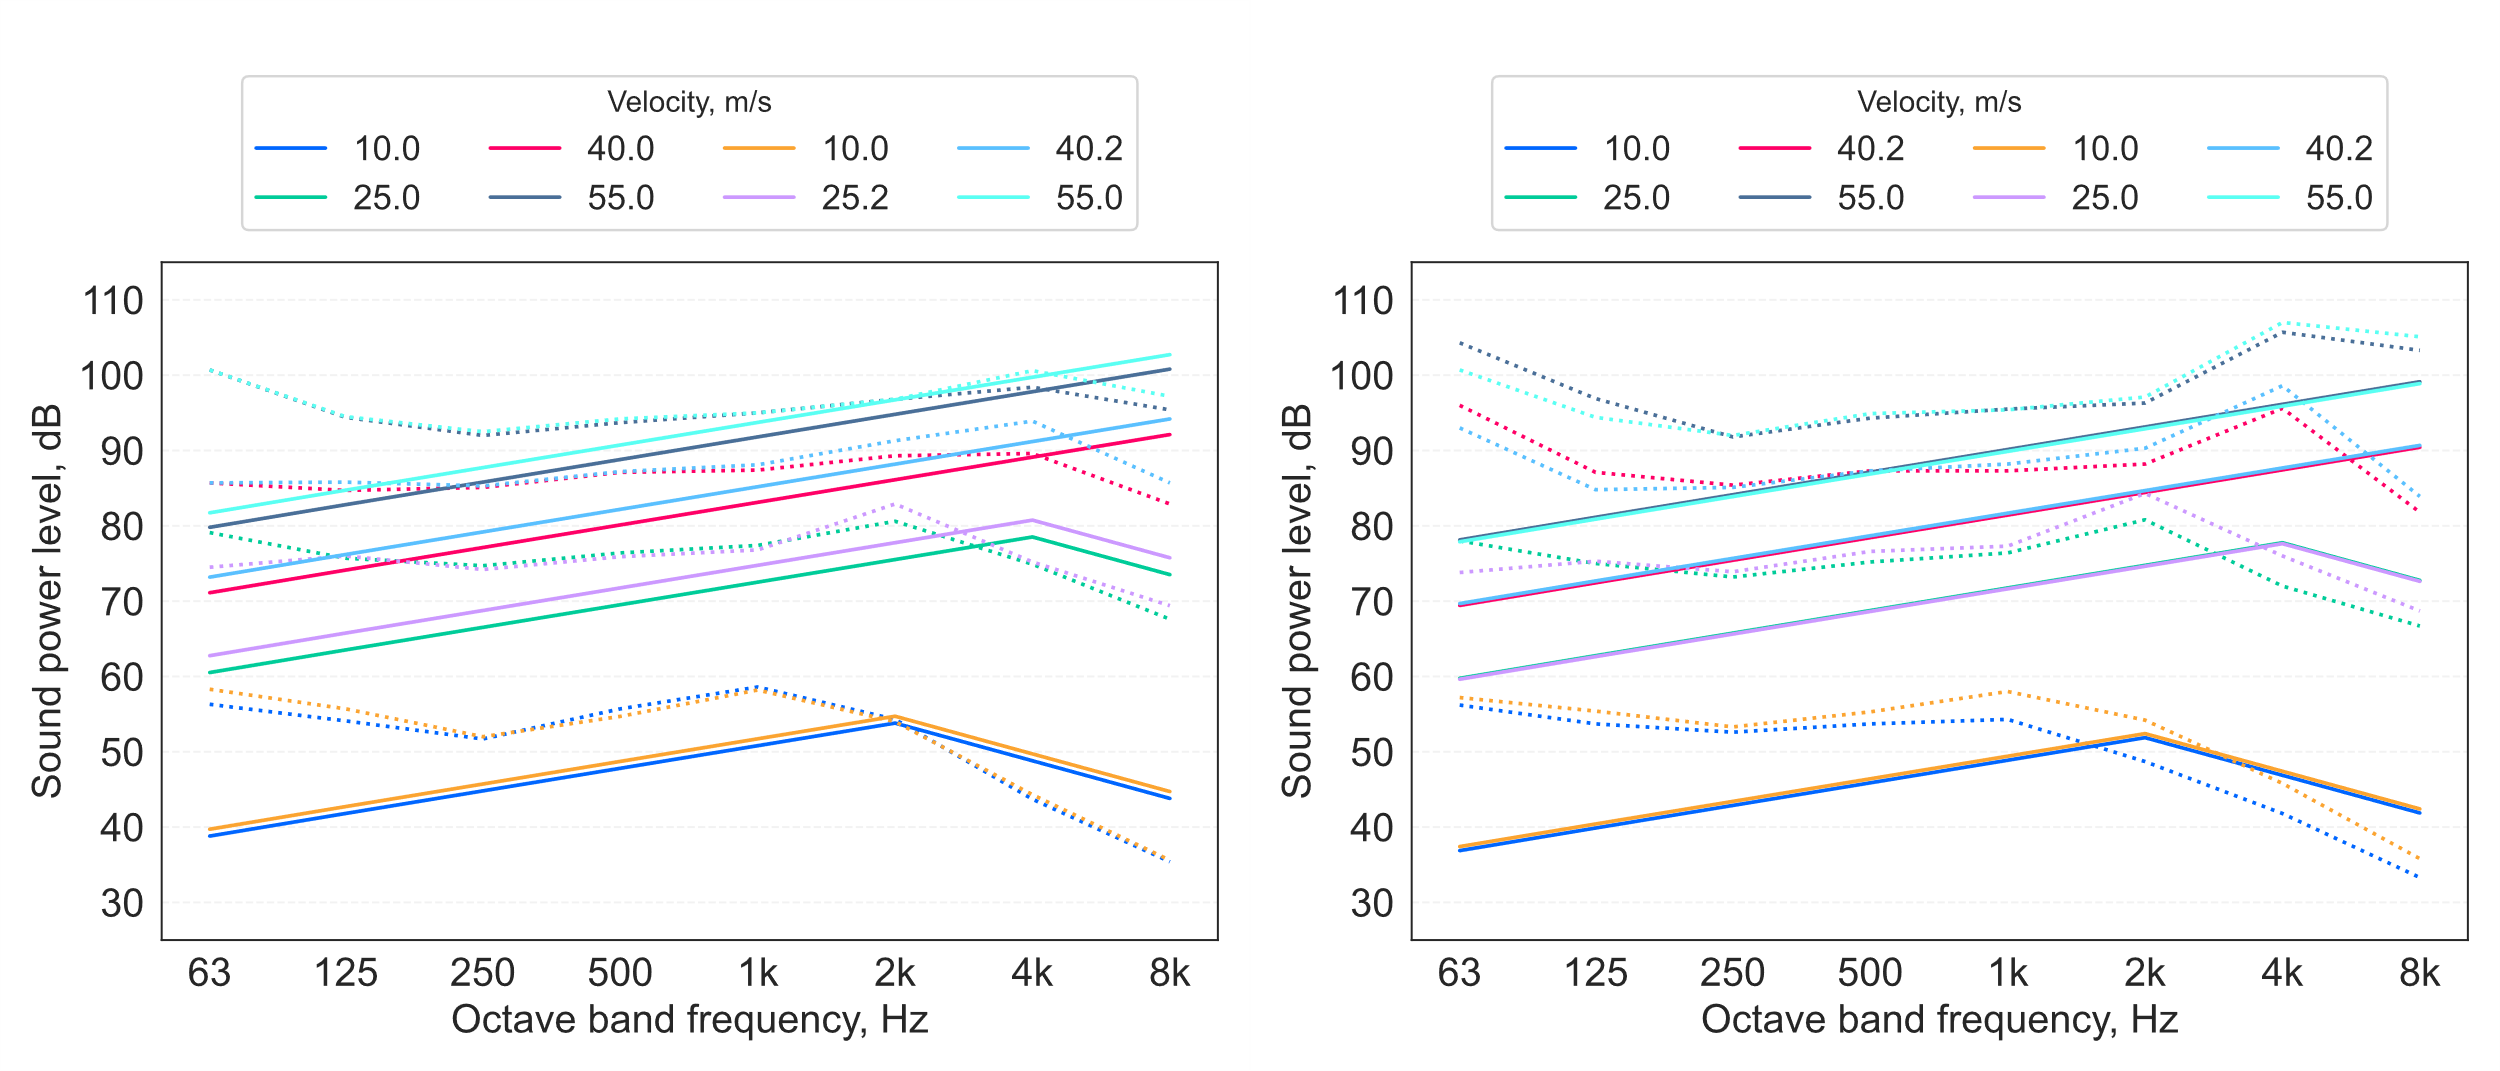
Initial predictions were made for the tested grilles using the CIBSE Guide B4 Appendix 4.A2 approach, which did not agree closely with the test data (see Figure 2). In particular, the spectral peak band appeared to be mis-estimated, and the steady, uniform attenuation at low frequencies did not well-characterise the observed measurement values, which exhibit increases in energy in the lowest octave bands. Consequently, an investigation was undertaken to interrogate the basis for the model, and to identify potential alternative approaches, with a view to recommending a suitable model for making validated predictions.
For air curtains, useful archive test data were not readily available, so consideration was based on reviewing available literature for evidence on the expected sound emissions, and potential estimation approaches. The objective of this work was to establish a reasonable worst-case approach for initial estimation of potential sound emissions, to inform risk evaluation. In the discussion that follows, indicative air curtain design parameters should be kept in mind, primarily the relatively low Mach number () value ~0.1 and the nozzle aspect ratio ~90.
Review: Grilles
The CIBSE Guide B4 clearly distinguishes between flow-impeding elements that reside ‘in-duct’ and those that form the duct termination (2). For the latter, an estimation method is presented in the CIBSE Guide B4 Appendix 4.A2.2, developed using a simplification of an approach based on empirical data for room diffuser elements, as derived from two given source references (5,6). Consideration of the original publications indicates they are both rooted in the method outlined by Heller & Franken (7), which itself is based on the empirical approach set out in a doctoral thesis by Hubert (8) (a student of Professor Lothar Cremer). Hubert undertook tests of a range of termination devices and elements, including integrated room diffusers, and more elemental gratings, perforated plates and mesh grilles, investigating the effects of the various components, forms and designs on flow-generated sound (8). The approach presented by Heller & Franken (7) is based primarily on the measurements made by Hubert on room diffusers (8), which were generally observed to exhibit a broadband sound power spectrum characterised in a simplified way by a ‘haystack’ curve rising to a gentle peak at a frequency band determined by the flow velocity upstream of the diffuser. The overall sound power was found to be related to the product of the termination area (ie, the duct interior cross-sectional area), the 6th power of the upstream flow velocity , and the 3rd power of the pressure loss coefficient (defined below). The CIBSE Guide B4 method represents a further simplification of these observations.
The predictions made using the CIBSE Guide B4 approach for the tested mesh grilles can be seen to result in spectral peaks that rise in frequency with flow velocity (Figure 2). This is also evident in the test data, but with peaks occurring in different frequency bands to the predictions. A further distinction is that the measured low-frequency spectra do not exhibit the attenuation predicted by the model. Possible reasons for these discrepancies can be identified in available literature.
As recounted by Hubert (8), and discussed by Wood (9), flow obstructions can cause several types of periodic sound generation phenomena, including, ‘edge tones’, ‘jet tones’, and so-called ‘aeolian tones’. Edge tones are generated when flow encounters a sharp obstructive edge, splitting the flow and causing vortex generation that results in periodic pressure fluctuations. Jet tones are caused by contractions in the flow such as may occur with perforations and small flow outlets. Aeolian tones are similar to edge tones, but occur with a streamlined flow obstruction, such as a circular strut, which creates what is known as a ‘von Kármán vortex street’, a series of alternating vortices in the wake of the obstruction, again resulting in periodic sound generation (see Figure 3)[1].

ludin[2] (10) and Hubert (8) noted that the tone frequency fpk of this phenomenon is determined simply by the Strouhal number , a dimensionless quantity relating the upstream flow velocity U and the obstruction size d (the width of the obstruction perpendicular to the flow, ie, the cylinder diameter):

The Strouhal number for the aeolian tone generated by a cylindrical body has been estimated empirically as ~0.2 — this value is noted by Heller & Franken (7), who acknowledge that specific elements such as rods and perforations in terminations can generate tonal energy[3]. In discussing Strouhal’s original work, Rayleigh (11) advises that the aeolian tone Strouhal number is related to the kinematic viscosity of air (appearing within the Reynolds number, Re ), and, based on empirical investigations, can be estimated using:

Equation 2 depends on the absolute temperature (in Kelvins) and density p of air, with which the kinematic viscosity of air is estimated using the so-called ‘Sutherland formula’ (12), with empirical constants taken from Hilsenrath et al (13).
The spectral peak at St~0.2 is also identified in the work of Gordon (14,15), and Heller et al (16,17), who undertook empirical testing of in-duct flow spoilers while at Bolt Beranek Newman consulting engineers, and of whose work Hubert was also aware (8).
Graham & Faulkner (18) proposed a model for grille flow-generated sound that attempted to generalise the information as presented by Heller & Franken (7), and incorporated the addition of terms for non-cylindrical struts. Examination of the Graham & Faulkner model (18) reveals that the terms for non-cylindrical struts were based on a simplification of the in-duct flow spoiler information in Heller & Franken (7), and disregarded the distinction made therein between the upstream flow velocity (U) and the constriction flow velocity Uc which is defined as:

The term ζ in Equation 3 is the pressure loss coefficient, which is related to the pressure drop ΔP introduced by the flow obstruction as:

This work on Strouhal number-dependent aeolian tonal energy provides a possible explanation for the observed divergence between the test data and the predictions made using the CIBSE Guide B4 model, which assumes a spectral peak that is dependent only on the flow velocity, and is not explicitly related to the dimensions of mesh grille elements.
Another interesting aspect of the information reported by Hubert is the tests investigating variation in the incident flow turbulence (8). These indicated an effect on the low-frequency portion of the spectrum, which was accentuated with increasing turbulence. It can be expected that turbulence in the test systems would be likely to increase with increasing flow velocity, which may explain the increased low-frequency energy observed when compared with the CIBSE Guide B4 model predictions in Figure 2.
Another branch of the literature on flow-generated sound from ducted system elements is found in the research underpinning the other part of the CIBSE Guide B4 Appendix 4.A2 (4.A2.1), which concerns in-duct elements including bends, branches and transitions. For these elements, the CIBSE Guide B4 approach has its basis in the analytical approach of Nelson & Morfey (19,20) [which also adopted assumptions founded in the empirical work of Gordon (14,15) and Heller & Widnall (17)], developed from Nelson’s doctoral thesis (21) under the supervision of Professor Philip Doak. This approach was developed further by Oldham & Ukpoho (22) [also inspired by the work of Iudin (10)], and then subsequently by Waddington & Oldham (23,24,25,26,27), which resulted in formulae effecting an impressive ‘collapse’ of the sound power spectra from the various elements towards a single parametric relationship. These formulae were later simplified for adoption in the CIBSE Guide B4 Appendix 4.A2.1. A key aspect of this branch of the literature is its emphasis on the duct ‘cut-on’ frequency as a ‘pivot point’ in the spectral emissions of flow-generated sound from in-duct obstructions. In general, the duct cut-on frequency defines the spectral division between the frequency (or wavenumber) range in which transverse acoustic modes are able to propagate along the duct (above cut-on), and the converse range (below cut-on) in which only planar modes propagate — in these models, different formulae are used for the frequency bands falling above and below the cut-on frequency, to represent these differences in sound wave modal behaviour. The duct cut-on frequency fco is defined for rectangular cross-section ducts as:

where c is the sound speed in air, and ly is the largest cross-sectional dimension. For circular cross-section ducts of diameter d, fco is defined by:

in which Ψ1,1 is the 1st root of the derivative of the 1st-order cylindrical Bessel function of the first kind, J’1 (~1.84).
From the same essential theoretical basis as these models, Kårekull et al developed the ‘momentum flux’ model, while also extending the concept to termination devices (28,29,30) — this development links this branch of the research back to the purpose of the present study concerning atmospheric grille terminations. It is noteworthy, however, that the measurements of termination devices used by Kårekull (29) to validate the momentum flux model included only (interior) room diffuser elements, rather than (exterior) mesh grilles, the latter of which are of greater interest in the present study.
Review: Air curtains
Air curtains emit a narrow, high-velocity stream resembling a subsonic (low Ma ) jet[4], which causes turbulent eddies in the mixing region of the jet flow and the surrounding ambient fluid. Lighthill’s ‘eighth power scaling law’ (31,32), as applicable for circular cross-section jet nozzles, can be expressed as (33,34,35,36):

in which W is the total acoustic power, and are the jet gas density and absolute temperature (Kelvins), respectively, is the jet flow velocity at the nozzle[5], is a ‘length scale’ (which is set equal to the nozzle diameter for a circular cross-section jet), is an ‘acoustic power coefficient’, which, in general, has slight dependencies on and on (33), but is often treated as constant.
The jet mechanical power Wm is determined from the kinetic energy relation (35):

in which is the jet mass flow rate (kgs-1).
The acoustic power is related to the mechanical power by the acoustic transduction efficiency (ie, the ratio of acoustic to kinetic energy) as:

An expression η for is provided by Bies et al (36) [citing Heitner (37)] as:

which is bounded to an upper limit of η≤0.01. .
Proposed values for the acoustic power coefficient K (for circular nozzle jets) vary in the literature: Bies et al (36) adopt the value 5 × 10⁻⁵, which corresponds with the “average value” considered by Lighthill (32) as representative based on a “rough integration” over a limited number of cases. The measurement data reported by Fitzpatrick & Lee (33) equate (making use of Equation 10) to values of ~1.7 × 10⁻⁴ to ~2.9 × 10⁻⁴, averaging to ~2 × 10⁻⁴.
The source mechanism to which Equation 7 relates generates sound as a quadrupole source. As well as providing a useful historical overview, Powell (38) highlighted the varying power scaling relationships for theoretical sources, with monopoles scaling with U4 , dipoles with U6, and quadrupoles with U8, and shows that, since the mechanical part of the power scales with a constant velocity exponent of 3, the respective acoustic efficiency for each source type scales proportionately to Ma, Ma3 and Ma5. For low Mach numbers ( Ma< 0.3), Graham & Faulkner (18) suggest an η value of 8 × 10⁻⁵ ×Ma3, , which indicates an assumption of dipole source dominance at low Ma. It is notable that, compared with the aforementioned K values presented by Lighthill (32), Bies et al (36) and Fitzpatrick & Lee (33), the acoustic efficiency suggested by Graham & Faulkner (18) is equivalent to a sound power increase of ~30 dB compared with these other references, for the Ma value relevant to the air curtain parameters (all other aspects being equal) — it is also a similar magnitude greater than would be obtained using η determined according to Baumann & Coney (39).
Fisher & Morfey (34) noted that experimental and theoretical analysis has also demonstrated a dipole source term emerging for jets under conditions of large temperature ratios between the jet and ambient gas, scaling with Uj3 Ma3— this phenomenon is not expected to be of great importance in relation to air curtains, provided the jet temperature is not very different to the ambient environment[6].
Source directionality is highlighted by Fisher & Morfey (34) and by Powell (38) as an important consideration in determining jet sound emissions; convective Doppler factors are involved in characterising the intensity with respect to emission angle, and these also vary depending on the dominance of each source type in the emissions. In particular, the so-called ‘cone of silence’ phenomenon occurs directly downstream of the jet, within which a range of wavenumbers produce evanescent waves with exponential energy decay, and no far-field radiation. The strength of directionality for jet sound emission has been observed to diminish at low Mach numbers, which, combined with the situation for a source emitting into a highly reverberant environment such as a railway tunnel, indicates that the directional behaviour could be considered of somewhat reduced importance in the air curtain application.
Experimental research for NASA presented by Ahuja et al (40) showed test results for rectangular jets for velocities of ~200–335 ms-1 (approx. Mach number range ~0.6–1.0), and aspect ratios of ~26–120. They identified that the Lighthill scaling law is still applicable for high aspect ratio nozzles (HARNs), but proposed the original length scale applicable to circular jets (dependent on the nozzle diameter) be replaced with an equivalent length scale term dependent on the area and aspect ratio of the nozzle.
Oerlemans & de Bruin (41) also investigated HARNs experimentally, finding that for small values, the eighth power scaling law did not show as good agreement as a fifth power scaling (of velocity), combined with an equivalent length scale term dependent only on the nozzle slot height b (removing the dependence on aspect ratio). Oerlemans & de Bruin (41) suggested that these observations may be due to a nozzle ‘slot edge’ noise mechanism dominating the total power (over the mixing region mechanism), explained by the relatively low Mach numbers and the high slot aspect ratio.
Experimental work on HARNs by Henrywood et al (42) also suggested a smaller velocity exponent scaling value, obtaining a good measurement data collapse using raised to a variable exponent in the approximate range of 6–7, which was found to be dependent on the nozzle aspect ratio. Scaling with the slot height was observed to follow an exponent of 2.4. Further associated work reported by Kanjere et al (43) suggested a velocity exponent of 7 and slot height exponent of 3 to achieve data collapse. Kanjere et al (43) also note that, based on the results of their own work and that of previous studies, the velocity scaling exponent is likely to depend on the nozzle aspect ratio, with lower values of aspect ratio trending towards the Lighthill exponent for a circular jet.
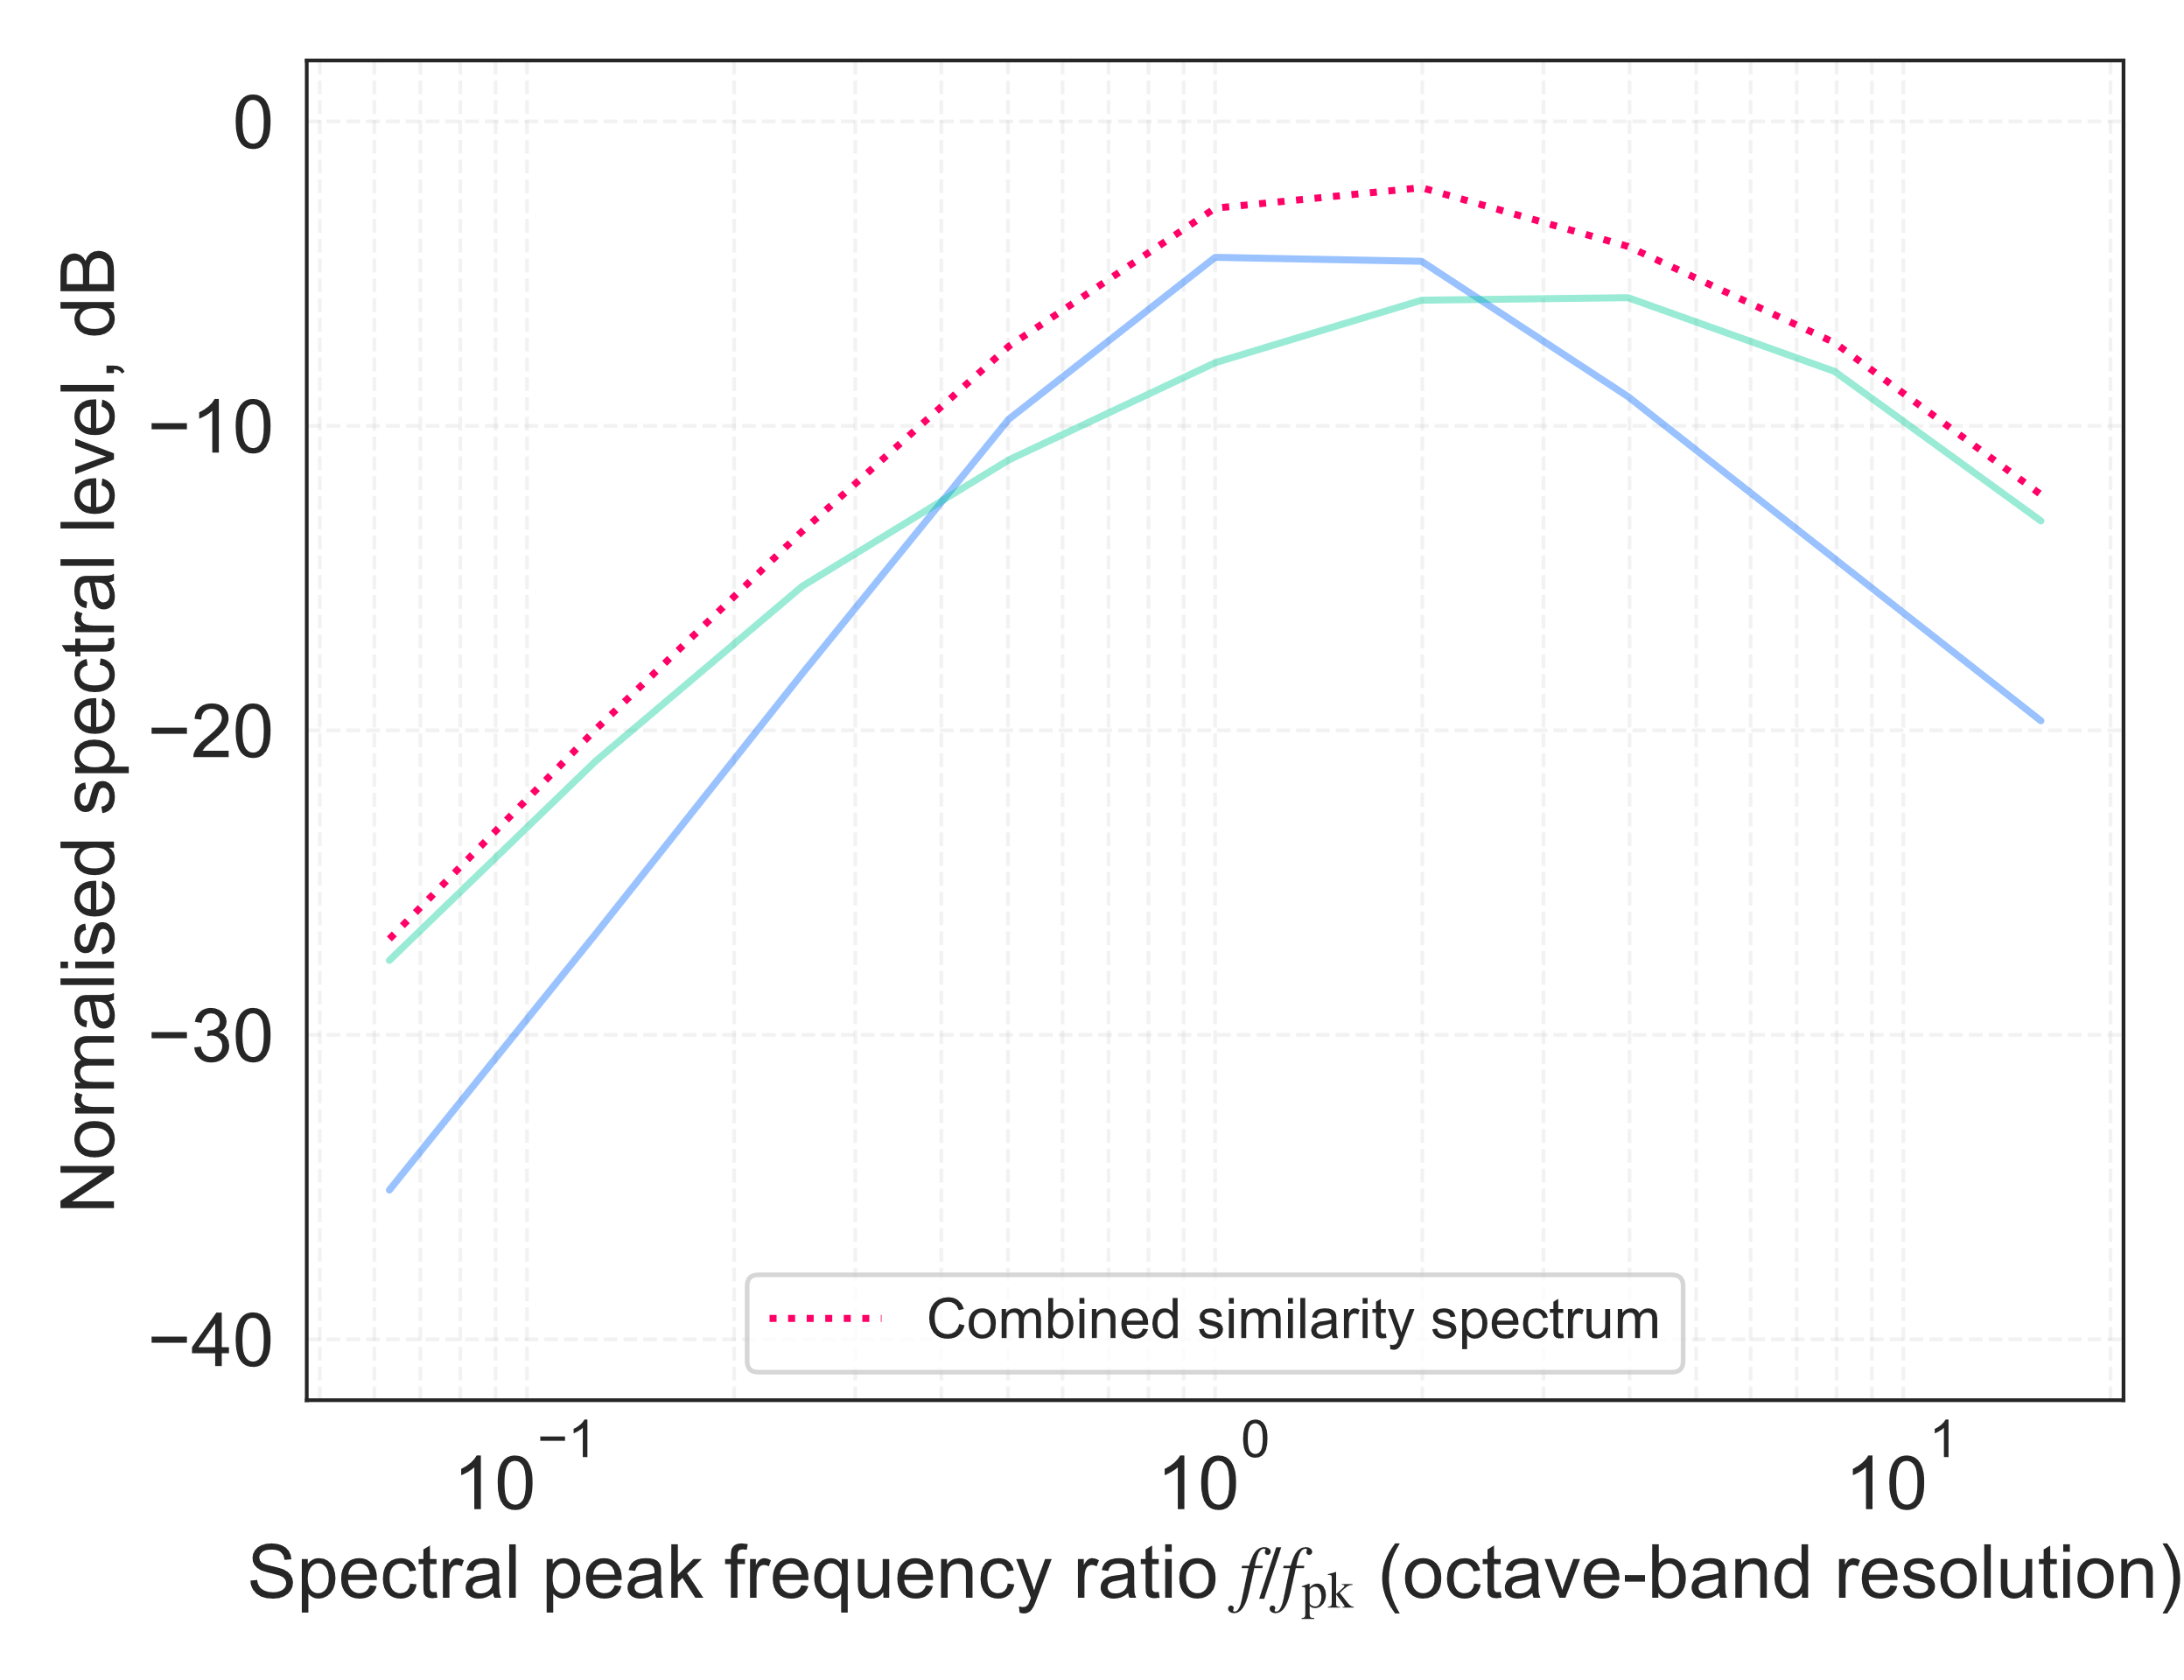
As well as total power scaling factors, expected sound spectra for gas jets can also be identified in the literature. An early representation is provided by von Gierke (44), based on measurements of turbojet engines and model jets. More recently, extensive jet sound measurement dataset analyses by Tam et al (45,46,47) identified two components of the jet mixing region sound generation, separated into ‘fine-scale’ and ‘large-scale’ turbulence, with respective ‘similarity spectra’ representing the expected characteristics of each phenomenon, as shown in Figure 4[7].
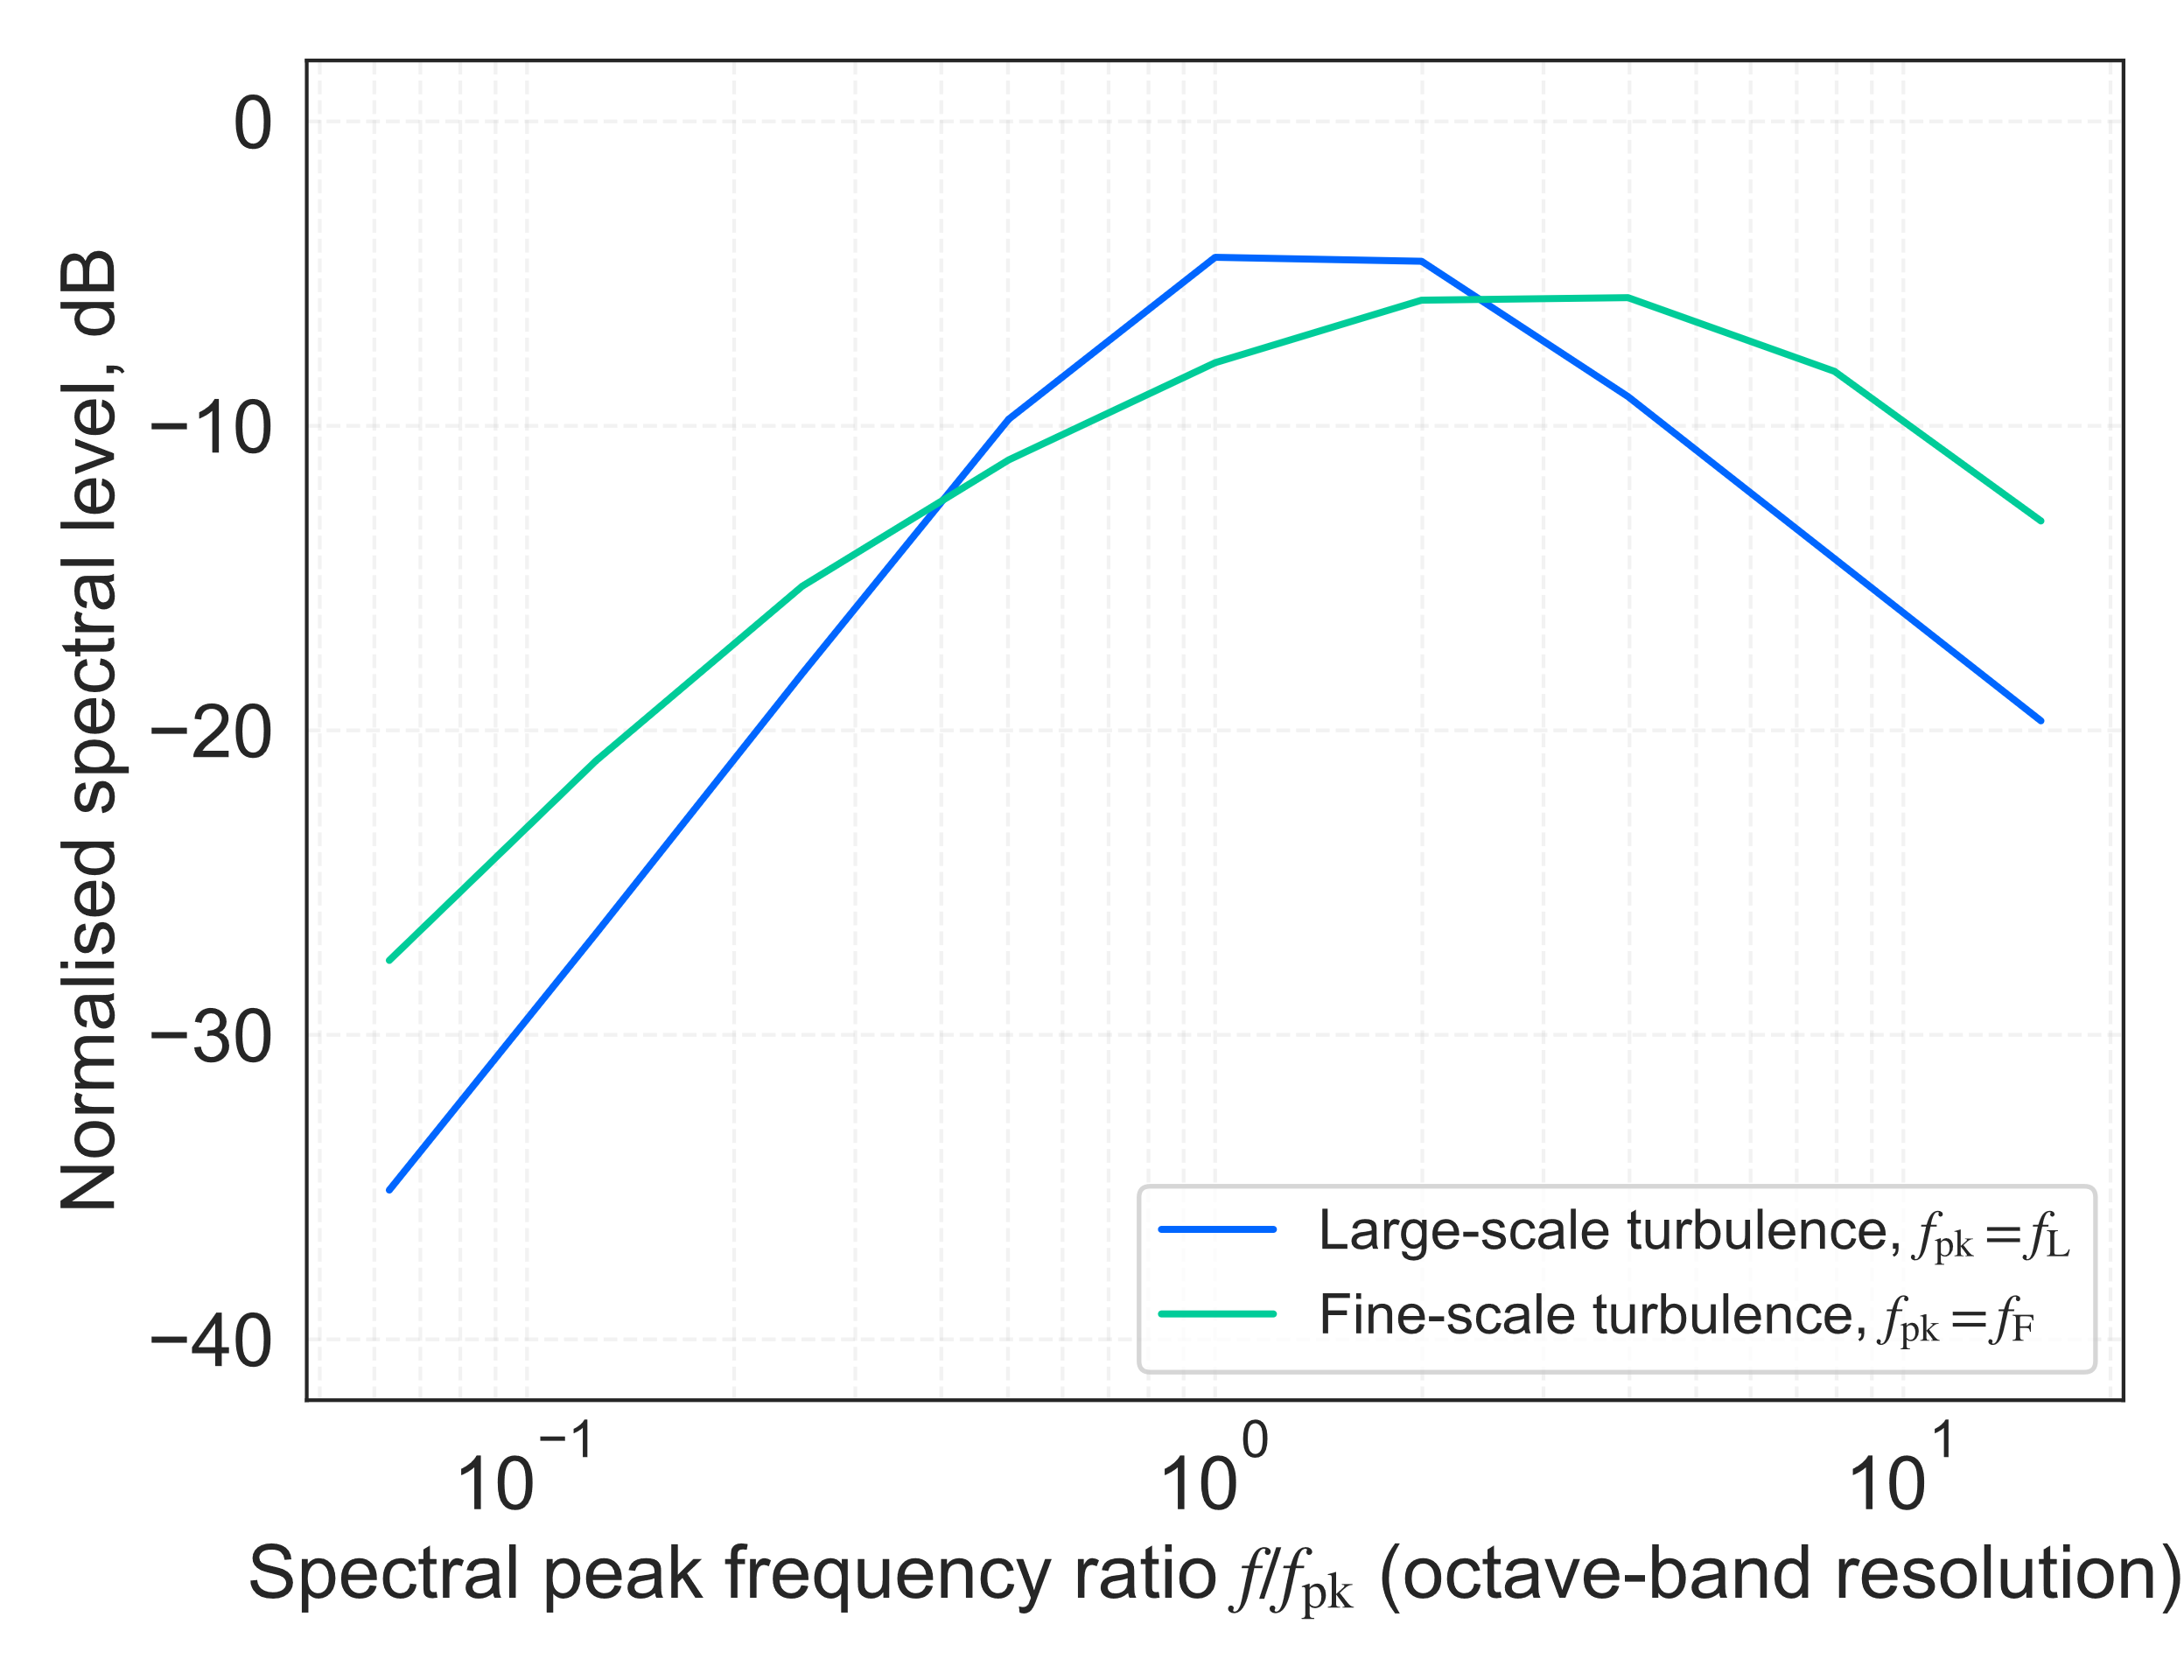
Each of the turbulence components identified by Tam et al (45,46,47) was found to be prominent within a self-similar region of the jet, and more or less dominant with varying emission angle — large-scale turbulence being dominant nearer to the jet nozzle downstream axis, and fine-scale turbulence being dominant with increasingly off-axis angles; these behaviours are also shown to be temperature-ratio-dependent. Tam (47) showed how the directional angle corresponds with the aforementioned velocity power scaling exponent, identifying that exponent values in the fine-scale turbulence-dominated region (large off-axis angles relative to the jet downstream axis) have a low exponent value near to 5, which increases towards the Lighthill value of 8 as the downstream emission angle reduces towards the jet axis (excepting the cone of silence region), where the large-scale turbulence is dominant. Comparison of the von Gierke (44) empirical curve with the later analysis of Tam et al (45,46,47) shows that the former is more representative of the fine-scale turbulence component of the mixing sound than the large-scale component.
The spectral peak for the jet is again related to St as shown in Equation 1, and for circular jets the value of St is expected to vary depending on the temperature ratio (Tj/T) and the emission angle in the range ~0.14–1.0 (7,44) — for subsonic jets, Bies et al (36) suggest a typical value can be taken as 0.2, which is also adopted by Graham & Faulkner (18). For rectangular, subsonic jets with Mach numbers in the range ~0.5–0.8 and nozzle aspect ratios of ~33–100, Bjørnø & Larsen (48) found that St (based on the nozzle height dimension ) at the spectral peak was around 0.02–0.04, with an observable slight dependency on the nozzle height (with fixed nozzle length , hence, also on the nozzle aspect ratio); smaller peak St values were associated with larger aspect ratios. Similar results were also observed by Brown & Podbury (49), for Ma~0.5–0.9 and aspect ratios 2–16, with a peak St~0.04–0.15 for the largest aspect ratio.
Brown & Podbury (49), and also Bridges (50), investigated the effect of a solid plane surface placed near to rectangular nozzle jets. They noted that the surface had a considerable effect on the overall sound emission, leading to increases in sound energy and complex spectral changes. Brown & Podbury (49) identified the likely added components as being contributions from the surface trailing edge, and a jet-surface-interaction modifying factor.
Engineering implementations of the Lighthill scaling law expressed in Equation 7 can be found in Graham & Faulkner (18), Bies et al (36) and in Baumann & Coney (39) [itself based on the model proposed by Stone (51)], although the lattermost limits itself to Ma > 0.35, which exceeds the range of interest for air curtains. Differences between these approaches include (i, as discussed above) the assumption by Graham & Faulkner (18) of a higher transduction efficiency between mechanical and acoustical energy for given jet parameters, and (ii) the adoption of spectral terms that are more representative of either the large-scale turbulence spectrum [Graham & Faulkner (18)], or the fine-scale turbulence spectrum [Bies et al (36)]. Neither reference provides an approach specifically intended for rectangular jet nozzles, so these circular jet models have been combined with the information on HARNs obtained from other literature sources to provide initial estimates of the air curtain sound emissions.
Prediction results: Grilles
In view of the results for grille predictions made using the CIBSE model (see Figure 2), predictions were then made for the mesh grille test data using each of the approaches described by Heller & Franken (7) [based on Hubert (8)], NEBB[8] (6), Kårekull et al (30), Bies et al[9] (36), Sharland[10] (52) and SRL[11] (53), to understand if any of these engineering methods could produce a closer match to the test data than the CIBSE model predictions. When undertaking these predictions, additional archive data for grille terminations were also incorporated into the measurement dataset (device references D and E in Table 2 and Table 3) — these were available only for relatively low test flow velocities, but provide a broader set of data for prediction comparisons.
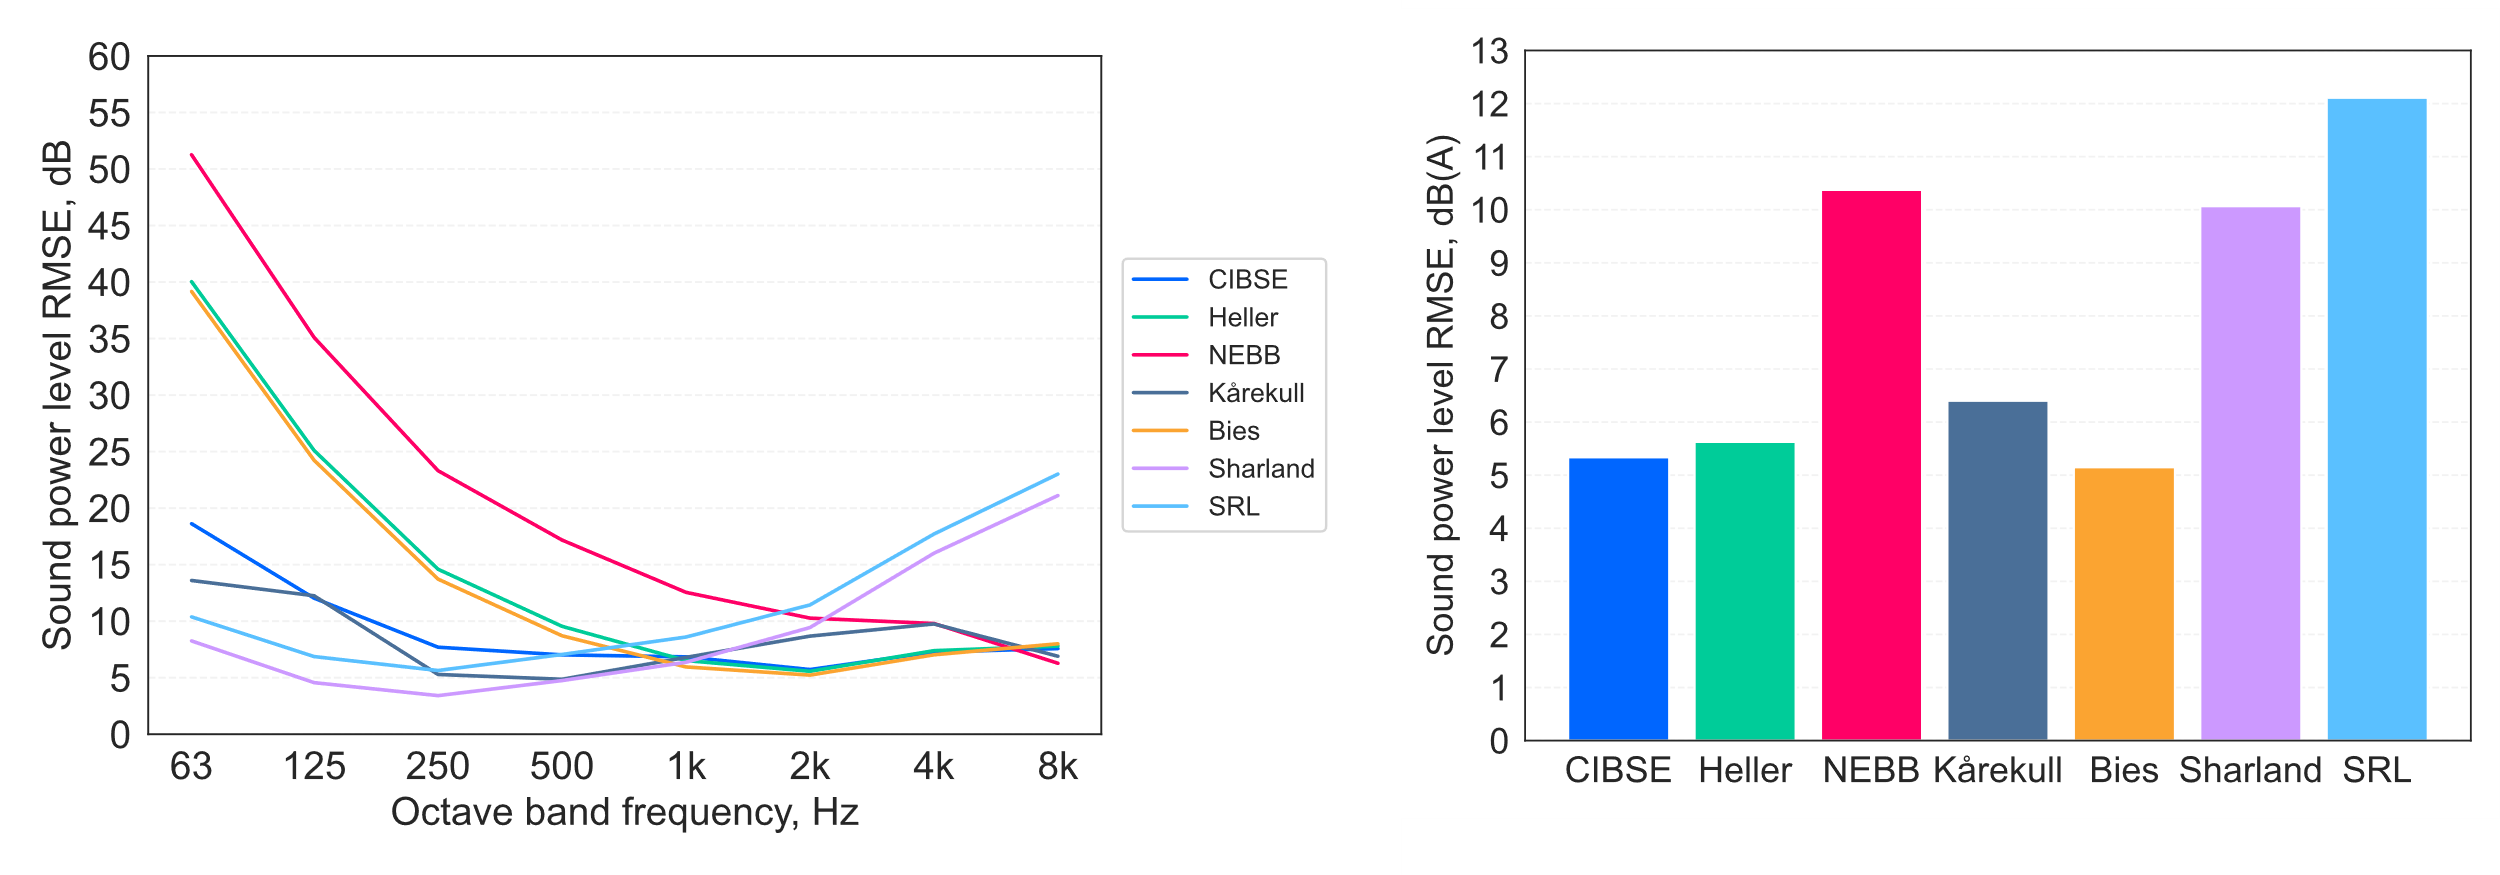
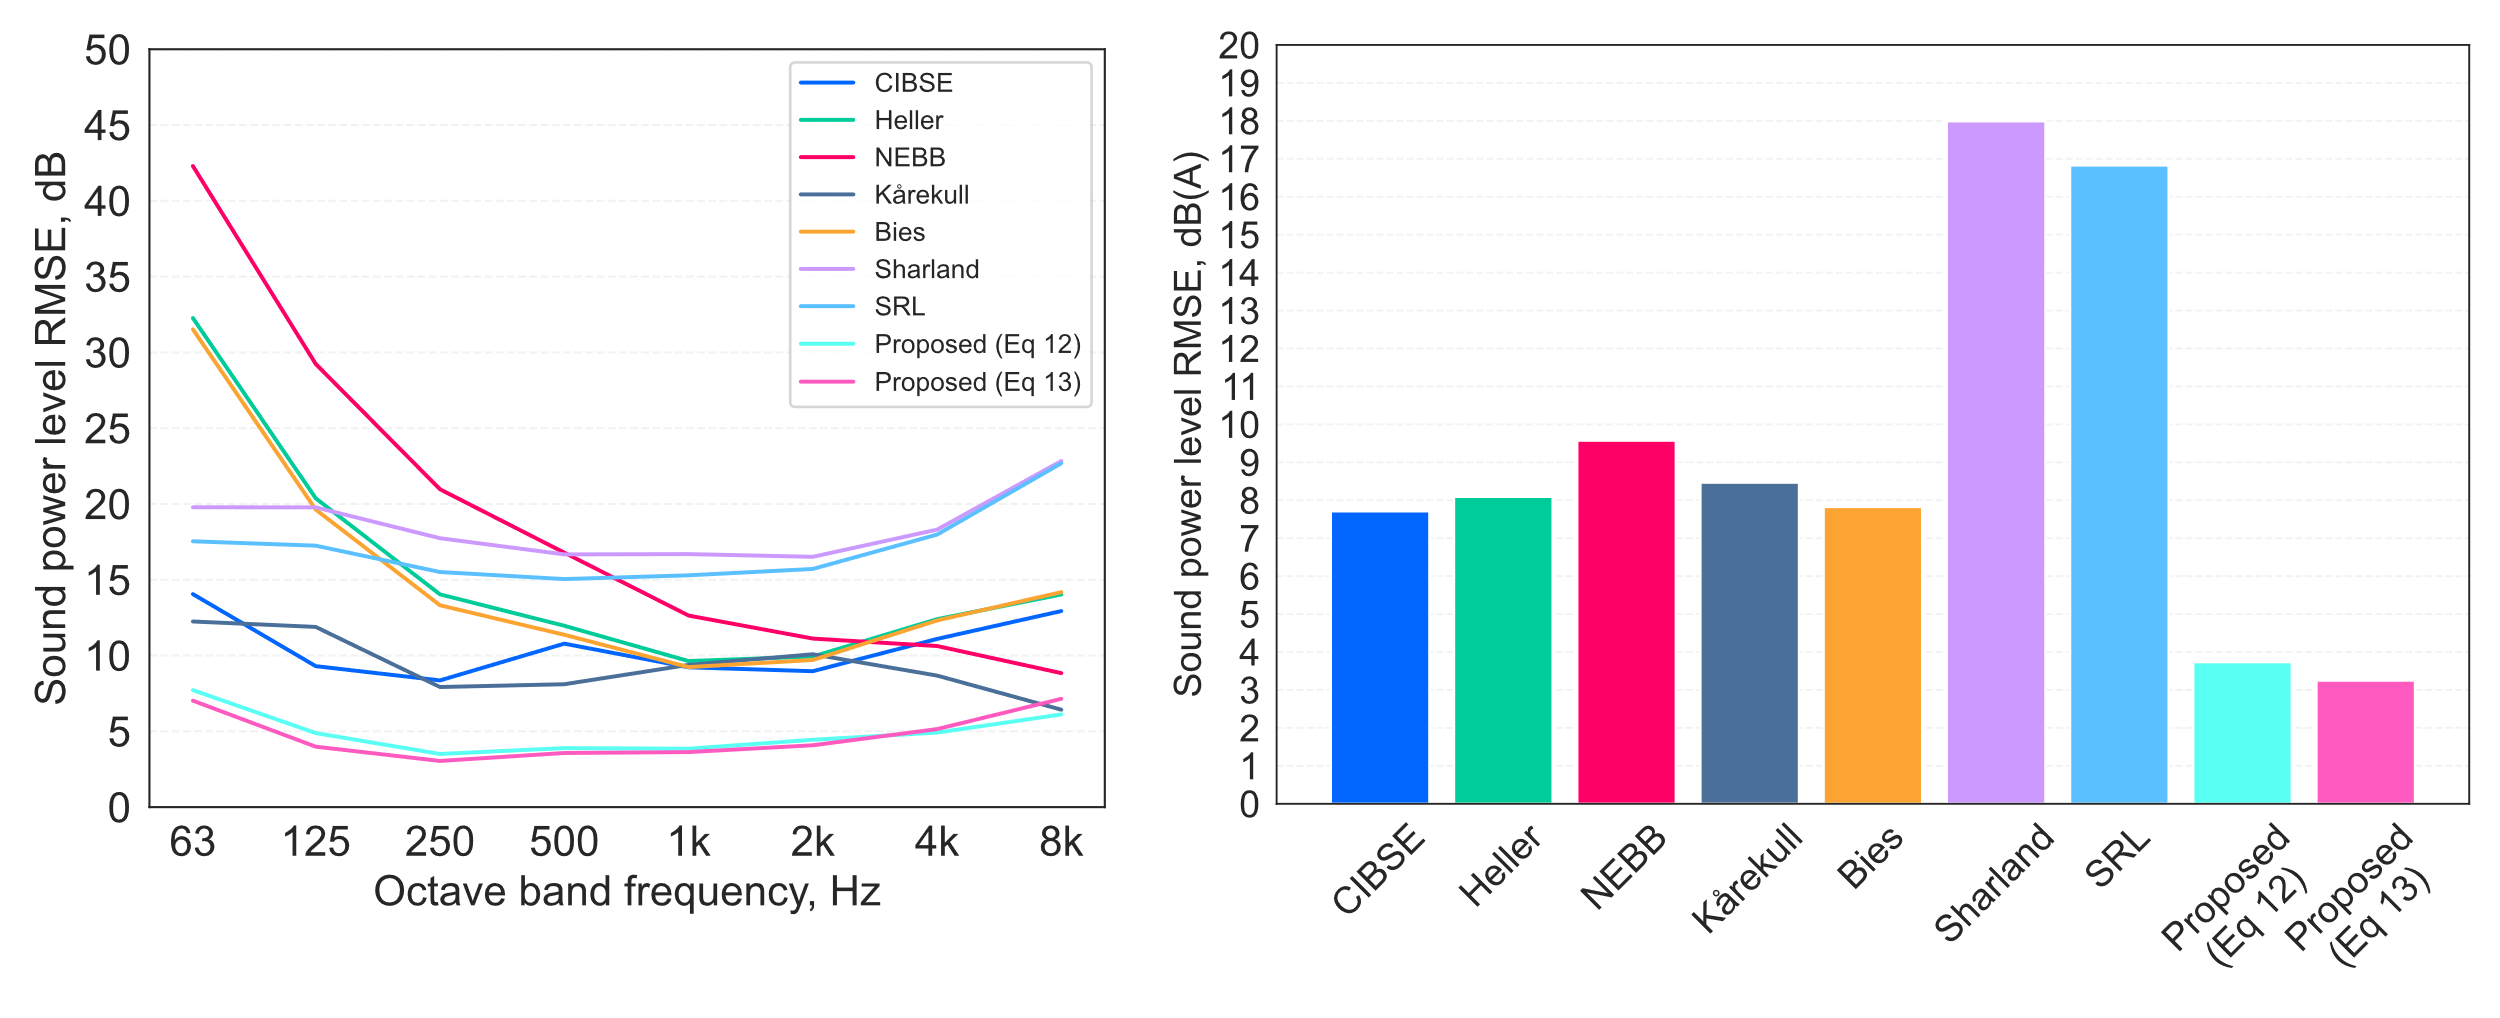
The results of the predictions[12] are summarised as the root-mean-square error (RMSE) in the predicted sound power level spectra (Lw, dB re 10-12 W), and the overall A-weighted sound power levels (LwA) for all of the three tested mesh grilles in Figure 5. Indicative spectral comparisons with the test data are also shown in Figure 6 (for brevity, results in Figure 6 are shown for grille device ref A only).
Figure 5 indicates that prediction RMSEs tend to be larger for lower frequency bands, with broadband A-weighted RMSEs within the approximate range 5–12 dB. Interestingly, the CIBSE Guide B4 model is seen to yield somewhat lower errors than most of the other models in this group, although RMSE values exceed 5 dB and extend up ~20 dB at low frequencies.
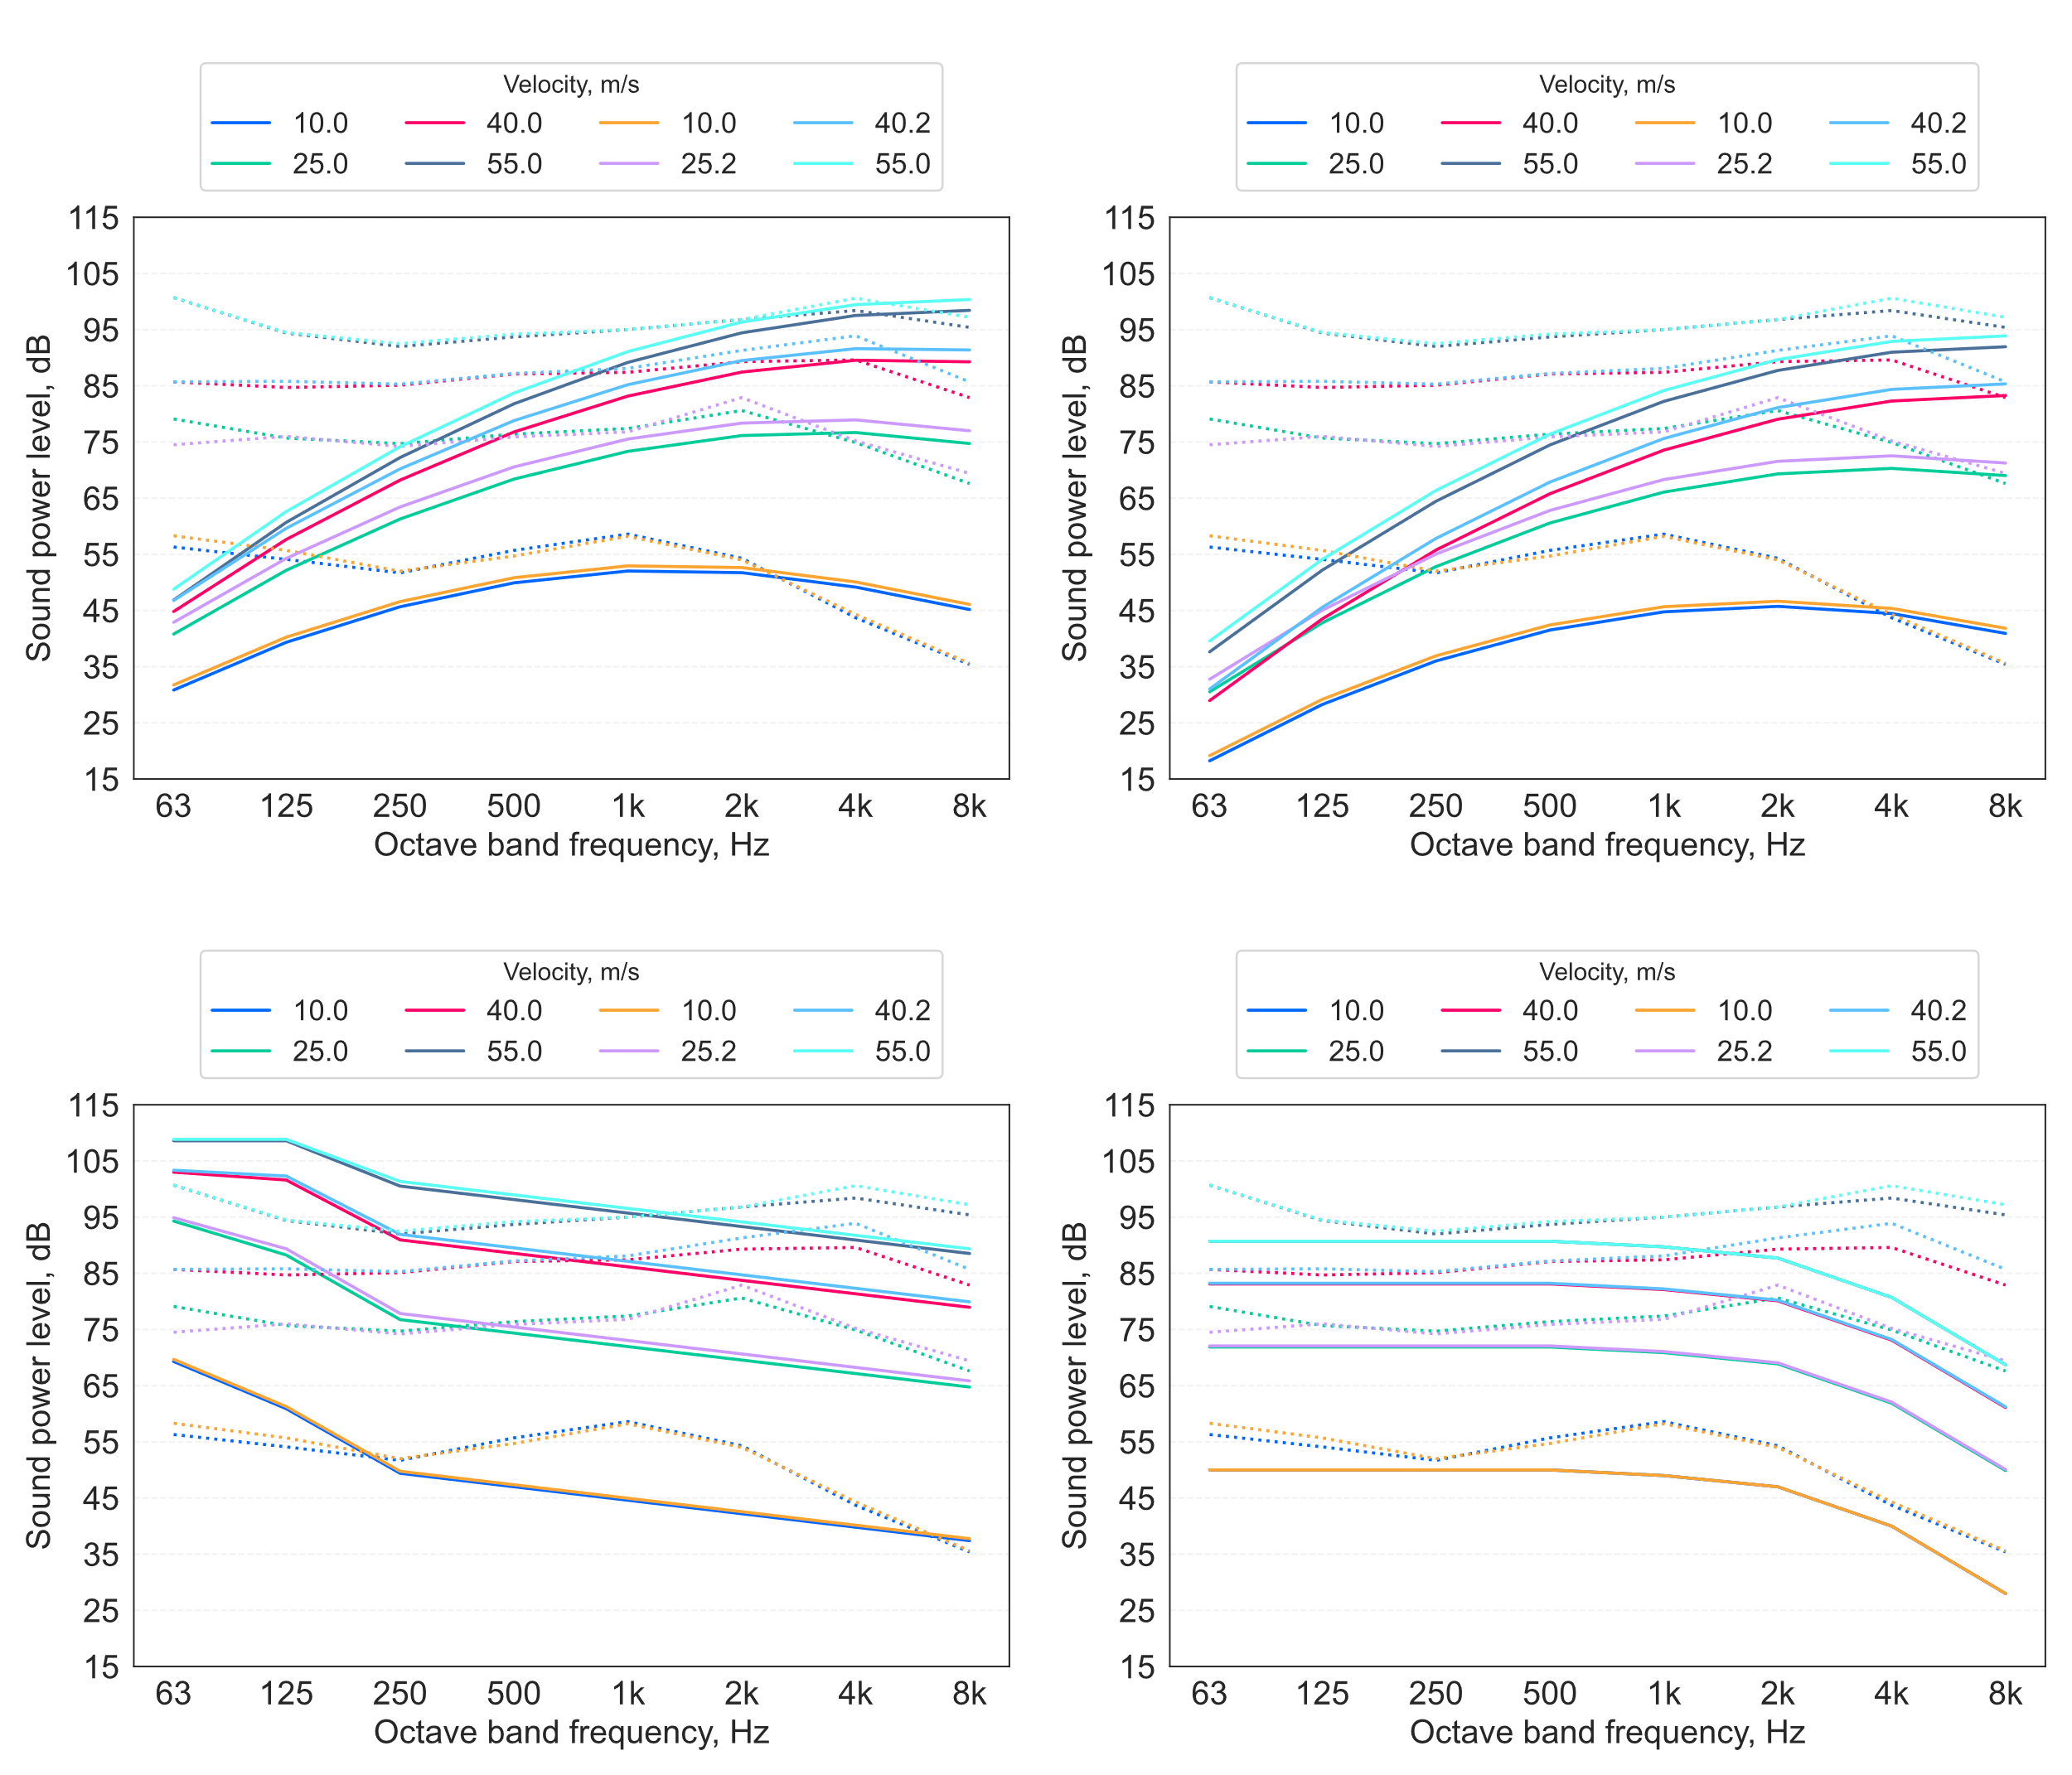
Inspection of Figure 6 suggests that, while there is considerable inter-model variation, all the models tend towards underestimation of the measured Lw. However, a notable distinction can be seen at low frequencies, whereby the models based on the room diffuser data from Hubert (8) underestimate the low-frequency energy (< 250 Hz) by a relatively large margin, while the Kårekull et al (30) model tends towards overestimation in these bands, exhibiting a rather different spectral trend that does not display an upper frequency peak. The Sharland model, on the other hand, provides closer estimates at low frequencies, but again omits the upper frequency peak, and underestimates levels in the upper frequency range[13]. Another interesting aspect of the results shown in Figure 6 is that the NEBB (6) approach tends to yield lower estimates than the Heller & Franken (7) model on which it is based[14]. This discrepancy seems to be due to differing spectral normalisation procedures, and therefore probably represents a misinterpretation by NEBB (6) of the original Heller & Franken (7) approach.
Since none of the reviewed models closely predicted the measured data, new models for mesh grille flow-generated sound emissions have been formulated, derived by incorporating aspects of existing models together with the information gathered during the literature review, as described in the following sections.
Model development: Grilles
First, the peak frequency is estimated using Equation 11 (making use of Equation 2 and Equation 3):

In Equation 11, the Strouhal number term in the bottom row has been derived by fitting a power curve to the values advised by Heller & Franken (7), based on the assumptions that the Strouhal number should approach zero as the pressure difference drops towards zero (ie, no apparent obstruction), and will increase in a non-linear fashion with increasing pressure difference.
The octave band in which the peak frequency lies fpk,oct (i) is determined according to the definition in BS EN IEC 61260 (54). Similarly, the duct cut-on frequency is calculated according to Equation 5 or Equation 6 (as appropriate), and the octave band in which the cut-on frequency lies fco,oct(j) is determined. Other octave bands in the spectrum relative to the peak and cut-on bands are then denoted foct(i±m) or foc(j-n), respectively, where m and n are integers indicating each band’s position relative to (ie, m or n bands above or below) fpk or fco. The sound power spectrum Lw for the grille can then be estimated using:

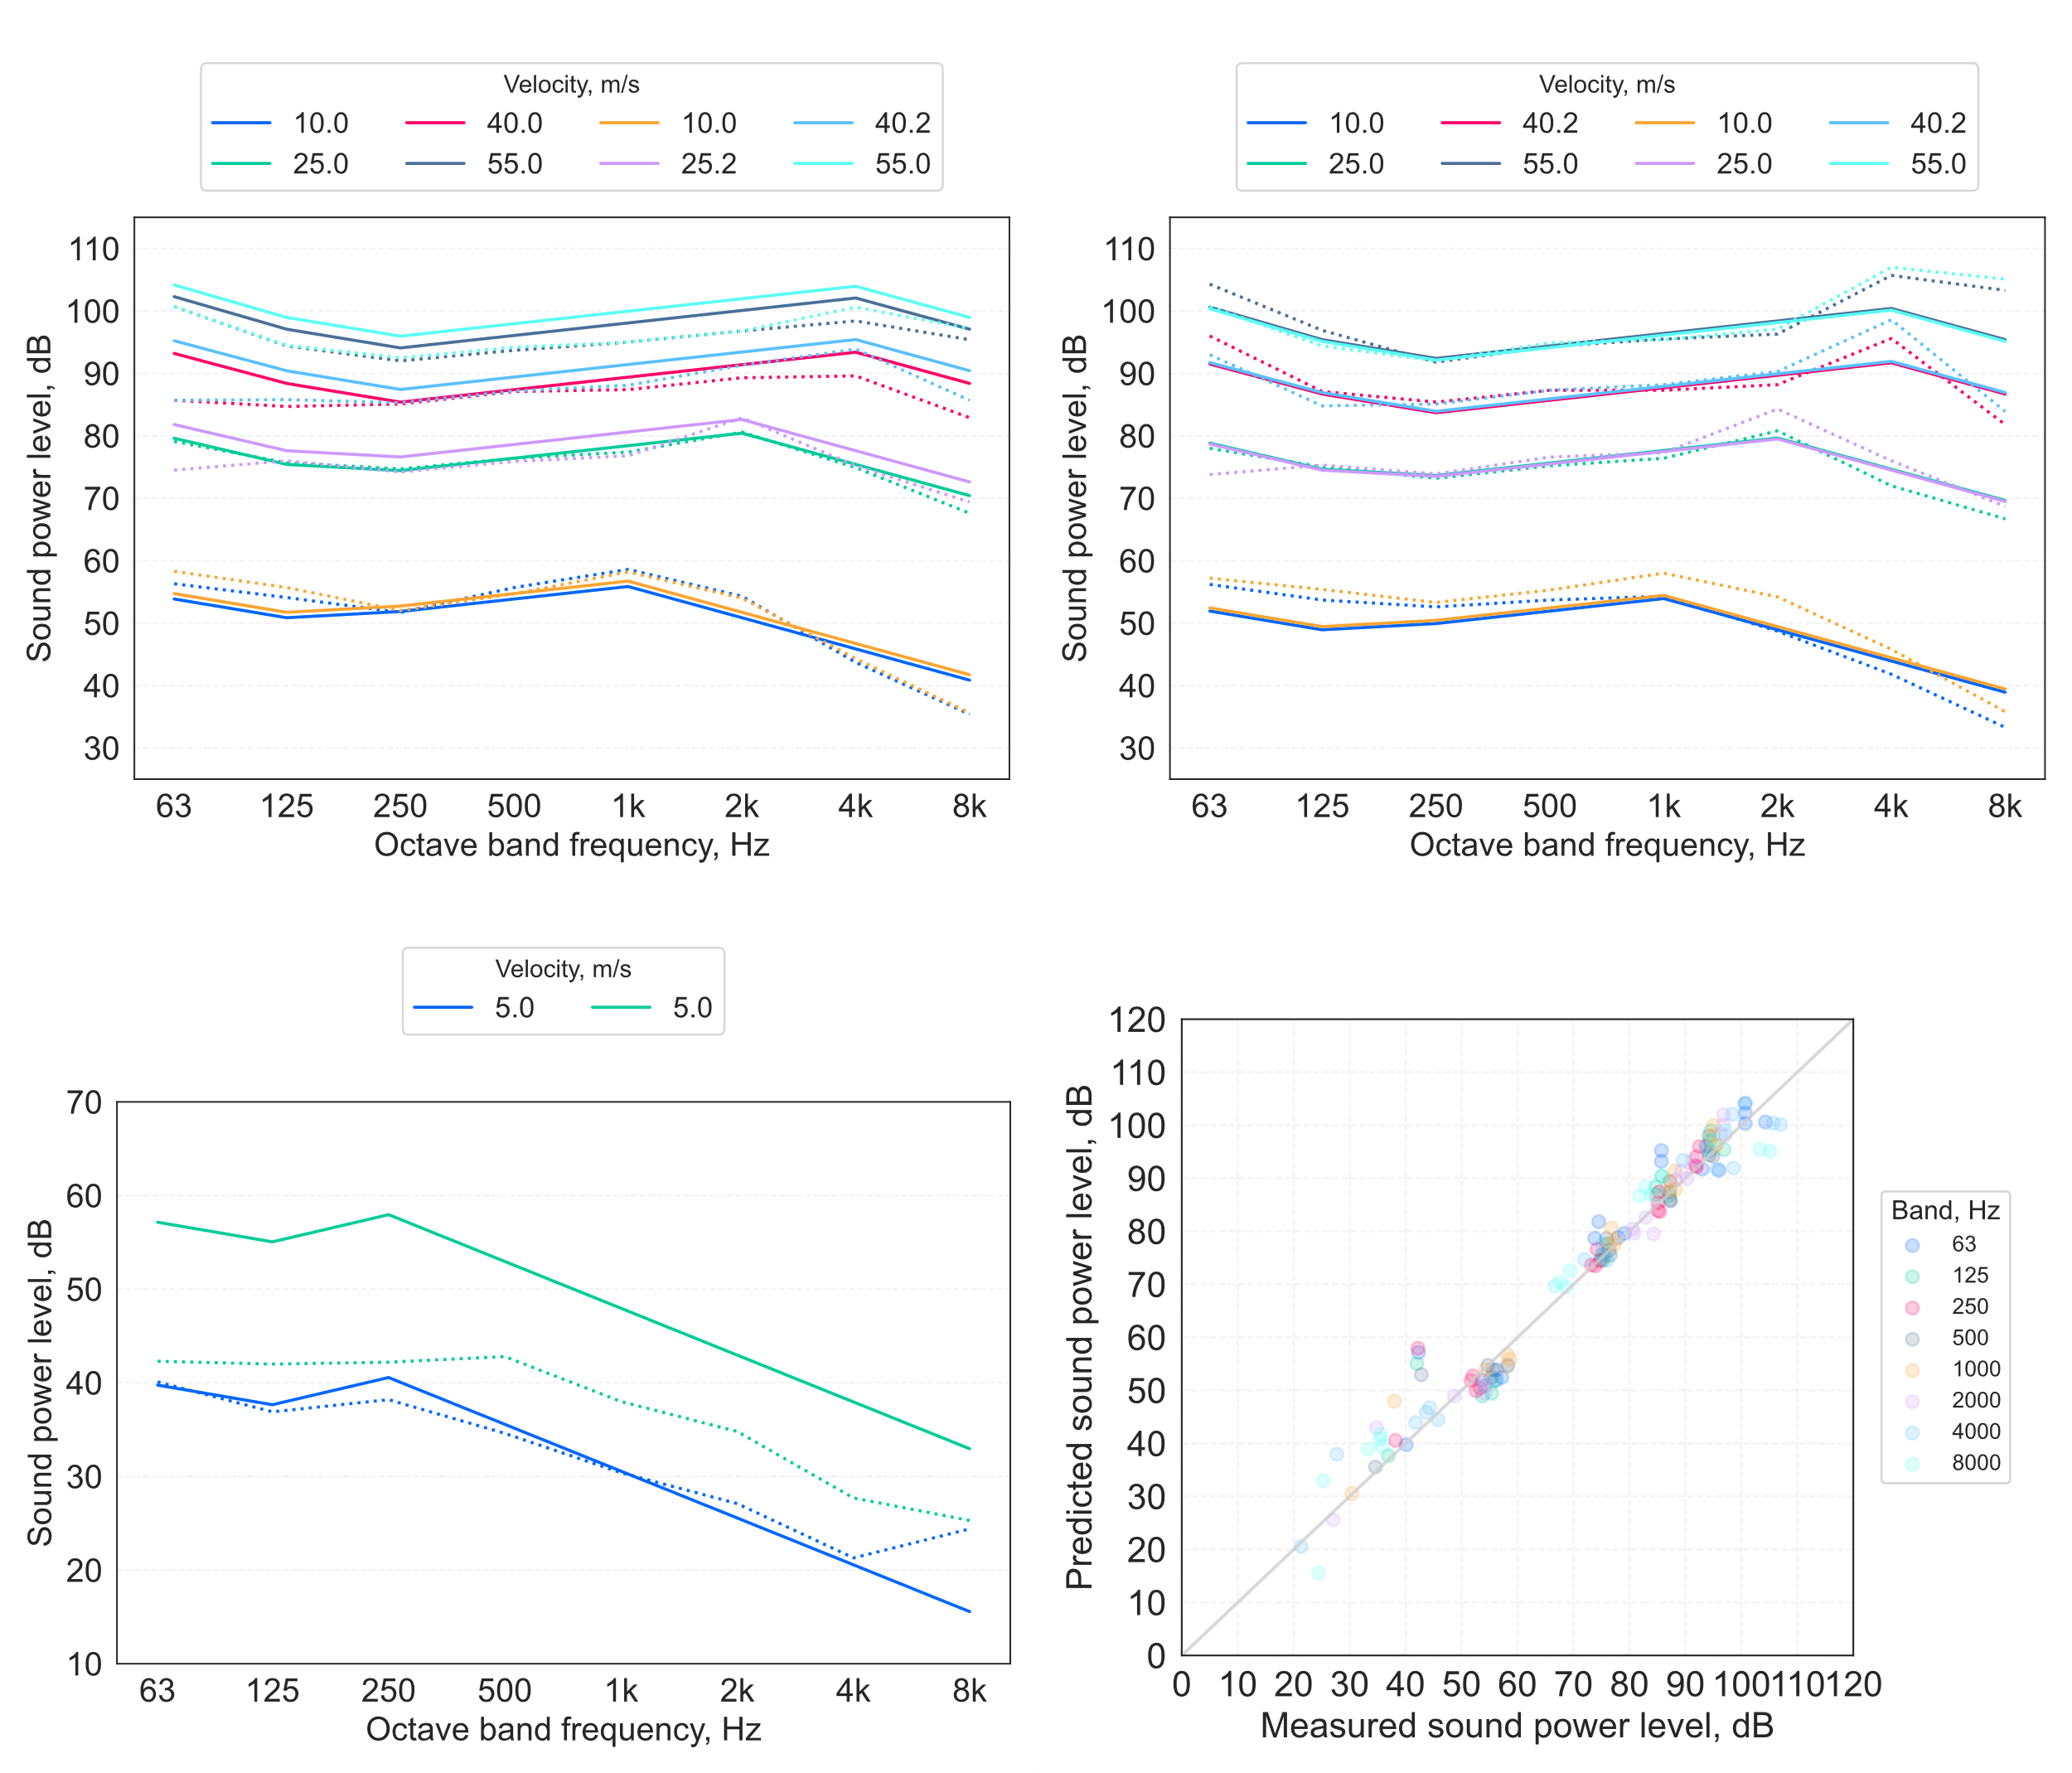
The results of predictions for the mesh grilles using Equation 12 are presented in Figure 7. The model predictions in Figure 7 exhibit a closer fit to the measurements, although the model consistently overestimates the sound power level for one of the grille E tests (Figure 7 bottom left). The data shown in Table 3 indicate that, while both grille E tests were reportedly undertaken at the same flow velocity, each test was applied in opposite direction, one of which resulted in a much higher pressure drop across the device. The reason for this remains unclear, as such a large pressure discrepancy due to a reversal of flow direction was not observed in any of the other grilles for which archive test data were available.
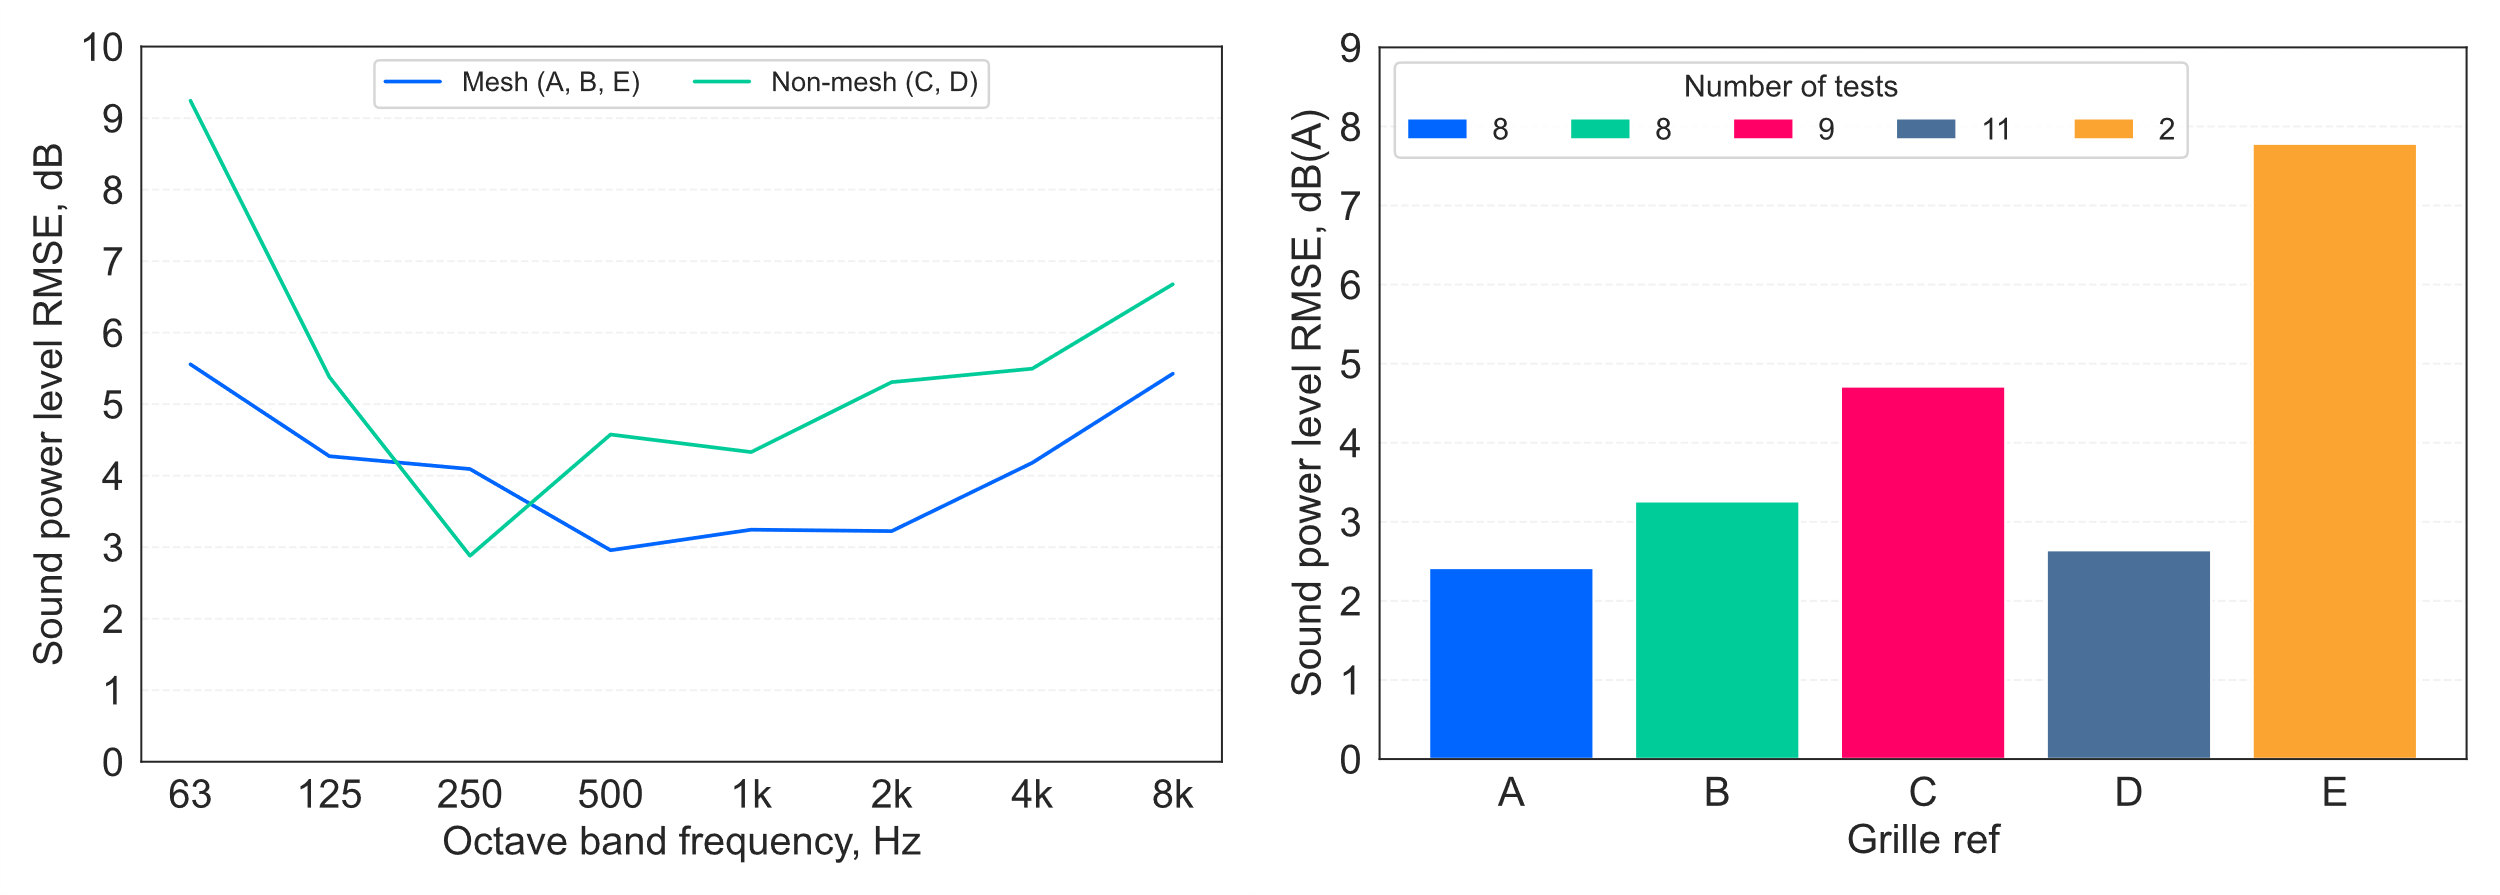
A comparison of RMSE between the Equation 12 model predictions for the mesh grilles (refs A, B and E), and the non-mesh grilles (C, a plastic ‘eggcrate’ grid, and D, a machined slot- perforated metal plate) is shown in Figure 8 (left). This indicates that model errors tend to be larger for the non-mesh predictions than for the mesh grilles.
The RMSE in for each grille is also shown in Figure 8 (right), which illustrates that, although the error for one of the grille E tests is relatively large (see Figure 7 bottom left), the smaller number of tests on this device compared with the other grilles means this has a reduced importance when considered (aggregated) over the full dataset.
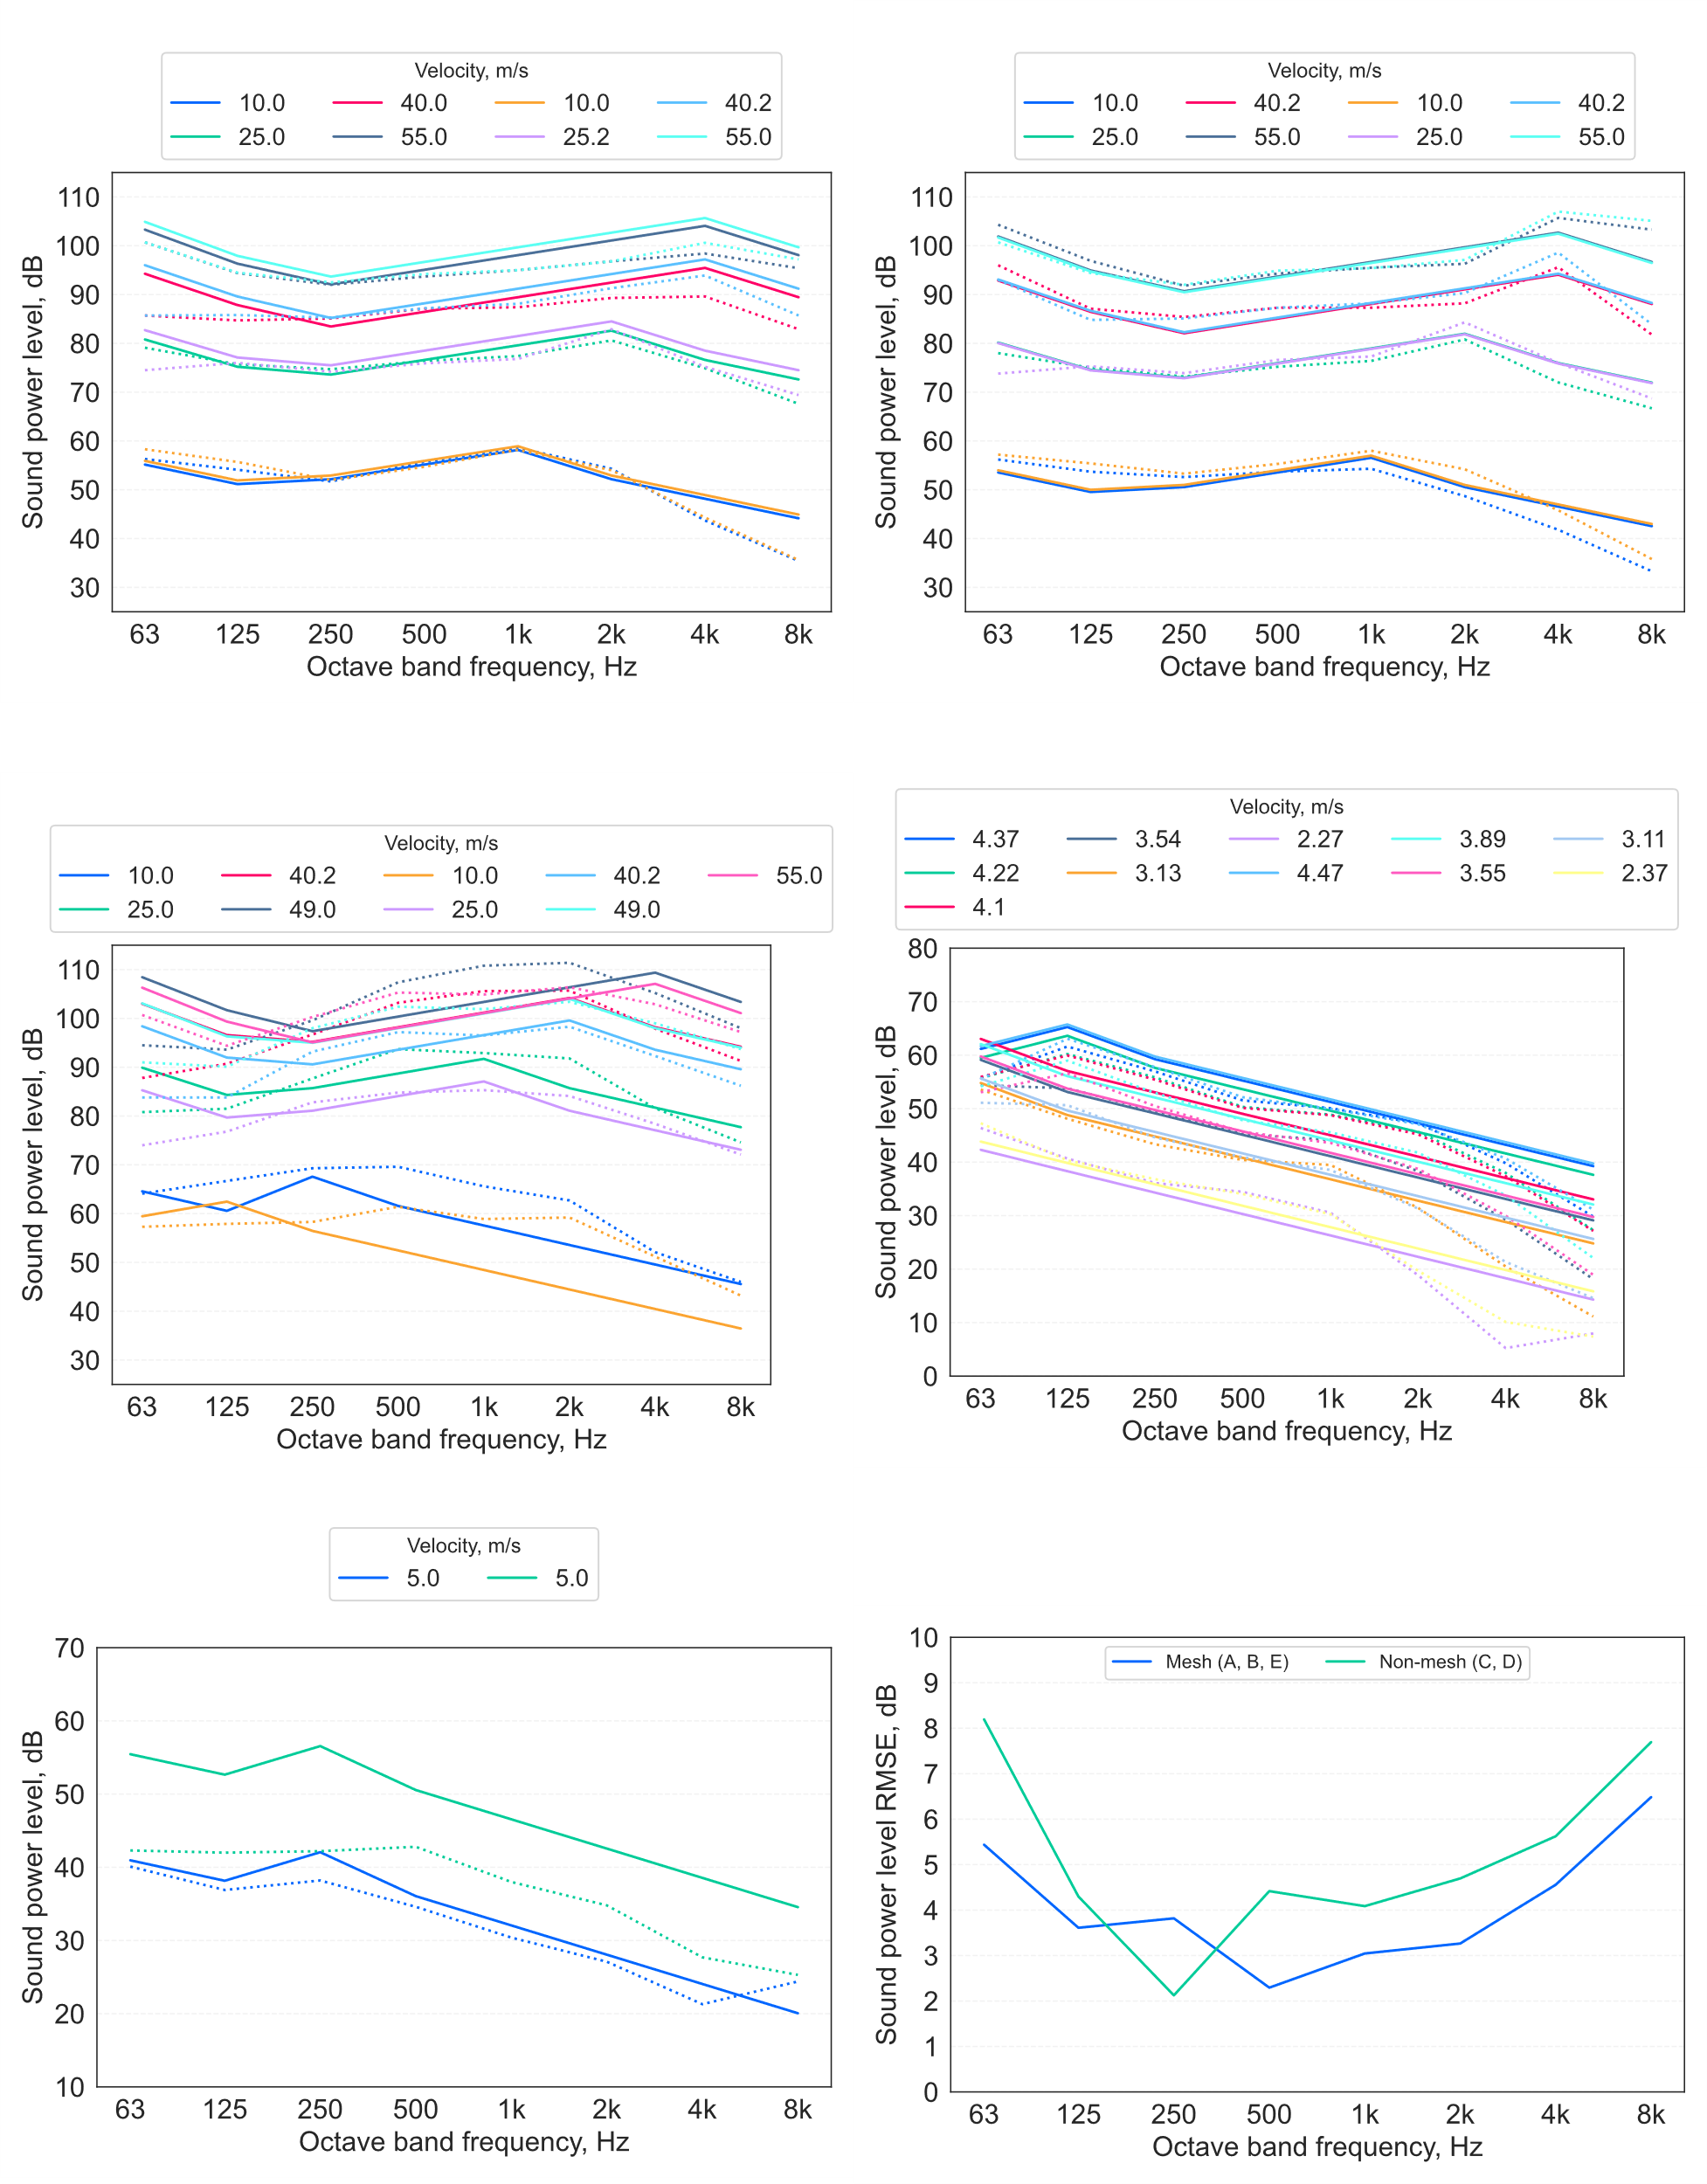
A similar, but marginally more complicated, model has been developed by replacing the parameter with separate terms for and , and allowing these to have varying exponents, as shown in Equation 13:

The results of predictions made using the model in Equation 13 are shown in Figure 9, which shows a good agreement with measurements in most cases — lesser agreement is evident for the plastic ‘eggcrate’ grid grille ref C and for one test of the mesh grille ref E. Further analysis results from the Equation 13 model are presented in the Outcomes section.
Model development: Air curtains
For air curtains, input parameters used to make estimates of the total emitted sound power are shown in Table 1.
| Nozzle length a,m | Nozzle height b,m | Jet velocity Uj, ms-1 | Jet temperature Tj,K | Jet density[15] ρj,kgm-3 | Ambient air temperature T, K | Ambient air density [14] ρ, kgm-3 |
|---|---|---|---|---|---|---|
|
10.33 |
0.115 |
26.94 |
305.15 |
1.157 |
303.15 |
1.164 |
An air curtain sound power model is proposed based on Equation 7 to Equation 10. The following assumptions have been adopted:
- The mechanical power and acoustic power relations expressed in Equation 8 and Equation 9 remain valid, and the acoustic power coefficient is similar for rectangular nozzle jets as for circular jets — aK value of 3 × 10⁻⁴ is assumed as a reasonable worst-case.
- Jet Mach numbers are relatively low, and the conditions on Equation 10 are also met.
- To estimate the sound power spectrum, the separated similarity spectra are combined together as shown in Figure 10.
- A single peak frequency can be estimated based on a Strouhal number of 0.03 — the combination of the similarity spectra broadens the overall jet spectrum, which makes a precise peak value (which appears to have some dependency on aspect ratio) of lesser importance.
- There is no nozzle ‘lip extension’ or flow guide surface extending from the air curtain nozzle, which otherwise could increase the emitted sound power and contribute additional spectral components.
The total air curtain sound power level is first estimated using Equation 14:

The peak frequency is then estimated using Equation 15 (based on the nozzle height):

The octave-band sound power levels Lw [foct] are calculated using the ratio f_ratio=foct/fpk in Equation 16[16]:

in which C is an arbitrary constant value applied to ensure the total sound power level calculated from the octave-band values is equal to Lw estimated using Equation 14.
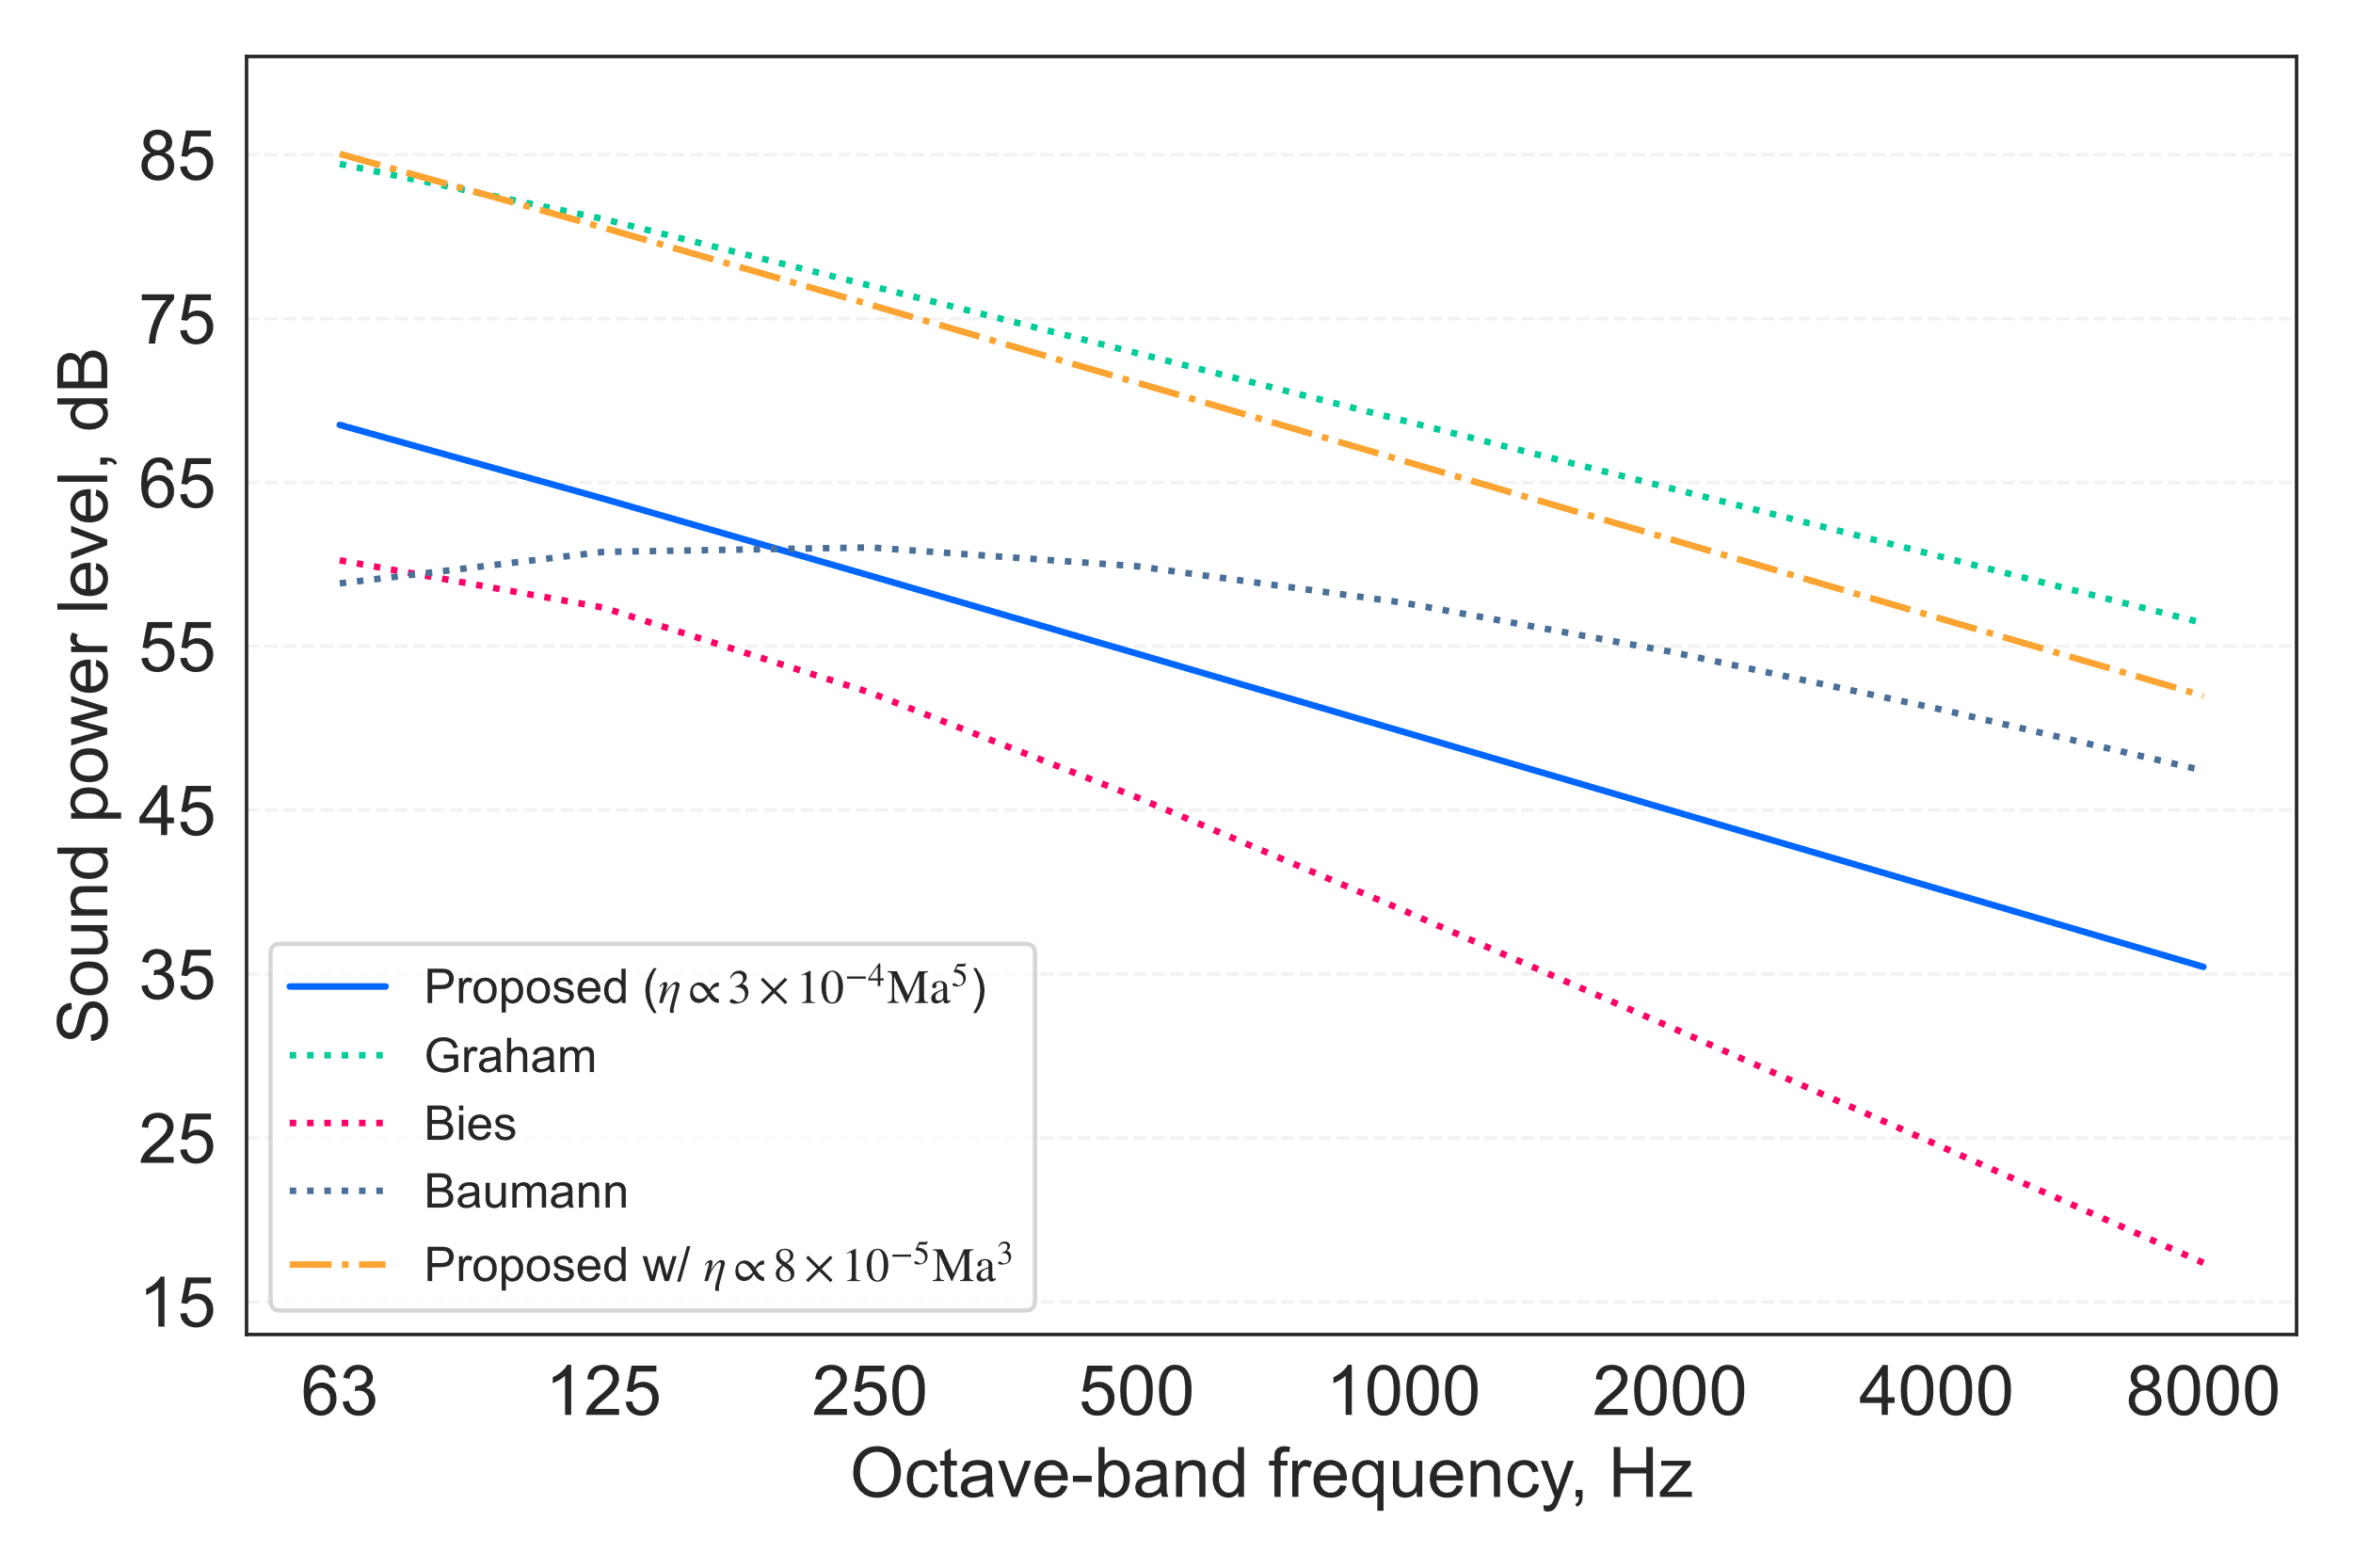
Estimates made using the model proposed in Equation 14 to Equation 16 with the input parameters in Table 1 are shown in Figure 11, alongside indicative estimates using the engineering approaches for circular jets set out by Graham & Faulkner (18), by Bies et al (36) and by Baumann & Coney (39). The circular jet-based estimates have been adjusted for the radiating area of the assumed air curtain dimensions — these results can be considered as representing ‘naïve’ estimators, which might be reflective of a typical engineering approach to addressing the problem, in the absence of a dedicated engineering model available in relevant guidance. Also shown in Figure 11 is an estimate made using the proposed model with the acoustic efficiency suggested by Baumann & Coney (39), which leads to an increase of ~17 dB above the level predicted using efficiency values from other literature sources. This illustrates the apparently wide margin of uncertainty within the knowledge base identified in this investigation.
Outcomes
For grille terminations, new prediction models for flow-generated sound power levels have been developed, which, as shown in Figure 12, produce results in closer agreement with available archive test data than a range of existing engineering models identified in guidance and relevant literature. While the new models have been developed for mesh grille terminations, the improvement in general agreement also extends to the slot-perforated metal plate and plastic ‘eggcrate’ grid grille types included in the dataset.
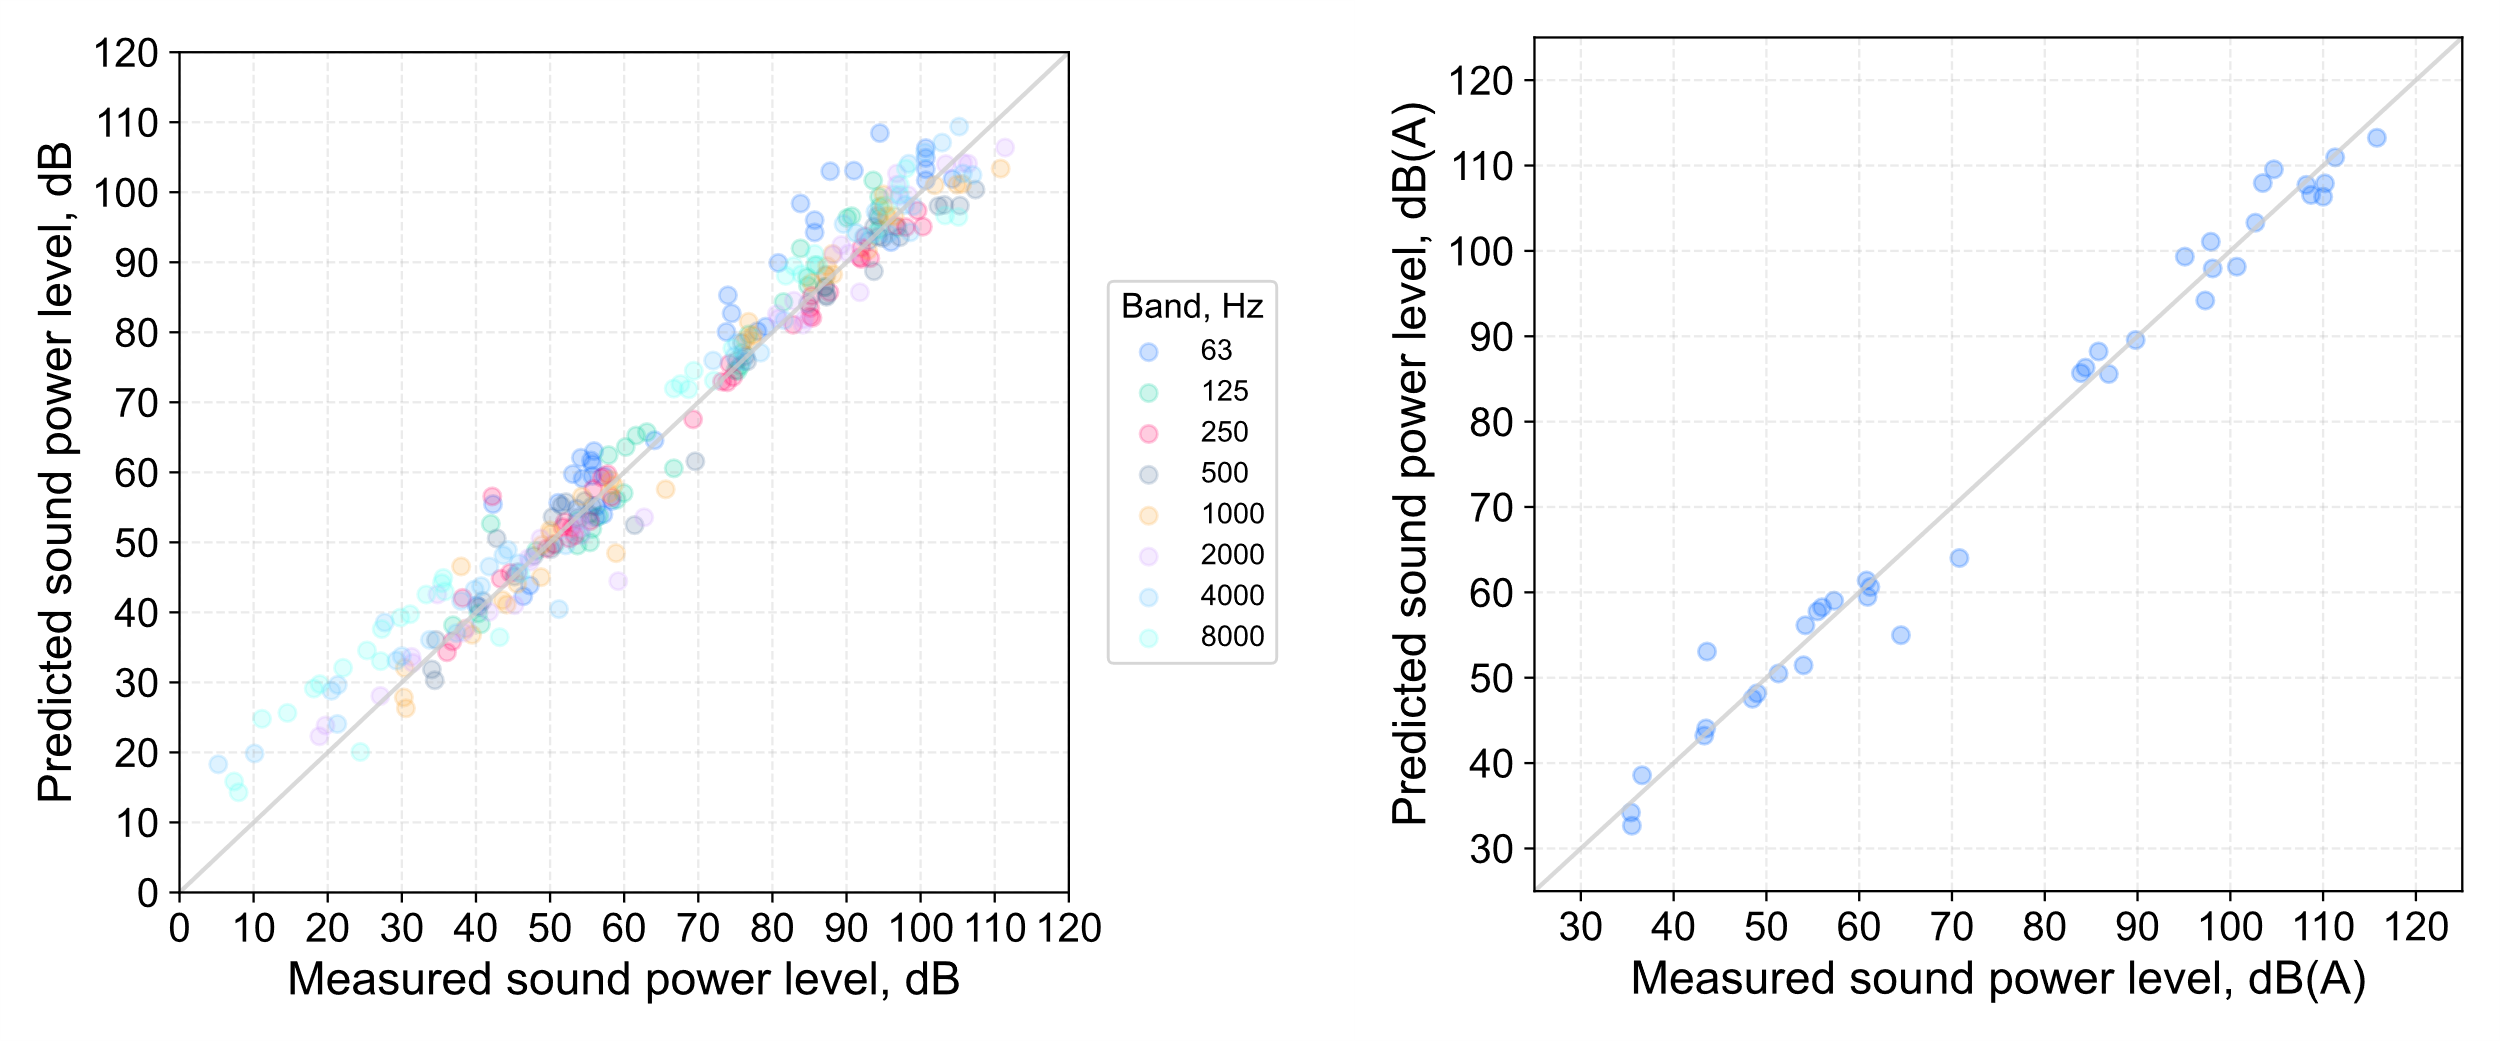
The resulting accuracy of sound power predictions made using the model defined in Equation 13 is summarised in Figure 13, which demonstrates the generally good agreement with the measured data over the spectral range considered. However, it should be remembered that the dataset comprises only a relatively small range of such devices, and therefore the models may not necessarily be similarly accurate in making predictions for other grille designs and geometries. Furthermore, it must be recognised that measurements inherently incorporate uncertainty, and this aspect has not been taken into account in the model development, which implicitly assumes the measurements are accurate representations of the ‘true’ values sought. Nonetheless, the development of the models has been undertaken with reference to some of the aeroacoustic phenomena expected to be involved, which provides a degree of assurance for wider application.
It should also be noted that, while the review of mesh grille sound has highlighted the potential contributions from tonal energy generated by the flow around grille struts, this does not necessarily mean that the sound emitted would contain prominent or even audible tones — determining the subjective audibility and prominence of tones within aerodynamic sound can be a complex process, and tonal energy can be masked by the contributions from broadband sound energy. Octave-band and third octave-band engineering methods as discussed here do not provide sufficient spectral resolution to support robust analyses of tonal audibility or prominence. This is also a limitation of the measurement data used to develop the proposed models.
For air curtains, the literature review has provided an informed basis for making simplified estimations of the flow-generated sound power levels. However, in the absence of specific device test data for comparison purposes, this remains an area of uncertainty, the main aspect of which appears to be the variability in assumptions on the efficiency of acoustic power transduction occurring in jet flow sound generation, coupled with a lack of information specific to rectangular nozzles and planar jets. The fluid dynamics and acoustics associated with jet flow-generated sound are highly complex, and existing knowledge is documented over a vast literature base, only a small part of which has been feasible to include in the review supporting the proposals set out herein.
For reduced risk, it could be seen as important to adopt the parameters leading to the highest predicted air curtain sound levels, however, the provenance of the parameters leading to these values is unclear, and would result in a sound power scaling dependence on rather than , suggesting a dipole-dominant source rather than the classical quadrupolar law espoused by Lighthill (31,32) for subsonic jet flow mixing sound.
One of the benefits of the practical prediction approaches proposed for both termination device types is that they are easily implemented and require no specialist software — while the analyses presented here have been undertaken using Python-language scripting and libraries, the models would be straightforward to incorporate into any basic calculation tool, such as widely-used spreadsheet software.
Learnings and recommendations
In relation to grille terminations, the key learning points are summarised as follows:
- Existing engineering approaches to predicting flow-generated sound identified in relevant guidance and literature have not shown close agreement with available test data for atmospheric termination grilles.
- A review of literature indicates that it is important to consider specific aeroacoustic phenomena that may not be accurately represented in these existing approaches, including tonal energy generated by discrete components, and low-frequency energy, which may be connected with flow turbulence.
- New models developed that represent these aspects have been shown to have closer agreement with the available measurement dataset.
It must be acknowledged that a detailed physical analysis has not been undertaken to provide a rigorous basis for the predictive approach. One area in particular that should be highlighted is the low-frequency part of the spectrum. When developing prediction models with empirical data there is always a risk of overfitting to measured values, which can result in poorer prediction performance for input parameters that are not found in the dataset. The models developed exhibit reduced error in this region compared with existing engineering approaches, which is primarily explained by the assumption in the existing models of progressive attenuation for bands below the identified peak frequency; this contrasts with the elevating sound energy in the proposed models in certain low-frequency bands. Based on literature evidence, a plausible explanation for the higher low-frequency energy has been proposed as greater turbulence in the system at increasing flow velocities. The proposed models assume that these elevations in low-frequency energy occur below the duct cut-on frequency, and this seems to agree with some of the data, yet a physical reason for this frequency representing an inflection point does not seem to be obvious — the different waveguide modal propagation regions may be of great importance for the nature of sound transmitted through a ducted system, but the relevance to sound generated only at the termination is more obscure. Testing the models with additional measurement data could be valuable for more extensive validation (or further development), and for investigating physical theories.
Regarding air curtains, the key learning points are summarised as follows:
- No specific engineering models were identified in relevant guidance or literature that provide a means for predicting flow-generated sound from an air curtain device.
- Much of the literature appears to be focussed on jet engines, which generally operate at much higher flow velocities and gas temperatures than the air curtain devices considered, as well as tending to have circular cross-sectional geometries.
- Evidence on rectangular jet nozzles tends to address higher flow velocities than relevant for air curtains, and tends to have been focussed on identifying non-dimensional scaling rather than determining absolute sound power output. Nonetheless, the literature provides some scientific basis for assumptions underpinning the proposed simplified estimation approach, which is based on the classical Lighthill 8th power (quadrupolar) velocity-scaling for subsonic jets.
- Some evidence indicates a dipolar (6th power of velocity) scaling could be related to another mechanism in rectangular jets, such as edge-generated sound by the nozzle, but further research is needed to establish the relevance of this for the particular application considered. Test data specific to air curtain devices of similar design to that described here would be most valuable to developing this understanding.
Research and test measurements specific to air curtains would therefore be beneficial in developing and validating suitable prediction methods potentially more appropriate to the particular physics involved. As has already been noted, for general applications concerning predictions of air curtain sound pressure levels at specific locations, it could be necessary to consider the directional patterns of jet sound emissions, and how these are interrelated with the identified similarity spectra.
It should also be noted that this technical discussion on the flow-generated sound from termination devices represents investigations undertaken during the design development stages, and as such does not imply that such devices as outlined will necessarily be incorporated in the completed design of HS2.
Conclusions
Within the context of large-scale railway tunnel ventilation systems applications, system requirements may entail relatively high flow rates to be achieved, leading to increased risks from flow-generated sound emissions — atmospheric terminations offer little opportunity for technical mitigation, due to their positioning at the end of the ducted system chain. Suitable estimation methods are therefore important for evaluating the potential risk to achieving environmental design targets. The flow-generated sound emissions from two types of duct atmospheric termination device have been investigated, with the aim of identifying practical approaches to predicting sound generation.
For grille terminations, predictions using existing engineering methods identified in relevant guidance and literature with laboratory test input parameters were shown to underestimate measured levels in available archive test data. New models have therefore been developed, based on a combination of aeroacoustic considerations and empirical optimisation, predictions from which exhibit a closer agreement with the data. Of particular value for the application is that the proposed models show good agreement over a relatively wide range of flow velocities.
For air curtains, an estimation approach has been devised based on a review of literature. In the absence of specific device test data for comparison, the reliability of the proposed approach remains uncertain, and further investigative research is recommended to understand the relevance of key parameters that have a strong influence in the potential variability of predictions: foremost among these being the efficiency of acoustic power transduction, and the associated relative dominance of possible source mechanisms contributing to the total sound emissions.
It is hoped that the learning legacy of this work includes an understanding of some key aspects of the acoustics involved in flow-generated sound from ducted ventilation system termination devices for railway and industrial applications, together with relatively simple and practical approaches to predicting their sound emissions.
Acknowledgements
This work was prompted by collaboration with engineers under the Railway Systems Support Contract, including Mark Gilbey and Jyh Chyuan Shim (both WSP).
References
| No | Reference details |
|---|---|
|
1. |
Blake WK. Mechanics of flow-induced sound and vibration. 2nd ed.: Elsevier; 2017. |
|
2. |
CIBSE. CIBSE Guide B4: Noise and vibration control for building services systems. London:; 2016. |
|
3. |
ASHRAE. 2019 ASHRAE Handbook: heating, ventilation and air-conditioning applications. ; 2019. |
|
4. |
Emcor Rail / Fraunhofer-Institut für Bauphysik. Acoustic tests for regenerated noise at grilles and dampers in high air flow speed conditions. Fraunhofer-Institut für Bauphysik, Institutsteil Holzkirchen; 2004. Report No.: 588-009-53361-L08-001-000-01. |
|
5. |
Howe MS, Baumann HD. Noise of gas flows. In Beranek LL, Vér IL, editors. Noise and vibration control engineering. 1st ed.: Wiley; 1992. p. 519-563. |
|
6. |
NEBB. Sound and vibration design and analysis. Rockville: National Environmental Balancing Bureau; 1994. |
|
7. |
Heller HH, Franken PA. Noise of gas flows. In Beranek LL, editor. Noise and vibration control.: McGraw-Hill; 1971. p. 522-527. |
|
8. |
Hubert M. Untersuchungen über Geräusche durchströmter Gitter (Investigation into noise from grilles). Technische Universität Berlin; 1969. |
|
9. |
Wood AB. A textbook of sound. 3rd ed.: G Bell & Sons; 1955. |
|
10. |
Iudin EI. The acoustic power of the noise creatd by airduct elements. Soviet Physics—Acoustics. 1955; 1: 383-389. |
|
11. |
Strutt (3rd Baron Rayleigh) JW. Ælion tones. Philosophical Magazine and Journal of Science. 1915; 29(172): 433-444. |
|
12. |
Sutherland W. The viscosity of gases and molecular force. Philosophical Magazine Series 5. 1893; 36(223): 507-531. |
|
13. |
Hilsenrath J, Beckett WSB, Fano L, Hoge HJ, Masi JF, Nuttal RL, et al. Tables of thermal properties of gases: US Department of Commerce; 1955. |
|
14. |
Gordon CG. Spoiler-generated flow noise. I. The experiment. Journal of the Acoustical Society of America. 1968; 43(5): 1041-1048. |
|
15. |
Gordon CG. Spoiler-generated flow noise. II. Results. Journal of the Acoustical Society of America. 1969; 45(1): 214-223. |
|
16. |
Heller HH, Widnall SE, Gordon CG. Correlation of fluctuating forces with the sound radiation from rigid flow spoilers. NASA Contractor Report CR-1340. Bolt Beranek & Newman; 1969. |
|
17. |
Heller HH, Widnall SE. Sound radiation from rigid flow spoilers correlated with fluctuating forces. Journal of the Acoustical Society of America. 1970; 47(3): 924-936. |
|
18. |
Graham JB, Faulkner LL. Fan and flow system noise. In Faulkner LL, editor. Handbook of industrial noise control.: Industrial Press; 1976. p. 386-438. |
|
19. |
Nelson PA, Morfey CL. Aerodynamic sound production in low speed flow ducts. Journal of Sound and Vibration. 1981; 22(2): 263-289. |
|
20. |
Nelson PA, Morfey CL. Corrigendum/erratum to: Aerodynamic sound production in low speed flow ducts. Journal of Sound and Vibration. 2009; 328(1-2): e1. |
|
21. |
Nelson PA. Aerodynamic sound production in low speed flow ducts. PhD thesis. University of Southampton, Institute of Sound and Vibration Research; 1980. |
|
22. |
Oldham DJ, Ukpoho AU. A pressure-based technique for predicting regenerated noise levels in ventilation systems. Journal of Sound and Vibration. 1990; 140(2): 259-272. |
|
23. |
Waddington DC, Oldham DJ. Generalized flow noise prediction curves for air duct elements. Journal of Sound and Vibration. 1999; 222(1): 163-169. |
|
24. |
Oldham DJ, Waddington DC. The prediction of airflow-generated noise in ducts from considerations of similarity. Journal of Sound and Vibration. 2001; 248(4): 780-787. |
|
25. |
Oldham DJ, Waddington DC. Aerodynamic sound generation in low speed ducts. In Handbook of noise and vibration control.: John Wiley & Sons; 2007. p. 1323-1327. |
|
26. |
Waddington DC, Oldham DJ. Noise generation in ventilation systems by the interaction of airflow with duct discontinuities: Part 1 bends. Building Acoustics. 2007; 14(3): 179-201. |
|
27. |
Waddington DC, Oldham DJ. Noise generation in ventilation systems by the interaction of airflow with duct discontinuities: Part 2 take-offs. Building Acoustics. 2008; 15(1): 49-71. |
|
28. |
Kårekull O, Efraimsson G, Åbom M. Prediction model of flow duct constriction noise. Applied Acoustics. 2014; 82: 45-52. |
|
29. |
Kårekull O. Predicting flow-generated noise from HVAC components. Stockholm:; 2015. |
|
30. |
Kårekull O, Efraimsson G, Åbom M. Revisiting the Nelson–Morfey scaling law for flow noise from duct constrictions. Journal of Sound and Vibration. 2015; 357: 233-244. |
|
31. |
Lighthill MJ. On sound generated aerodynamically I. General theory. Proceedings of the Royal Society A. 1952; 211: 564-587. |
|
32. |
Lighthill MJ. On sound generated aerodynamically II. Turbulence as a source of sound. Proceedings of the Royal Society A. 1954; 222: 1-32. |
|
33. |
Fitzpatrick HM, Lee R. Measurements of noise radiated by subsonic jets. Washington DC:; 1952. |
|
34. |
Fisher MJ, Morfey CL. Jet noise. In White RG, Walker JG, editors. Noise and vibration.: Ellis Horwood; 1982. p. 307-336. |
|
35. |
Kandula M. On the scaling laws and similarity spectra for jet noise in subsonic and supersonic flow. International Journal of Acoustics and Vibration. 2008; 13(1): 3-16. |
|
36. |
Bies DA, Hansen CH, Howard CQ, Hansen KL. Engineering noise control. 6th ed.: Taylor & Francis Group; 2024. |
|
37. |
Heitner I. How to estimate plant noises. Hydrocarbon Processing. 1968; 47(12): 67-74. |
|
38. |
Powell A. Flow noise; A perspective on some aspects of flow noise, and of jet noise in particular—Part I. Noise Control Engineering. 1977; 8(2): 69-80. |
|
39. |
Baumann HD, Coney WB. Noise of gas flows. In Vér IL, Beranek LL, editors. Noise and vibration control engineering. 2nd ed.: John Wiley & Sons; 2006. p. 611-658. |
|
40. |
Ahuja KK, Sankar LL, Englar RJ, Munro SE, Li Y, Gaeta RJ. Application of circulation control technology to airframe noise reduction. Hampton, Virginia, US:; 2003. |
|
41. |
Oerlemans S, de Bruin AC. Reduction of landing gear noise using an air curtain. Amsterdam, The Netherlands:; 2009. Report No.: NLR-TP-2009-403. |
|
42. |
Henrywood RH, Agarwal A, Kanjere K. The aeroacoustics of a subsonic rectangular jet. In 22nd AIAA/CEAS Aeroacoustics Conference; 2016; 30 May – 1 June 2016, Lyon, France. |
|
43. |
Kanjere K, Desvard L, Nicolas F, Henrywood RH, Agarwal A. Empirical modelling of noise from high aspect ratio rectangular jets. International Journal of Heat and Fluid Flow. 2016; 62, Part A(2016): 1-9. |
|
44. |
von Gierke HE. Aircraft noise sources. In Harris CM, editor. Handbook of noise control.: McGraw-Hill Book Company; 1957. |
|
45. |
Tam CKW, Golebiowski M, Seiner JM. On the two components of turbulent mixing noise from supersonic jets. In 2nd AIAA/CEAS Aeroacoustics Conference; 1996; 6-8 May 1996, State College, US: American Institute of Aeronautics and Astronautics. |
|
46. |
Tam CKW, Viswathan K, Ahuja KK, Panda J. The sources of jet noise: Experimental evidence. Journal of Fluid Mechanics. 2008; 615: 253-292. |
|
47. |
Tam CKW. A phenomenological approach to jet noise: the two-source model. Philosophical Transactions of the Royal Society A. 2019; 377(20190078). |
|
48. |
Bjørnø L, Larsen PN. Noise of air jets from rectangular slits. Acustica. 1984; 54(5): 247-256. |
|
49. |
Brown C, Podbury G. Jet-surface interaction noise from high-aspect ratio nozzles: Test summary. In 23rd AIAA/CEAS Aeroacoustics Conference; 2017; 5-9 June 2017, Denver, US: American Institute of Aeronautics and Astronautics. |
|
50. |
Bridges JE. Noise from aft deck exhaust nozzles—Differences in experimental embodiments. In SciTech Forum, 52nd Aerospace Sciences Meeting; 2014; 13-17 January 2014, National Harbor, US: American Institute of Aeronautics and Astronautics. |
|
51. |
Stone JR. Prediction of in-flight exhaust noise for turbojet and turbofan engines. Noise Control Engineeing. 1978; 10(1): 40-46. |
|
52. |
Sharland I. Woods Practical Guide to Noise Control Colchester: Woods; 1972. |
|
53. |
Sound Research Laboratories. Noise control in building services Oxford: Pergamon Press; 1988. |
|
54. |
BSI. BS EN IEC 61260-1:2014 Electroacoustics—Octave-band and fractional-octave-band filters. Part 1: Specifications. ; 2014. |
|
55. |
Wong GSK, Embleton TFW. Variation of the speed of sound in air with humidity and temperature. Journal of the Acoustical Society of America. 1985; 77(5): 1710-1712. |
|
56. |
Blevins RD. Review of sound induced by vortex shedding from cylinders. Journal of Sound and Vibration. 1984; 92(4): 455-470. |
Supporting materials
Grille flow-generated sound test data
Footnotes
- A historical overview of developments concerning sound generation by cylinders in flow is provided by Blevins (56).
- The author E. I. Iudin has also authored English-language scientific publications on aeroacoustics (or Russian-language publications translated into English) as ‘E. J. Judin’ and ‘E. Y. Yudin’ (a reflection of the ambiguity of the Russian phoneme).
- For ‘wide grids or individual cylindrical rods’, Hubert infers a slightly larger value of ~0.21 from the reported test data (8).
- For the potential tunnel application considered, the value of was expected to be < 0.1. ↑
- The proportionality of the acoustic power to the product (where ) reveals the jet acoustical dependence on the ‘eighth power’ of the flow velocity.
- In the case of the potential tunnel application considered, air curtain flow temperatures were expected to be ~32°C, with a difference (Δ) of +2°C (or, equivalently, 2 Kelvins) from the ambient. ↑
- The octave-band normalised similarity spectra shown in Figure 4 have been derived from the original narrowband linear frequency resolution formulae included in the Supporting Materials, in a similar manner to that described in ref (40), and have been normalised to yield a total sound level of 0 dB for the frequency range shown.
- National Environmental Balancing Bureau, as cited in the CIBSE Guide B4 (2), and based on a simplification of Heller & Franken (7).
- This is another version of the Hubert (8)-based approach, citing Baumann & Coney (39), which is a later edition of the same information presented by Heller & Franken (7).
- This was included as it offers a highly simplified model relying only on the flow velocity and duct dimensions, and is commonly referenced in engineering reports.
- Sound Research Laboratories, which provides another highly simplified model and is also commonly referenced in engineering reports. This model is limited to overall sound power levels, so the spectral terms from Sharland (52) have been applied to aid comparison.
- Prediction results presented have been made using values for the sound speed calculated using the empirical approach of Wong & Embleton (55), assuming a relative humidity of 50%, dry air molar mass of 0.02895 kgmol-1, and universal gas constant value of 8.3145 JK-1mol-1, with air density calculated as , where is static atmospheric pressure at ground level, assumed to take a value of 101325 Pa, and is the specific gas constant for dry air, assumed to take a value of 287.058 Jkg-1K-1.
- For brevity, the SRL grille ref A results are not shown in Figure 6 as these are simply an affine-transformed version of the Sharland results, shifted down the sound power axis and resulting in larger errors.
- Again, for brevity, the Bies et al (36) model results are not shown in Figure 6, as this is a compact formulation of Heller & Franken (7), and so yields almost identical results.
- Calculated as described in footnote 12.
- The coefficient values in Equation 16 have been obtained using a nonlinear least squares Levenberg-Marquardt optimisation algorithm.
Peer review
- Oliver BewesHS2 Ltd


