Digital mapping of environmental significant effects on HS2 Phase 2a
Protected species constraints are an early consideration for nearly every development project, and where impacts cannot be avoided mitigation licensing is a legal requirement. HS2 Ltd are the licensee for a great crested newt organisational licence, as part of the Phase One works; the largest such licence ever issued by the regulator for a single development.
This paper identifies how the standard paradigm for protected species licences and their management had to be completely re-designed and new structures, processes and templates developed and implemented to ensure effective use of a limited resource and cost-effectiveness in delivery.
The measures and processes that have been established, through careful design, an understanding of lessons learnt and working closely with stakeholders, are providing successful management of a complex organisational licence and its delivery. The approach has applications to the other phases of HS2 as well as further application to other development projects, particularly those involving linear infrastructure.

The HS2 Phase 2a Environmental Statement
The Environmental Statement (ES) produced for HS2 Phase 2a (‘the Scheme’) as part of the hybrid Bill sets out impacts and environmental significant effects caused by the construction and operation of the Scheme on the environment and people. The Phase 2a environmental impact assessment (EIA) must fulfil the requirements of the Town and Country Planning (Environmental Impact Assessment) Regulations 2017 which reflect European Union (EU) Directive requirements for assessment of the effects of certain public and private projects on the environment. The ES therefore covers:
- a description of the proposed development comprising information on the site, design, size and other relevant features of the development;
- a description of the likely significant effects of the proposed development on the environment;
- a description of any features of the proposed development, or measures proposed in order to avoid, prevent or reduce the likely significant adverse effects on the environment;
- a description of the reasonable alternatives studied by the developer, which are relevant to the proposed development and its specific characteristics, and an indication of the main reasons for the option chosen, taking into account the effects of the development on the environment; and
- a non-technical summary of the information above.
The information contained in the ES must be in sufficient detail to inform the decision-maker as part of the development consent process.
A total of 15 environmental topics are assessed in the ES, across the approximately 58km route. All aspects of the construction and operation of Phase 2a are considered, such as highways and utilities diversions, construction activities (including construction vehicle movements, construction compounds and worker accommodation), and measures to mitigate environmental significant effects (including ecological planting and noise attenuation).
In common with other recent environmental statements reports for large infrastructure projects, the full suite of documents comprising the Phase 2a ES is extremely long and complex. Findings are reported across a number of volumes. These comprise:
- Non-technical summary;
- Volume 1: Introduction and methodology;
- Volume 2: Community area reports and maps;
- Volume 3: Route-wide effects;
- Volume 4: Off-route effects;
- Volume 5: Route-wide environmental reports and maps;
- Volume 5: Environmental reports and maps by community area; and
- Volume 5: Supporting information and planning.
Figure 1 shows one copy of the set of Supplementary Environmental Statement 2 (SES2) and Additional Provision 2 Environmental Statement (AP2 ES) documents.

The increasing length of ES documents is widely recognised in current EIA practice. For example, the Institute of Environmental Management and Assessment’s (IEMA) guidance document on Delivering Proportionate EIA[1] links this to:
“the increased complexity of multi-faceted decisions and the wider range of stakeholders who seek transparency and clear audit trails”, and “the UK’s evidence-based and precautionary approach”.
The drawback of the increased level of detail required in modern EIAs is that information can be hard to locate, particularly for readers who are not technical specialists. This includes both external stakeholders such as local community groups, and internal stakeholders such as designers and contractors working on the project. These internal stakeholders need to navigate the ES text to identify environmental impacts and environmental significant effects to design and carry out works with due consideration of the key issues and constraints.
Making the Environmental Statement more accessible
To help users to navigate the ES, a Non-technical Summary and a Guide to the HS2 Environmental Statement have been produced and published online. These provide a high-level overview of the significant effects, and signposting to where information can be found in the reports. As EIA practitioners increasingly seek to provide ES information in a digital format, various online or interactive solutions are currently being trialled. These ‘digital EIAs’ are often PDF versions of the ES, available online, with some additional cross-referencing or visualisation tools.
In common with most modern EIA projects, the Phase 2a environment team has also made extensive use of GIS information. This includes recording baseline data from surveys and external datasets, showing mitigation measures and carrying out impact assessments.
This work goes beyond both these methods and the mapping tool uniquely brings together the two aspects, to provide searchable and detailed information on significant effects in a single GIS platform showing the breadth of information alongside the depth of data embedded into each element as digital metadata that can be instantly accessed.
Environmental minimum requirements
In addition to providing information for stakeholders and decision makers, the environmental significant effects reported in the ES are used to inform the Environmental Minimum Requirements (EMRs). The EMRs set out the environmental and sustainability commitments that will be observed in the construction of the Scheme. They are contractually binding on designers and contractors as the Scheme progresses through subsequent stages of design and construction. The EMRs consist of a Code of Construction Practice, a Planning Memorandum, a Heritage Memorandum, an Environmental Memorandum and the Undertakings and Assurances given to Parliament and to petitioners during the passage of the hybrid Bill. Along with the powers contained in the High Speed Rail (West Midlands to Crewe) Act, the EMRs will ensure that impacts and environmental significant effects which have been assessed in the ES will not be exceeded.
It is therefore important that the assessment reported in the ES is well understood so it can be considered as part of any changes to and evolution of the design, including changes to the construction schedule and/or construction methodology. Exceedance of environmental significant effects reported in the ES may mean that HS2 Ltd does not have the appropriate powers to construct or operate the scheme.
Benefits of the Digital Mapping Tool
Whilst the suite of ES documents fulfils its primary purpose of reporting impacts and environmental significant effects caused by the Scheme, it has been supplemented by the development of a digital mapping tool. Spatial data is much quicker to use, easier to understand and can be adapted to only show pertinent information to the user. Designers, contractors and HS2 Ltd can use the geodatabase and maps as a main point of reference for impacts and environmental significant effects caused by the Scheme, allowing them to see visually the interrelationships between receptors, construction and operation activities, and the impacts and environmental significant effects reported. Users can also have the ability to filter information and zoom to specific locations of interest. In order to assess design changes to the scheme, three environmental statements have been submitted to Parliament (Main ES, SES & AP ES, and SES2 & AP2 ES). Only the significant effects that will result from the final design are shown on the mapping tool. This makes it easier for a user to understand the likely final effect.
The tool will enable the ES documents to be easily accessed and read by users, with multiple benefits including:
- bringing together all significant effects and information on receptors into one database which can be sorted and searched by users more easily than existing maps and reports;
- identifying the impacts and environmental significant effects associated with the Scheme and determining if a proposed design change would exceed the impacts and effects and therefore be not compliant with the EMRs;
- planning and sequencing works more efficiently through better knowledge of the interaction between receptors and environmental significant effects at a particular location, delivering programme benefits;
- assessing the change in impacts and environmental significant effects on receptors more accurately, ensuring improved assurance and improved environmental outcomes;
- use by all (including stakeholders) to understand the impacts and environmental significant effects of the project easily, quickly and efficiently;
- engaging with stakeholders and building relationships, enhancing stakeholder perception for example, as part of engagement with communities and local authorities;
- ensuring transparency in information; and
- allowing users to see and easily compare environmental data, overlay with new data once gathered (e.g. future surveys) enabling decisions to be made more quickly.
For design and planning purposes, the route is split into approximately 200 design elements, such as viaducts, culverts, or road diversions etc. Using detailed knowledge of these design elements and the significant effects, the two datasets have been linked. The user can search for the specific part of the scheme that gives rise to an effect, or a contractor building a design element can understand all the effects associated with it.
Development of the tool
Arup and ERM have produced an innovative digital mapping tool for HS2 Ltd, which will help bring about the benefits listed above. This tool shows all environmental significant effects that are caused by the Scheme on a virtual map and is unique for a large linear project.
During the development of the tool, workshops were carried out with HS2 Ltd to agree its structure and features, both at the proof of concept stage and during population of the database. This gave all teams that may use the tool in the future the opportunity to influence the content and features. An ongoing review and feedback process from HS2 Ltd ensured that the tool would meet their requirements.
The digital mapping tool was developed in a staged approach, using a geodatabase that records all the environmental significant effects reported in the ES. A key innovation with this significant mapping tool is the number of different inputs that have been combined to produce the database. This process is shown in Figure 2.
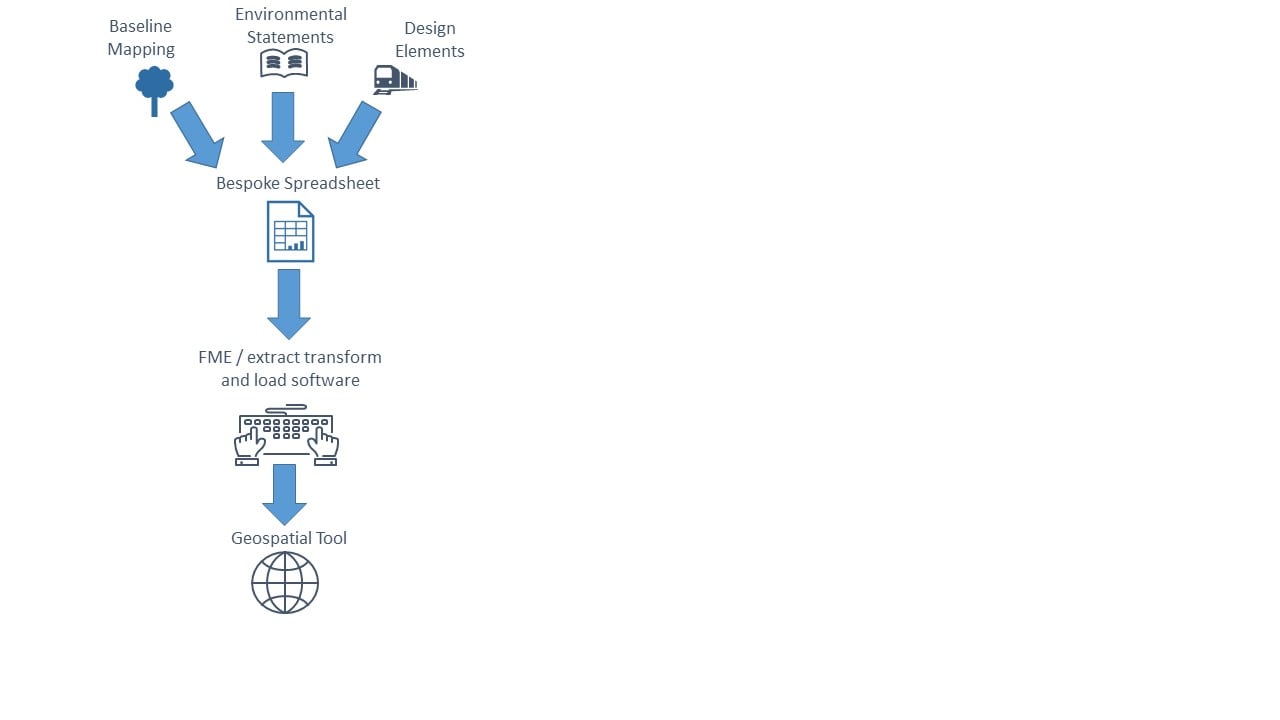
A spreadsheet listing all environmental significant effects reported in the ES was imported into the geographical information system (GIS) platform using ‘extract transform and load’ software. After registering all the rows of data for each topic, the team held discussions with the topic leads to identify the appropriate sources of data for each receptor. In general, these were GIS datasets used in the ES mapping, but in some cases survey data or bespoke datasets were created. Data from the spreadsheet was converted to location data based on receptor names. Checks were carried out to ensure all data was imported once, and all details about the environmental significant effects had been captured. Environmental significant effects were shown in the mapping tool as points, lines or polygons, according to the type of receptor.
Each record includes all the necessary information to understand the environmental significant effect at a high level, including the receptor affected and the source of the impact. As the mapping tool is not intended to replace the level of detail included in the ES, a paragraph reference is provided for each environmental significant effect to allow the user to explore this further if needed. This also provides a clear audit trail. A list of the topics mapped, and information provided, is shown in Table 1. Other topics covered in the ES, (climate change, major accidents and natural disasters, and waste and material resources) are not shown on the digital mapping tool as they are not linked to spatially-defined receptors.
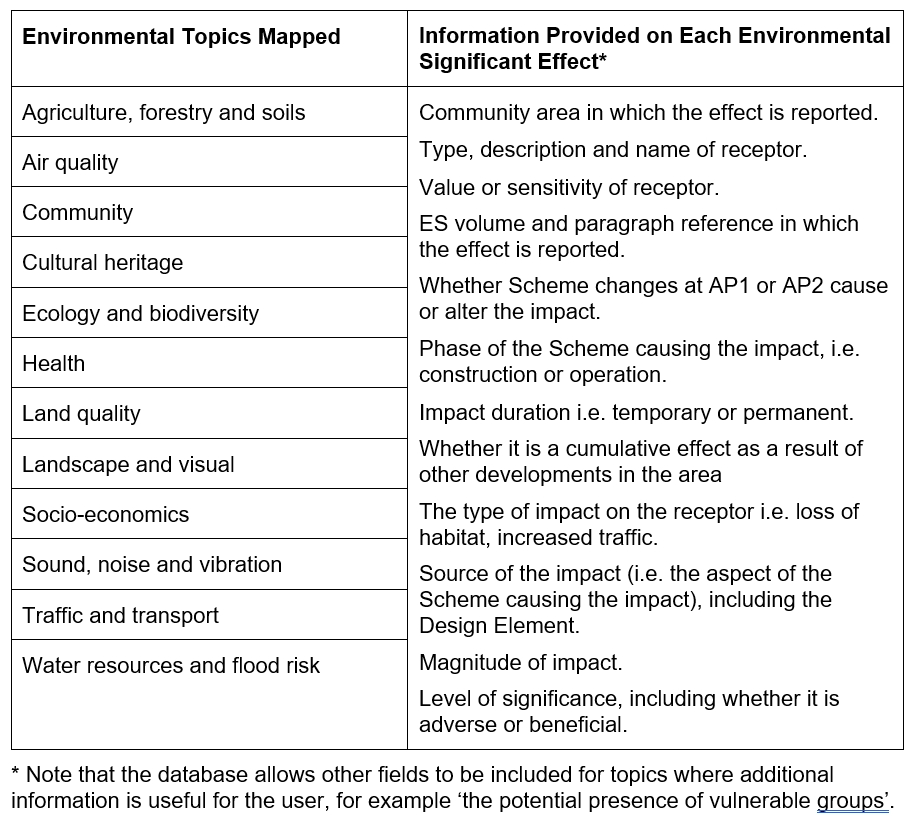
Figure 3 shows the level of detail provided for each significant effect, and the baseline data about the receptor. This allows the user to easily obtain more information from the environmental statement than could be provided in a non-technical summary.
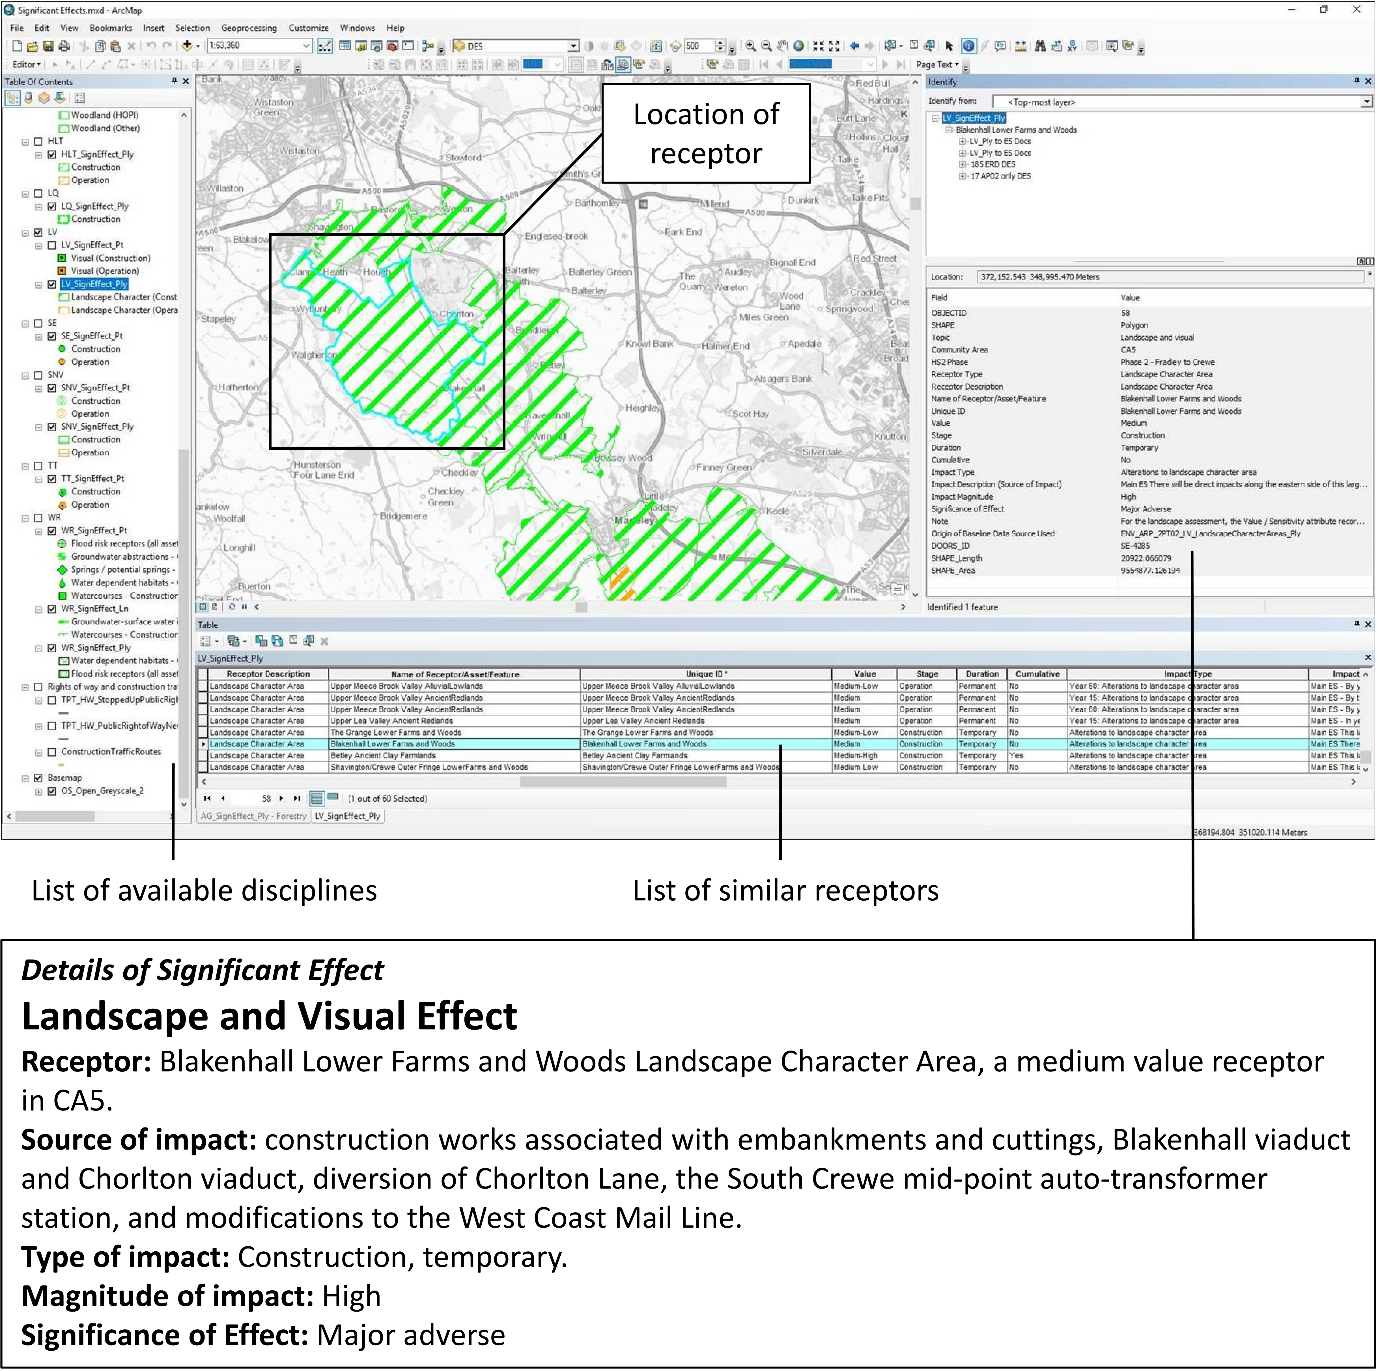
In contrast to the ES, which by its nature is a text-based document arranged in topic chapters, the mapping tool allows the user to filter and view the data in many different ways. For example, environmental significant effects can be viewed by topic, at a specific location such as a community, or all impacts can be identified that are linked to a particular design element key to generating that impact, such as a viaduct.
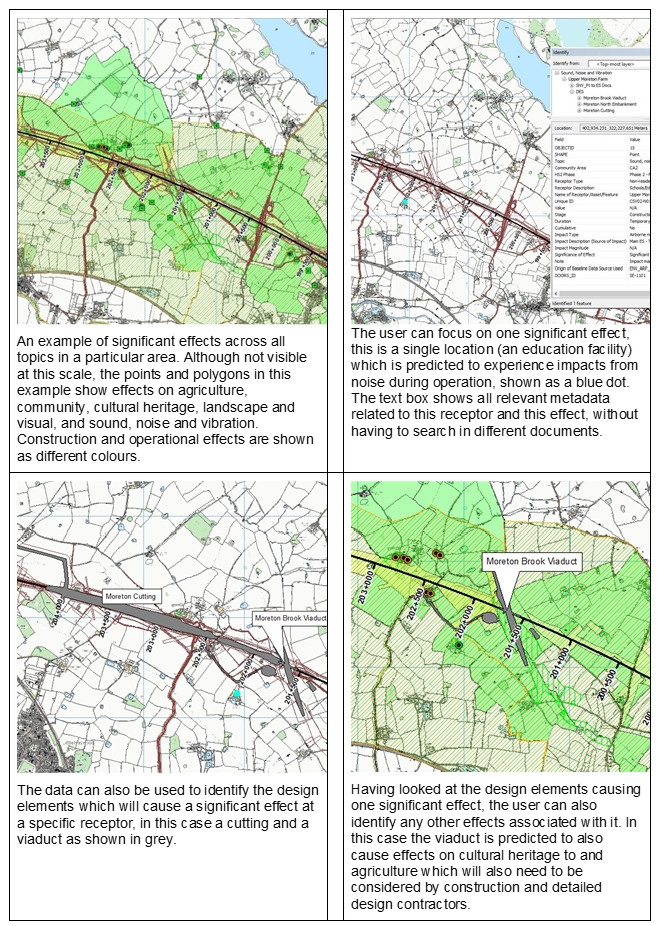
The following examples demonstrate how the tool can be used to understand significant effects data in different ways (Figure 4). The user can obtain detailed information about the aspect that is relevant to them, with links to Environmental Statements for the wider context.
Potential uses
There are several groups of contractors who will benefit from the tool, including the main contractors and their subcontractors, early environmental works contractors, specialist sub-teams (for example those creating mitigation planting), highways’ contractors, designers, planners and logistics specialists, quantity surveyors, environment managers, and compliance managers. The tool will enable consistent information to be used across all contractors. There is also potential for increased efficiency of site visits if contractors can highlight more easily which areas require visits and can arrive briefed with an advanced knowledge of the surrounding area issues. This database could also be overlaid with other existing databases, for example the mitigation register, to provide additional context to contractors. For example, adding the location of proposed environmental mitigation measures such as habitat creation, could show where there is a direct link between environmental significant effects and mitigation. The survey data capturing tool Esri Collector App has been developed using the same GIS platform which will allow the environmental significant effects to be overlaid with surveys as the design progresses. This would allow users to link environmental significant effects reported in the ES with the latest survey data.
Information on impacts and environmental significant effects is also of interest to stakeholders. The tool can support engagement with stakeholders and building relationships, enhancing stakeholder perception; for example, as part of engagement with communities and local authorities. The tool currently uses a GIS-specific platform but could be easily transferred to an online web-map, that non-specialists could access, controlled through an authorised login process if necessary.
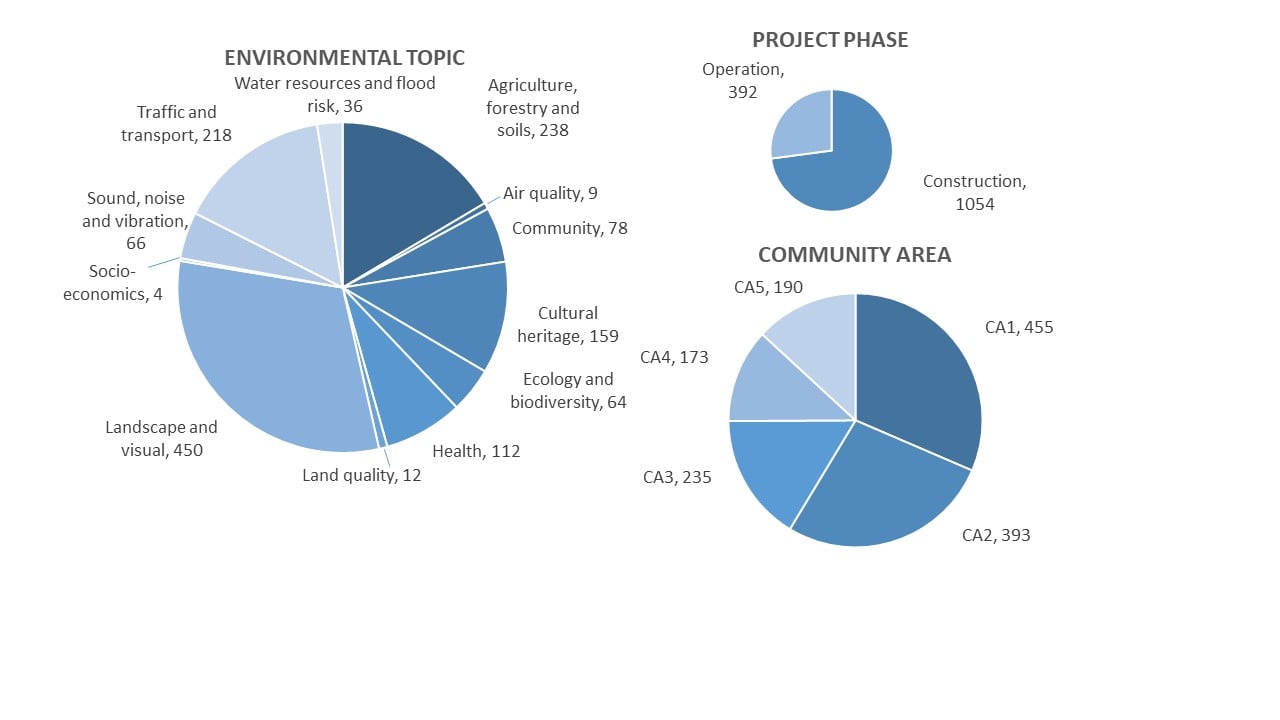
Now that the database has been populated with the environmental significant effects reported in the ES, the data can be quickly filtered and analysed in many different ways. The database shows that the suite of Phase 2a ES documents report a total of 1446 environmental significant effects, of which 75 are cumulative effects caused by the Scheme in combination with other developments in the area including HS2 Phase One. Figure 5 provides a selection of other datasets that can be easily obtained from the mapping tool, to inform the project team and stakeholders. The use of a single database and consistent approach for all environmental topics means that environmental significant effects can be compared across topics. The user can see how topics inter-relate, as well as understanding in-combination significant effects (i.e. environmental significant effects due to impacts from several different topics on a particular receptor).
Photomontages and photos from viewpoints have been included in the current iteration of the mapping tool, but other images could also be included, for example photos from site visits or cultural heritage assets.
Depending on how HS2 Ltd wanted to use the tool, it could be made available online. It is currently used by internal parties within HS2 Ltd using GIS software. The digital mapping tool will become an essential tool for HS2 Ltd for the next decade and will support the development of the Scheme through future design and construction phases. This approach of combining various datasets into an interactive package that supports the ES can be used across all large EIA projects. This feeds into current thinking on making impact assessments more streamlined and the use of digital tools within EIA. The methodology of the tool development, including the spreadsheet design, could also be transferred to Phase 2b where lessons learnt discussions have already commenced. It could also be used in different aspects of the scheme to communicate intent including stakeholder workshops, reviews, public consultation, contractor briefings and for gaining approvals.
Acknowledgements
This work was carried out by members of the Arup and ERM Phase 2a environment team, in collaboration with HS2 Ltd and involved a wide range of expertise including environmental and GIS skilled staff. Environmental significant effects data was extracted from the ES by the HS2 Ltd Engineering Delivery Partner (Jacobs, Atkins and Sener) and assured by HS2 Ltd.
References
[1] IEMA (2017) Delivering Proportionate EIA – A Collaborative Strategy for Enhancing UK Environmental Impact Assessment Practice.
Peer review
- Clive PaulseGIS Lead, HS2 Ltd