Driving efficiency and sustainability in material reuse through GeoBIM
With over 21 million cubic metres of material (equivalent to 8,400 Olympic swimming pools) earmarked to be excavated and moved across the 90 km of the northern section of the High Speed Two (HS2) Phase One route, an accurate understanding of the material types for the re-use of materials in earthworks is a prerequisite for the efficient delivery of construction and optimal use of materials. Such an understanding is not only important to ensure the earthworks meet the technical standards but also to minimising the carbon footprint associated with the re-use of materials during construction.
Conventional methods for assessing the suitability for reuse of excavated material focus is on a statistical review of ground investigation data against the Specification of Earthworks (SCEW) Series 0600 supported by 2D long sections. However, this does not always give a clear indication of the spatial distribution of materials in 3D across the length and breadth of the assets and therefore the proportions generated once practicalities of separating material are considered. This restricts the opportunity to refine the mass haul strategy and potentially leaves significant residual risks to be managed during construction. This can have significant cost, environmental and carbon implications, particularly if additional material needs to be imported or sent to landfill.
This paper will outline a digital evaluation approach adopted by the Integrated Project Team (IPT) on N1N2 utilising a 3D ground model and asset design models to unlock the optimisation of the mass haul strategy. The cost savings, risk reduction and sustainability benefits will be detailed through a series of case studies across the N1 and N2 contracts on the northern section of the Phase one route. The technique is expected to continue to bring benefits through detailed design and construction, but the benefits also extend beyond HS2 to infrastructure projects where a mass haul strategy is required.
- Written by
-
Jonny Neville (Mott MacDonald/BBV)

-
Peter Fair (Mott MacDonald/BBV)

-
Christopher Brook (Mott MacDonald/BBV)

-
Nigel Pye (Mott MacDonald/BBV)

-
Sam Boden (Balfour Beatty/BBV)

- Resource type
- Resource type: Technical Paper
- Intended audience
- Consultants
- Contractors
- Engineers
- Professionals
- Tags
- BIM posts
- design posts
- GIS posts
- sustainability posts
Introduction
To support the UK’s transition to net zero High Speed Two (HS2) has committed to reducing carbon emissions by at least 50% during construction and operation1 of the project. This translates to a reduction of circa 2 million tonnes of CO2 across Phase One Area North. Area North is the northern section of High Speed Two (HS2) Phase One and N1N2 is the Main Works Civils Contract (MWCC) which includes Long Itchington Wood Green Tunnel to Delta Junction and Birmingham Spur and the Delta Junction to the West Coast Main Line (WCML) tie-in, being delivered by the BBV Integrated Project Team (IPT).
Given the high volume of earthworks in N1N2 and the construction of embankments is one of the largest sources of carbon emissions, the IPT have identified mass haul efficiencies as one of the key objectives to achieve this target. In practical terms this means minimising the unnecessary transportation, treatment and disposal of ‘site won’ material and reducing the amount of material imported.
One of the ways that the IPT has risen to this challenge is by combining 3D ground modelling and numerical modelling to better estimate the proportions and distribution of each earthwork material class within cuttings and deep excavations across the route. This digital engineering technique was initially piloted on two cuttings (Offchurch Cutting and Diddington Cutting) before being rolled out across a further 17 earthwork assets (cuttings and some tunnel portal excavations).
Approach
The Specification for Highways Works2 has long provided the framework for earthworks fill classification in the United Kingdom. Mass haul assessments have traditionally focussed on statistical analysis of ground investigation data alongside 2D geological long sections. This provides a high-level assessment, but the lack of spatial analysis leaves significant ‘unknowns’. This can lead to conservative assessments of ‘site-won’ material or significant residual risks to be managed during construction. It also leads to more intense review of excavation materials as they are won.
To overcome this the IPT developed a new GeoBIM (i.e., integration of geological information and Building Information Modelling) assessment technique based on a 3D spatial assessment of ground investigation data within earthworks excavations to support the classification of in situ material prior to excavation. An overview of the approach is presented in Figure 1.
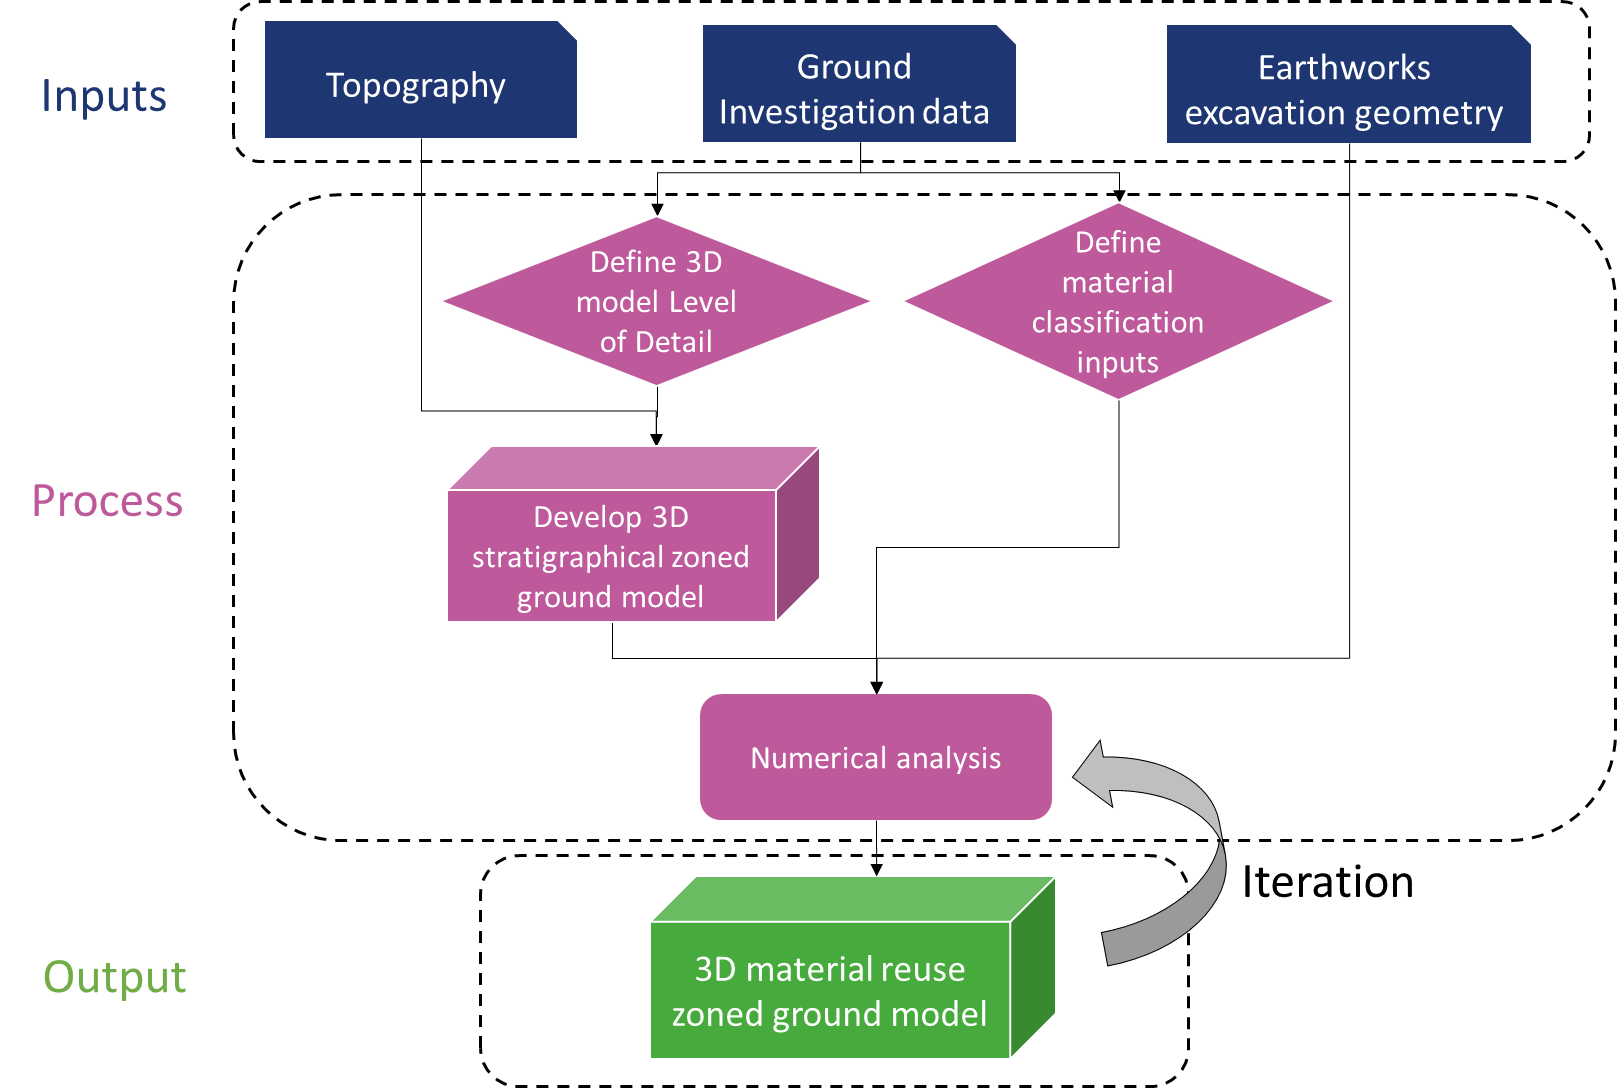
Model inputs and requirements
There are three inputs into the 3D geological models (whether that be zoned by stratigraphy or materials reuse characteristics):
- ground investigation data;
- topography; and
- design models (earthworks excavation geometry).
Ground investigation data
To understand how a material can be re-used on site it must be assigned a ‘fill classification’. The Specification for Civil Engineering Works, Series 600, Earthworks (SCEW) provides the framework for earthworks fill classification in the UK3 and has been adopted for HS2 works. The primary fill classes that will be generated from the excavated material across the northern section of High Speed Two (HS2) Phase One are outlined in Table 1.
| HS2 SCEW Class | Description |
|---|---|
| Class 1 | General granular fill |
| Class 2A | General ‘wet’ cohesive fill |
| Class 2B | General ‘dry’ cohesive fill |
| Class 7E/F/I | Selected cohesive fill for stabilisation with lime |
| Class 4 | General landscape fill |
The key properties that define which of the above SCEW fill class a material is assigned are:
- Particle Size Distribution (PSD);
- plasticity;
- moisture state;
- slake durability; and
- Total Potential Sulphate (TPS).
The properties associated with each material class that are included in the numerical modelling are summarised in Table 2.
| Earthwork material property | Class 1 | Class 2A | Class 2B | Class 7E/F/I | Class 4 |
|---|---|---|---|---|---|
| Material type and application | Granular Fill/Mainline & Highway | Cohesive Fill/Mainline LEF & Highway | Cohesive Fill/Mainline LEF & Highway | Cohesive/ Mainline lime treatment | Granular/ Cohesive landscape |
| Liquid limit | yes | yes | yes | yes | yes |
| PSD – % fines (passing 63micron sieve) | yes | yes | yes | n/a | n/a |
| Moisture state (PL-MC) | n/a | yes | yes | n/a | n/a |
| Total potential sulfate | n/a | n/a | n/a | yes | yes |
| Slake durability* | yes | n/a | n/a | n/a | n/a |
* only required for rock classification
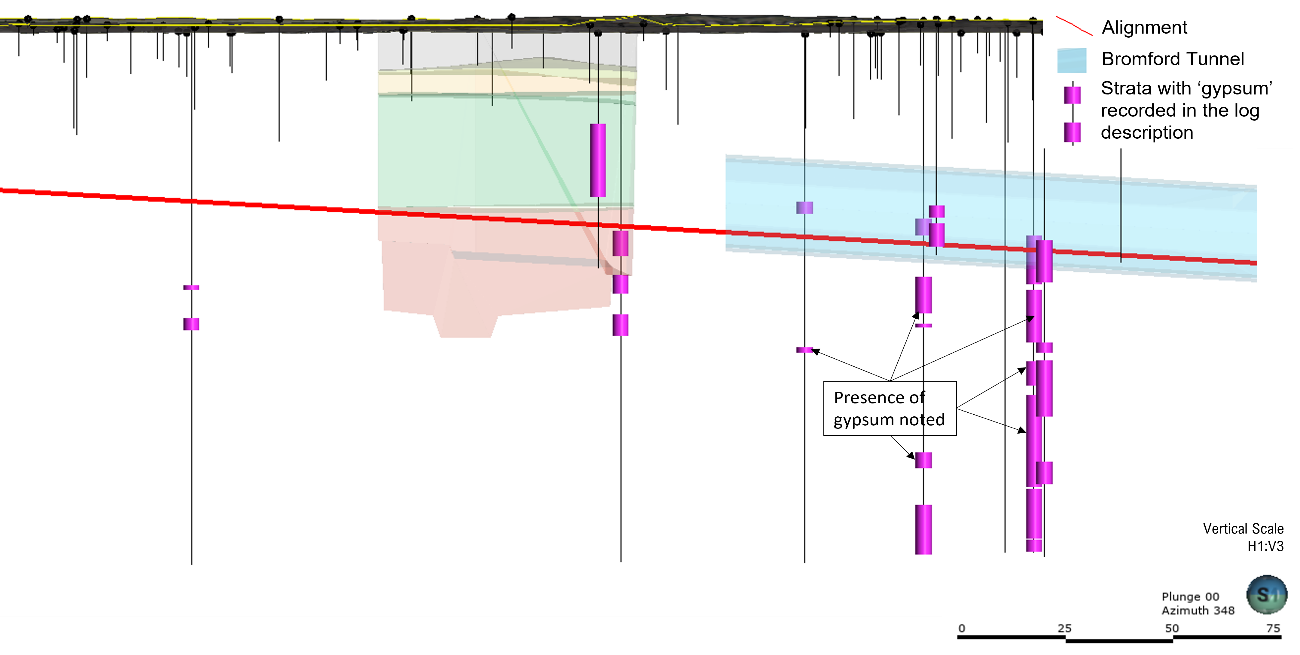
Because of the nature of descriptive information detailed in geological logs (e.g., presence of gypsum) it could not be easily incorporated into the numerical modelling. Instead, the information is presented alongside the numerical modelling output within the final model (Figure 10).
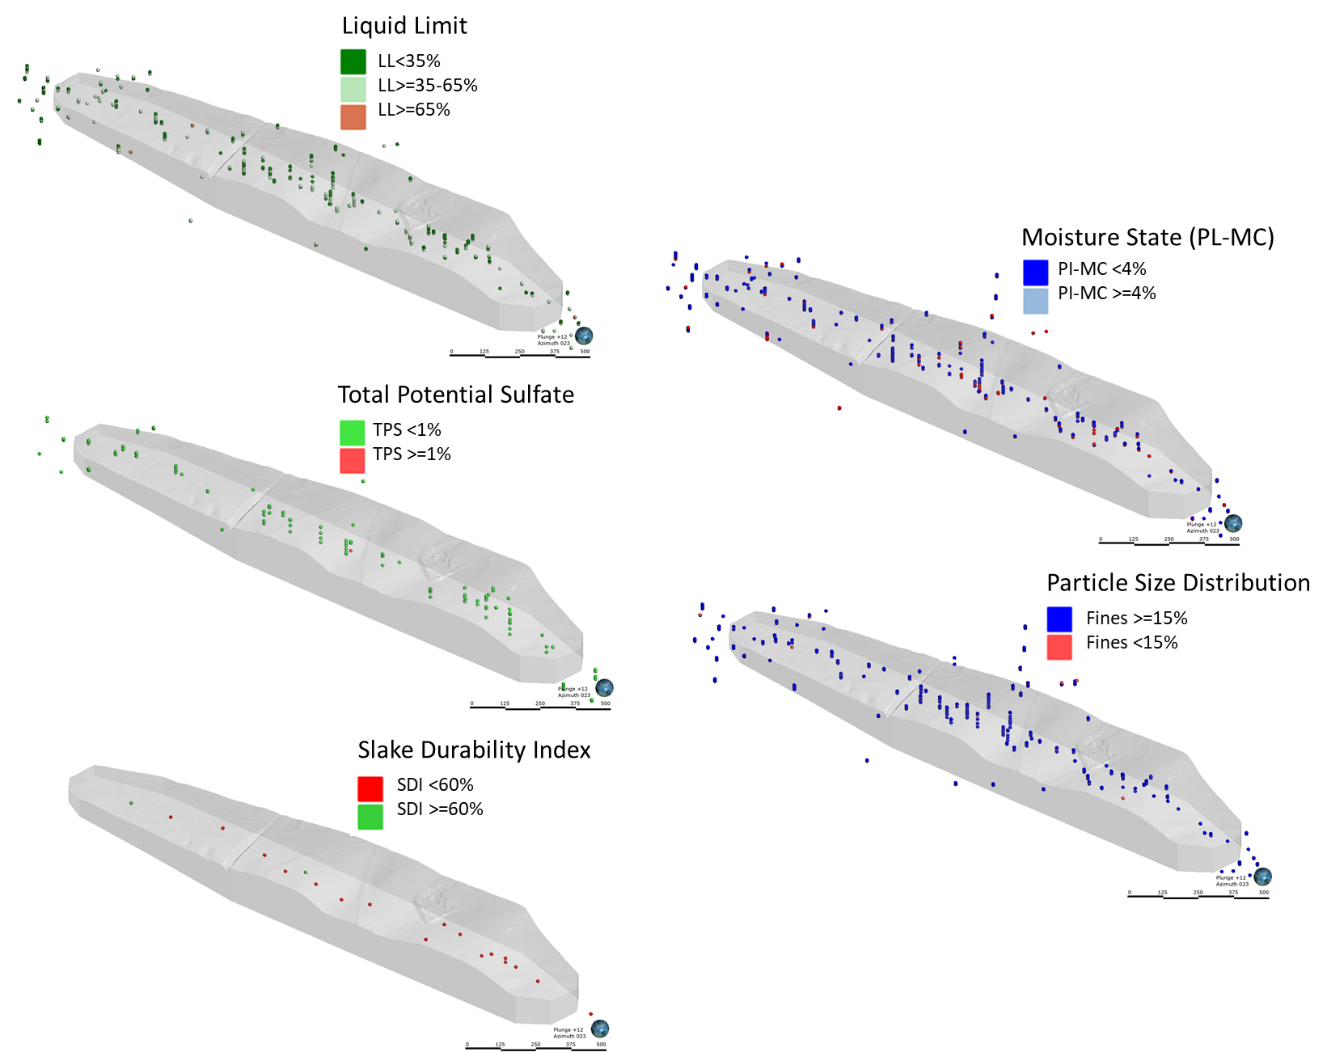
Ground investigation data received by the IPT (including HS2, Early Work Contractor and other third-party data) associated with these properties formed the primary input for the material reuse models. Each test result was categorised based on the earthworks fill acceptability limits defined in the HS2 SCEW4, Earthworks Technical Standard5 and Guidelines for Best Practice on the Stabilisation of Sulfate-Bearing Soils5 – See Table 3 and Figure 2.
Table 3. Categorisation of the ground investigation data inputs
| Input | Data type | Categories |
|---|---|---|
| Stratigraphy | Interval | Geology 3 code (IPT/DJV interpretation) |
| Liquid limit | Point | <35% : >=35%, <65% : >=65% |
| PSD | Point | <15% fines : >=15% fines |
| Moisture state (PL-MC) | Point | <4% : >=4% |
| Total potential sulfate | Point | <1% : >=1% |
| Slake durability | Point | <60% : >=60% |
Topography and design models
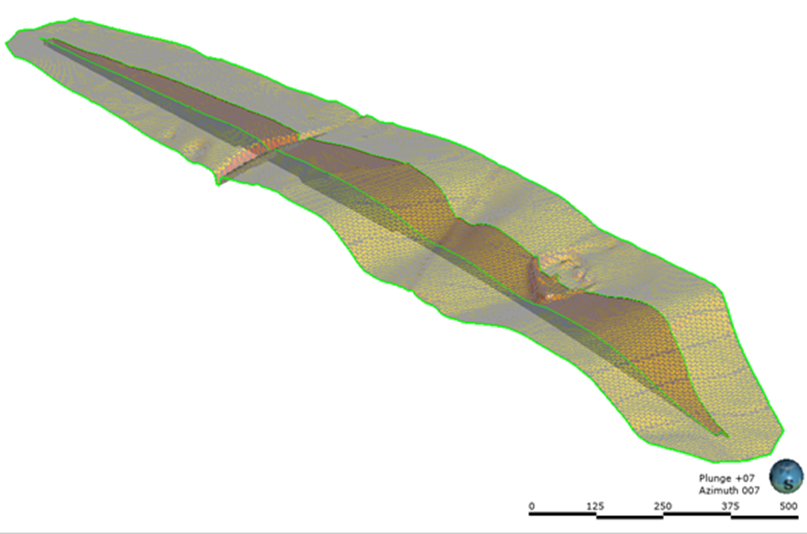
The volume of excavated material within the model is determined by two bounding surfaces, the topography and the extents of the proposed excavation.
A topographical surface was created from the project LiDAR survey undertaken in 2012. A resolution of 5 meters was deemed sufficient for the triangulated generated topographic surface. The lower extent of the excavation was created using the earthwork design models with associated ground improvement below the trackbed layers (dig and replace) models. These were combined using CAD software to create one model of the excavation surface (Figure 3).
Ground model
Prior to creating the geological model (by stratigraphic zoning), the model Level of Detail (LoD) was determined. This is dependent on:
- the complexity of the geology;
- the extent of the available data;
- ability to identify and separate different stratum during excavation; and
- the value in using a greater resolution of stratigraphic zoning (greater resolution may not always suit the purpose of the model).
- For example, Offchurch Cutting consists of a series of glacial sequences (glaciofluvial, glacial till and glaciolucustrine) overlying Mercia Mudstone that are all readily identified on site and are likely to vary in material reuse properties (i.e., zoned based on material reuse characteristics). As a result, individual geological units were modelled. In contrast, shallow superficial deposits at Glasshouse Wood Cutting are unlikely to be able to be separated from the weathered Kenilworth Sandstone and therefore a lower resolution was adopted where only soil and rock was modelled (i.e., combining the superficial deposits and weathered Kenilworth Sandstone Grade D/E material).
Another important step in producing a 3D geological model is considering the extent of data to create a model as implicit realism can produce misplaced trust7. The initial extent of the 3D stratigraphically zoned geological model was set to 200m beyond the boundary of the asset to incorporate surrounding data within the analysis to reduce boundary ‘edge’ effects. This was reviewed on a case-by-case basis and the distance amended as deemed appropriate.
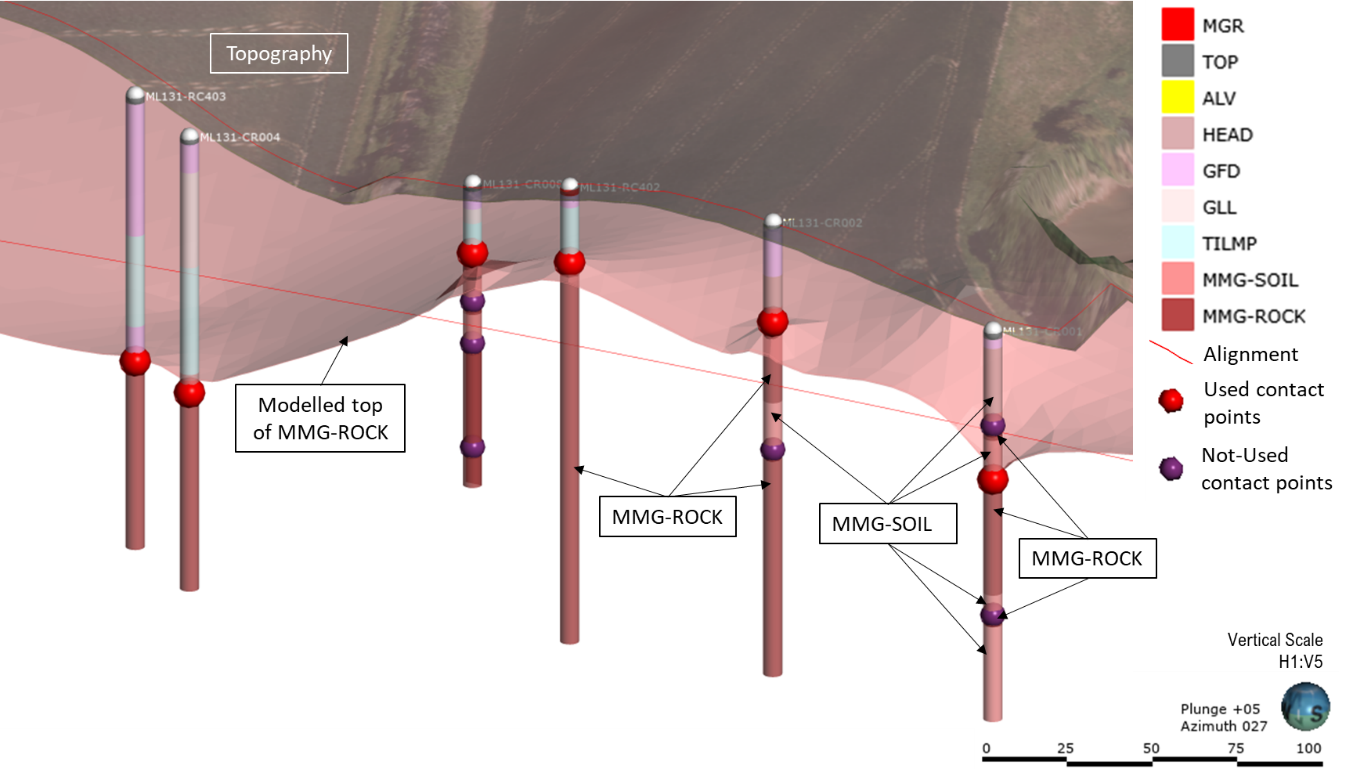
The ground models created represent a ‘best estimate’ based on the available data using implicit software modelling which uses algorithms to interpolate and extrapolate between data. Engineering judgement was applied during the creation of the ground model and particularly at the boundaries between the modelled strata to ensure they aligned with the geological principles appropriate to the geological setting. An example is shown in Figure 4 were engineering judgement was applied to the strata boundary between the Mercia Mudstone soil and rock.
Numerical analysis
The criterion for each material class applied in the numerical modelling is presented in Table 4. For the purpose of modelling it is assumed that the moisture content of Class 2A material can be reduced without the addition of lime to achieve the required compaction criteria if necessary.
| Earthwork material property | Class 1 | Class 1 | Class 2A | Class 2B | Class 2 | Class 7E/F/I | Class 4 |
|---|---|---|---|---|---|---|---|
| SOIL | ROCK | SOIL | SOIL | ROCK | SOIL | ||
| Liquid limit | <35% | n/a | <35% | <35% | n/a | >35%, <65% | >=65% |
| PSD – % fines (passing 63micron sieve) | <15% | n/a | >=15% | >=15% | n/a | n/a | n/a |
| Moisture state
(PL-MC) | n/a | n/a | <4% | >=4% | n/a | n/a | n/a |
| Total potential sulfate | n/a | n/a | n/a | n/a | n/a | <1% | >=1% |
| Slake durability | n/a | >=60% | n/a | n/a | <60% | n/a | n/a |
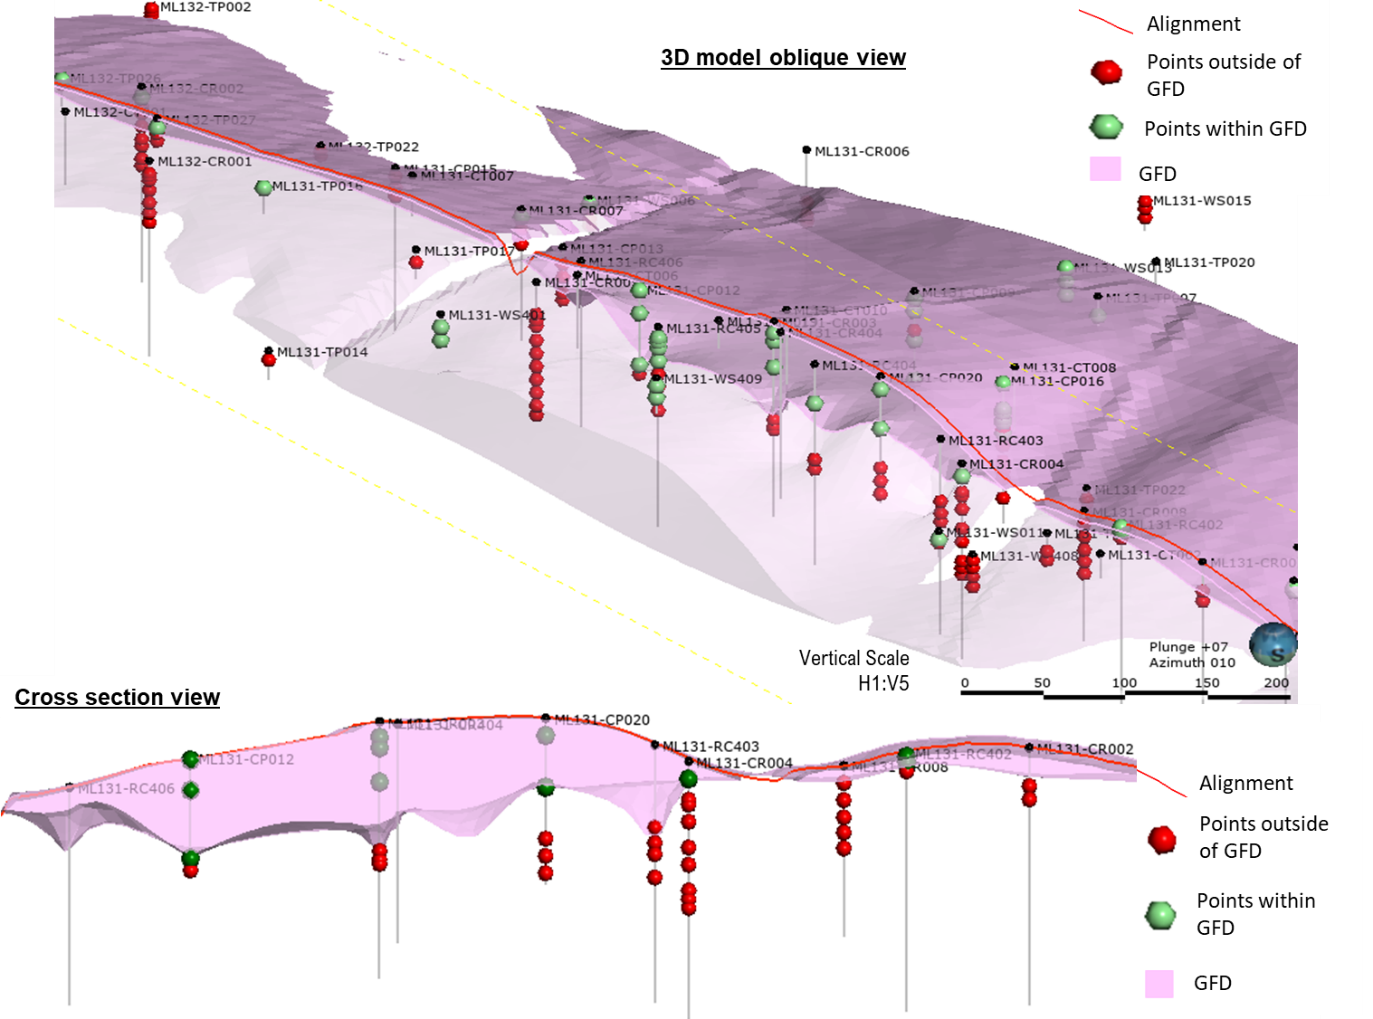
The numerical modelling was undertaken separately within the extents of each geological unit and considers only the data that lies within that unit. For example, Figure 5 shows the liquid limit data that was considered in the analysis of the Glaciofluvial Deposits (GFD). Each earthwork material property was modelled separately before being combined together to form a material class numerical model.
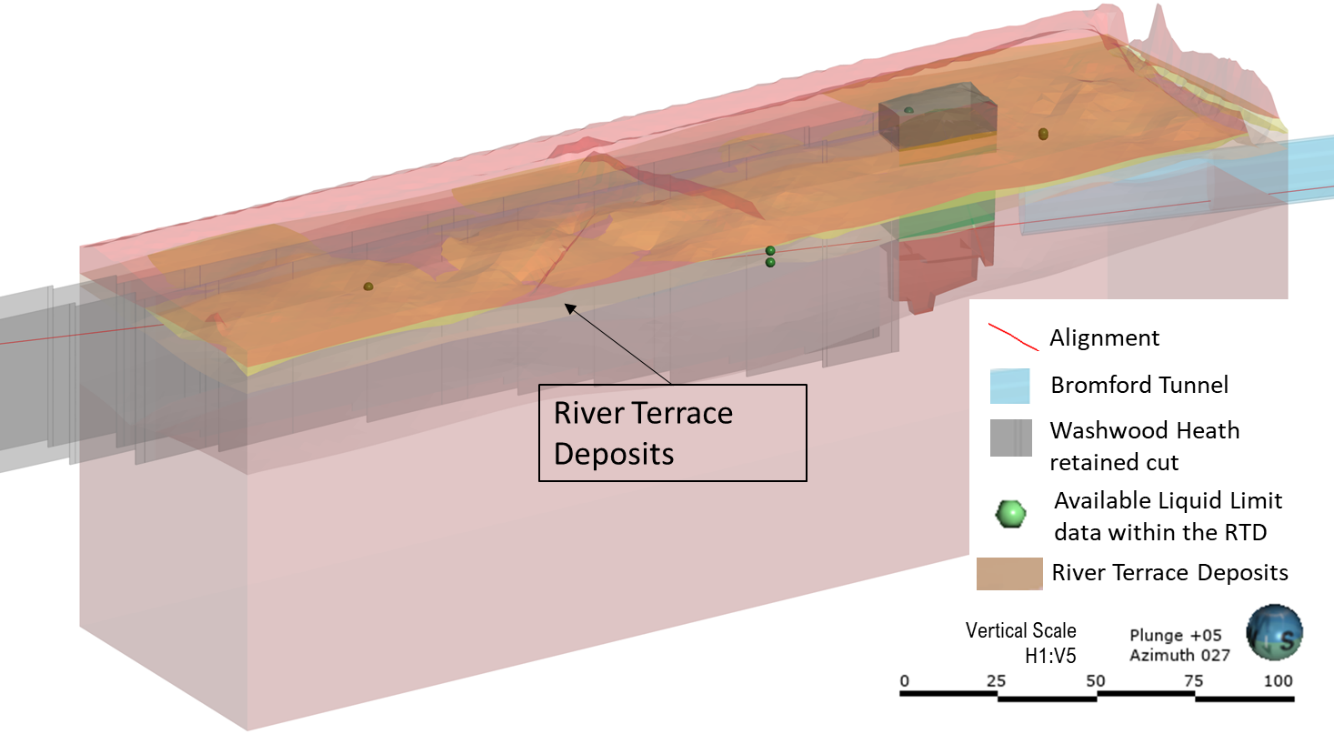
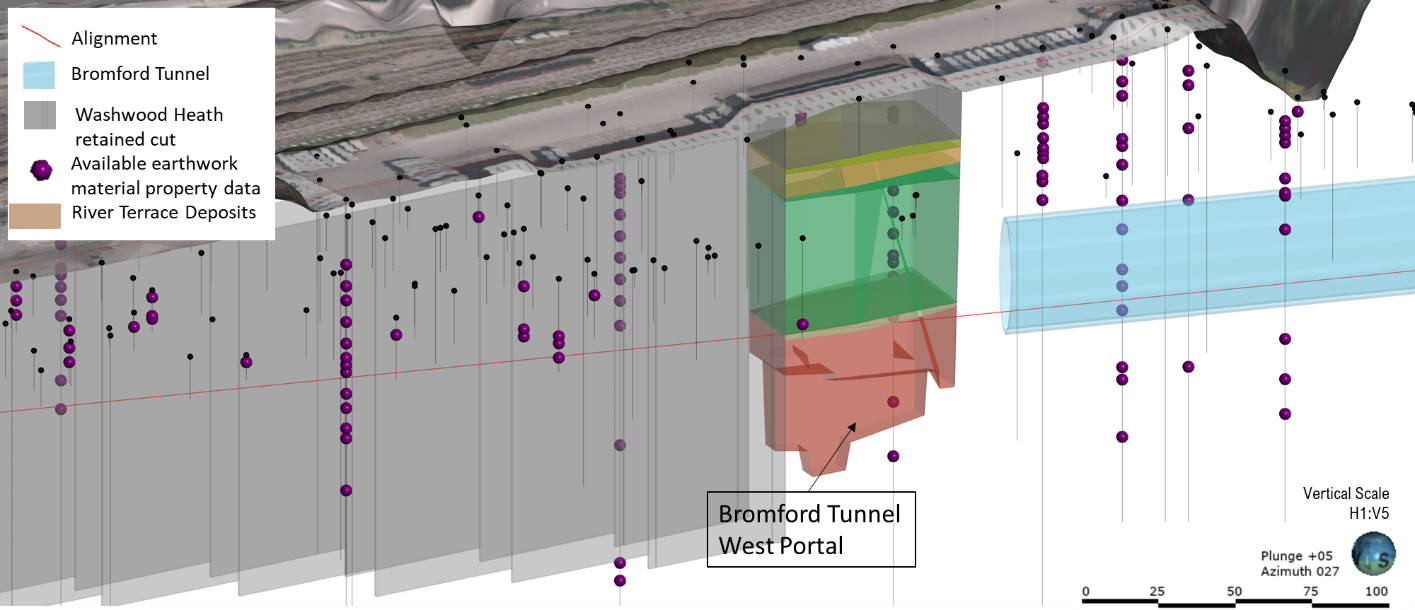
In some cases, the geological model boundary was extended to capture surrounding data where there was deemed to be insufficient data. In such circumstances engineering judgement was applied to ensure only locally relevant data (spatially and geologically) was included in the numerical analysis. An example of where this was applied is Bromford Tunnel West Portal where only 3 liquid limit data points were available within the River Terrace Deposits (RTD) model area (Figure 6). To ensure there was sufficient data to make a representative assessment data beyond the portal model was incorporated into the analysis (Figure 7).
On some occasions, the implicit modelling was supplemented by a manual intervention. Examples include:
- where there was no data to inform the numerical modelling a judgement on the most likely material class was made based on the material descriptions and geological setting. If a reasonable assumption could not be made then the excavated volume material class was tagged as ‘unknown’ and the requirements for additional material testing raised;
- where there was an outlier that contradicts surrounding data then an assessment of the data point’s ‘applicability’ was made as to whether to include the data point in the analysis. For example, at Burton Green Retaining Wall two TPS values were recorded above 1% in the Oadby Till. Given both data points lay outside of the excavation footprint and the source of the high TPS values was deemed to be a sulphate bearing erratic within the glacial till these data points were not considered in the analysis; and
- where data was close to a criterion boundary (e.g., 15% fines for Class 1/Class 2) then engineering judgement on the expected nature and performance of the material was applied based on the density and distribution of data and knowledge from lab and field trials.
All assessments were based on the geotechnical triangle approach of considering the ground profile and groundwater conditions, the measured behaviour of the ground and using an appropriate model to predict performance, supported by engineering judgement based on case histories8,9.
The uncertainty in implicit modelling is often high7. It is therefore crucial to communicate the uncertainty/model reliability of each model. One of the ways this is done is by reporting the density of data points used in the analysis (Table 5). The greater the density, the greater likelihood that the model represents reality although this depends on the complexity of the prevailing geological setting. The opposite equally applies for a model with a lower density of data. This is important as it gives the ITP an indication of how much they can rely upon the model when making mass haul assessment decisions.
| Soil | Soil | Soil | Rock | Rock | Rock | |
|---|---|---|---|---|---|---|
| Earthworks property | Volume (m3) | Number of points | Density (points per 10,000m3) | Volume (m3) | Number of points | Density (points per 10,000m3) |
| Liquid limit | 980,000 | 251 | 2.6 | 260,000 | n/a | n/a |
| PSD (passing 63µm sieve) | 980,000 | 248 | 2.5 | 260,000 | n/a | n/a |
| Moisture state (PL-MC) | 980,000 | 250 | 2.6 | 260,000 | n/a | n/a |
| Total potential sulphate | 980,000 | 61 | 0.6 | 260,000 | 29 | 1.1 |
| Slake durability | 980,000 | n/a | n/a | 260,000 | 17 | 0.7 |
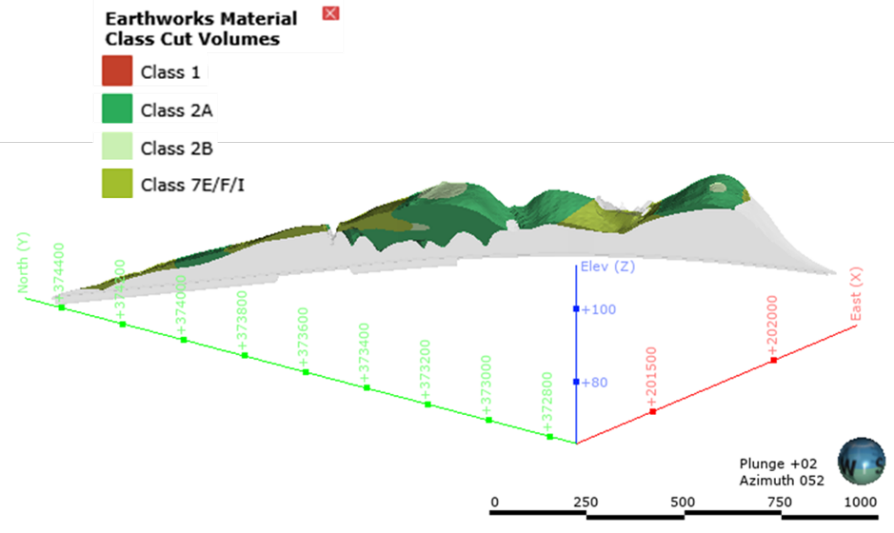
Outputs and application
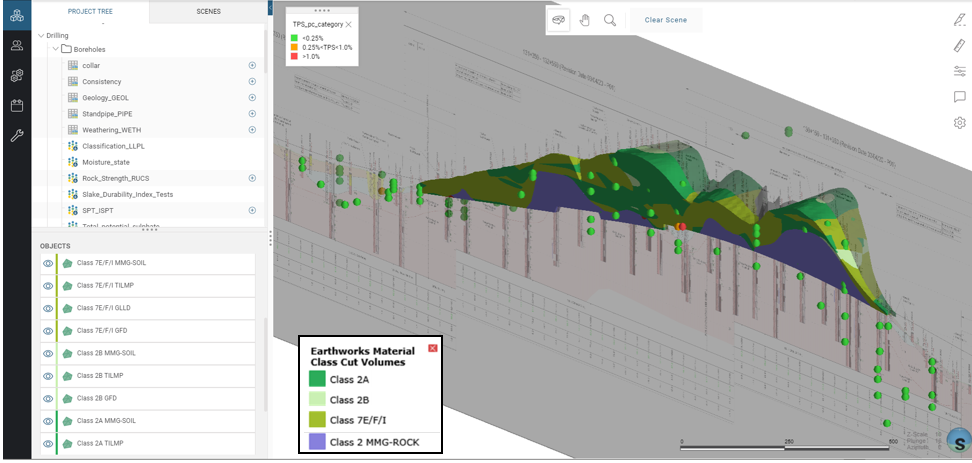
The primary output from the analysis was a 3D geological model zoned by material reuse class for the in situ material prior to excavation (Figure 8). Each model is published on Seequent’s web-based viewing portal ‘Central Viewer’ alongside the source datasets used in the numerical analysis, long sections, geological logs, geological model and earthworks design models (as illustrated in Figure 9). Users can interact with the geological models and other information, including cutting sections through it and extracting material volumes. The portal is accessible to all members of the IPT. This has enabled members of the IPT to view the model outputs alongside descriptive data such as geological descriptions to give a clearer picture of the material re-use potential of material (Figure 10).
By providing the model and source data together it provides an audit trial for the end user to understand how the model has been created. It also enables an assessment of the geographical spread of source data points and highlight where data may be lacking and therefore where more caution should be exercised in the application of the model (e.g., mass haul decisions). In addition, it allows the interrogation of the source data points to enable an assessment of the quality of the raw data to be made. If upon review, any errors in the source data are identified then the analysis is rerun, excluding the data in question.
The output material class model is not the end point of the material reuse assessment. It is intended to act as an initial high-level assessment to give an overview of the material use classes expected to be encountered and identify areas of marginal material where further assessment may be required.
For each asset, a supplementary technical note was written alongside the models and included a series of tables that summarise the predicted ‘in situ’ percentage and volume of each material class for each geological unit within each excavation area (Table 6 and Table 7). It should be noted that the volumes do not consider ‘bulking’ associated with handling of material following excavation.
The output volumes are rounded to the nearest 1,000m3 or 10,000m3 depending on the size of the volume reported and the quantity and density of the available data.
| Spatial assessment | Spatial assessment | Consolidated Scheme Design Earthworks Material reuse assessment | Consolidated Scheme Design Earthworks Material reuse assessment | |
|---|---|---|---|---|
| Material Class | In situ assessed proportion (%) | Excavation volume (m3)* | ‘Statistical’ assessed proportion (%) | Excavation volume (m3)* |
| Class 1 | 0 | 0 | 4 | 20,000 |
| Class 2A | 70 | 300,000 | 61 | 260,000 |
| Class 2B | 5 | 20,000 | 11 | 50,000 |
| Class 4 | 0 | 0 | 0 | 0 |
| Class 7E/F/I | 25 | 110,000 | 24 | 100,000 |
* To the nearest 10,000
| Total Excavated GFD Volume (m3)* | Total Cutting Excavated Volume (m3) | Proportion of Total Cutting Excavated Volume (%) |
|---|---|---|
| 430,000 | 1,240,000 | 35 |
* To the nearest 10,000
For comparison, the percentages and volumes are presented alongside the conventional, statistical derived assessment of material re-use percentages. The density of input data points is also reported within the technical notes.
The models and material output volumes directly fed into the mass haul assessment undertaken as part of detailed design and construction planning.
Realised benefits
The technique was initially trialled on two cuttings: Offchurch Cutting and Diddington Cutting. These were chosen due to their size (both >10 metre deep) and their relatively complex geological sequence of glacial deposits and Mercia Mudstone (soil and rock) and the amount of data available to produce a reliable model.
The proportions derived from the new spatial analysis technique aligned well with the traditional statistically derived values (e.g., 25% vs 24% Class 7 E/F/I for glaciofluvial deposits in Offchurch cutting – see Table 6). However, the additional benefit of the spatial assessment is that it provides indication of where each material will be encountered (validated via advanced trial pitting prior to construction). This allowed the construction team to optimise the mass haul movements during the permanent works through targeting the excavation of particular areas of the cutting to obtain fill that meets the class requirements for whatever is getting constructed at the time. For example, when permanent ground improvement works were being carried out beneath the adjacent Grand Union Canal Embankment, the construction team could target the excavation of areas where Class 7 was expected to be encountered from cutting instead of stockpiling and multiple handling of material. The greater accuracy of the volumes and ability to model the specific geometric earthwork profiles has also given the construction team confidence to further optimise the mass haul. A comparison of the 3D stratigraphic model, material reuse zoning and what was encountered during excavation is shown in Figure 11.
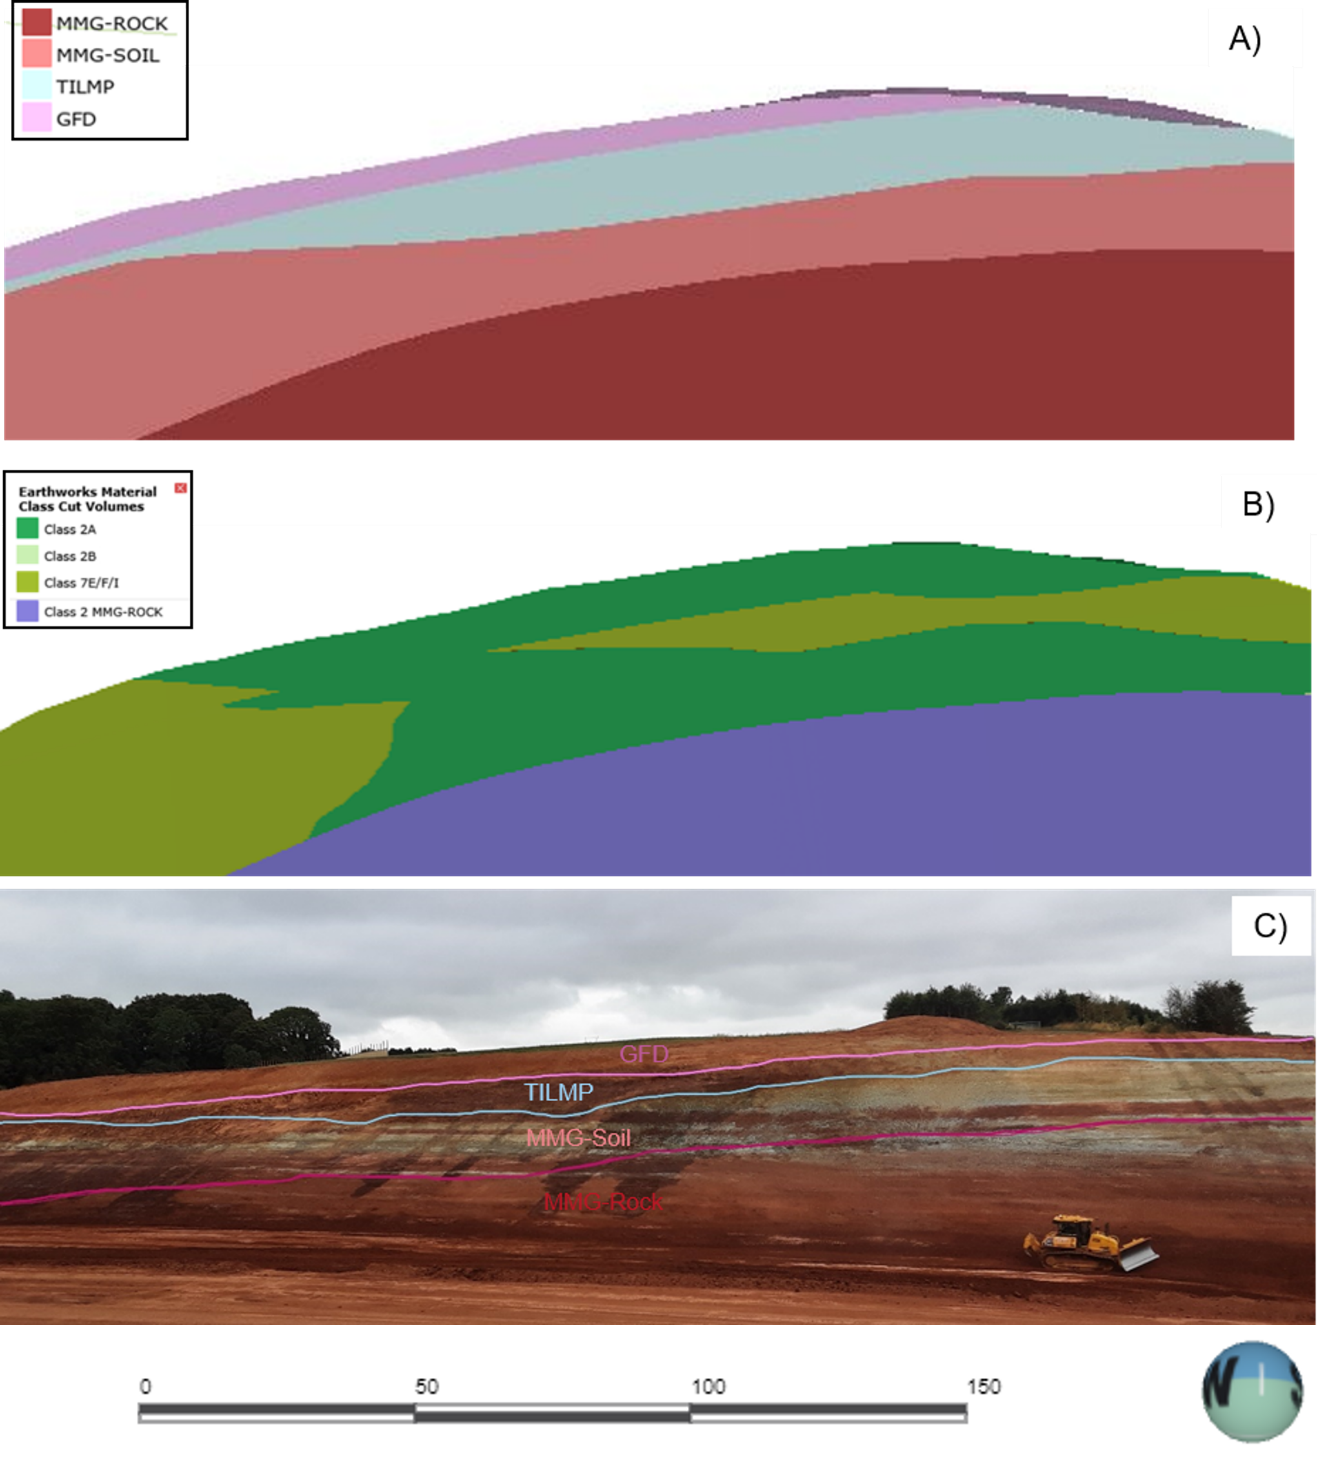
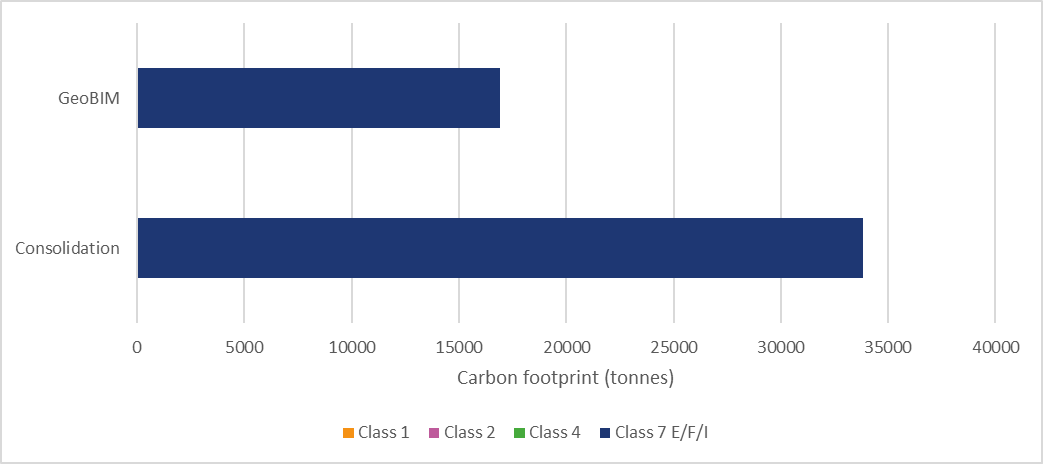
Figure 11b highlights large pockets of Class 2 material from Offchurch cutting (subject to sufficient drying of material to achieve compaction criteria). Such a spatial assessment was not available during the Consolidation mass haul assessment and therefore it was concluded that all material extracted from Offchurch cutting would be Class 7 based on the assumption that any Class 2 material could not be separated from the Class 7. This is likely to have been the case if the material was extracted simultaneously and stockpiled together but the material reuse model means BBV can target and separate the Class 7 and 2 material. This provides the opportunity for up to 50% of the material excavated from the cutting to be Class 2. Based on an estimated cutting volume of 1.2 million m3 and the carbon emission factors presented in Table 8 this equates to potential 16,000 tonne reduction in carbon – See Figure 12.
| Material | A1-3 ‘Material production’ stage emission factor (per tonne of material) |
|---|---|
| Lime treated ‘site won’ material (2.5%) | 0.0195 tCO2e |
| Untreated ‘site won’ material | 0 tCO2e |
Similarly, the material reuse modelling for Kenilworth Cutting indicated that up to 50% of the Kenilworth Sandstone rock could be extracted as Class 1, whereas previous assessments had concluded no Class 1 could be extracted. Given the expected excavation volume for the Kenilworth Sandstone rock is 150,000m3, it saves up to ~2,000 tCO2e by removing the need to stabilise 75,000m3 of material.
Following the trial, the technique was rolled out to a further 17 earthwork assets (cuttings and some tunnel portal excavations). Additional realised benefits include:
- ensuring consistency in how the mass haul is assessed across N1N2;
- acting as a strong communication tool to facilitate better coordination between designers and the earthworks construction teams;
- replacing time consuming route wide manual assessments with more targeted manual assessments where marginal material is present;
- providing a clear audit trail to the assessment inputs and design models;
- ease of rerunning the assessment as new data becomes available or the design model evolves; and
- highlighting areas where there is a lack of data to help inform the location of additional exploratory holes for future ground investigation phases and/or field trials.
All of these have enabled the IPT to make better informed, data driven decisions to optimise the mass haul while minimising the residual risks during construction, particularly the need to import additional fill to site and reduction of lime treatment.
This combined with other carbon saving (such as the reduction of lime content used in treated fill from 2.5% to 1.5%) has enabled the IPT to reduce the carbon footprint of earthworks on the northern section of HS2 Phase 1 to support the drive to achieve an overall 50% reduction.
Wider application and future developments
The technique has so far been utilised on 19 earthworks assets (cuttings and some tunnel portals) across N1N2 which will contribute to 10 million m3 of the 21 million m3 to be moved on the project. It may be further applied to other assets during detailed design where the modelling would benefit the material reuse assessment. Where there have been significant changes to the design of earthworks during detailed design the assessment will be re-run to understand if there are any changes to the material reuse model.
The scale and nature of N1N2 has warranted this innovative approach to achieve mass haul efficiencies and associated carbon reductions. However, the technique can be readily applied to any infrastructure project that involves mass movement of material. It is particularly useful for obtaining a more accurate picture of the volume and location of key material classes within in situ material prior to excavation, thus allowing teams to better plan their mass haul strategy. It is recommended that it is implemented as early as possible on future projects to maximise the benefits outlined.
It is important to recognise that it may not be beneficial to apply the technique in all scenarios. For example, if the geology is well known and homogeneous, where only one material class is expected to be generated, the technique is unlikely to provide much more insight. Equally, if the majority of the earthworks are landscaping then there is not as much of a need to assess the properties of excavated material compared to mainline or highways earthworks. It is for these reasons that a targeted approach is recommended.
The following future developments are currently in progress or proposed to be rolled out during detailed design and construction:
- incorporation of geoenvironmental data into the analysis, particularly related to contamination. This will help to better define the extents of contamination hot spots and potential unacceptable U1A or U1B material across the route. This will allow the IPT to minimise the amount of unacceptable material that will need to be disposed of and maximise the amount of uncontaminated material that can be reused. This will be particularly useful in areas such as the Washwood Heath Depot and Saltley where significant quantities of contaminants have been identified.
- incorporation of organic content into the analysis (particularly for strata that are likely to have a high organic content, e.g., Alluvium).
- further validation ground investigation and comparison of material reuse models with actual volumes extracted during construction. This provides a means of validating the models created (i.e., how close they are to reality) and a chance to understand what improvements could be made to future modelling;
- further categorisation of Class 4 material to identify material that is suitable for highways earthworks; and
- further integration with asset BIM models to create ‘as-built’ material reuse models.
The following are more general industry wide practices/initiatives that would improve the material reuse modelling and further promote sustainability across the construction industry:
- integration of the material reuse modelling with other industry wide material reuse optimisation initiatives (e.g., National Highways Connected and Autonomous Plant (CAP)).
- greater quantum of ground investigation testing associated with material reuse properties scheduled (particularly at earlier stages of project). This would enable more accurate material reuse modes to be created.
- carbon calculating on every major project to better understand the carbon footprint of earthworks and how it could be reduced (with a focus on the product and construction stages (A1-A5) of the carbon lifecycle11). This is now in place across HS2 but it needs to become standard practice.
- more focus on non-financial sustainable goals and putting carbon at the centre of decisions throughout the design and construction phases of every project.
- think about carbon early in a project to enable opportunities to be taken and ‘locked-in’ before it is ‘too late’.
Acknowledgments
Thanks to the BBV and DJV management teams for their support to the developments presented in this paper.
References
[1] HS2, 2019. Technical Standard – Carbon Management (Doc no. HS2-HS2-SU-STD-000-000004) – P09, 14pp.
[2] HA (1998, 2013) Manual of Contract Documents for Highway Works, Vol. 1 – Specification for Highway Works, Series 0600 – Earthworks. Her Majesty’s Stationery Office, London, UK.
[3] Novak, P. and Gilbert, P. 2015. Earthworks: a guide. Second edition. ICE Publishing, London, UK.
[4] HS2, 2019. Specification for Civil Engineering Works, Series 0600: Earthworks (Doc no. HS2-HS2-CV-SPE-000-010600) – P04, 92pp.
[5] HS2, 2019. Technical Standard – Earthworks (Doc no. HS2-HS2-GT-STD-000-000001) – P08, 93pp.
[6] Britpave, 2011. Stabilisation of Sulfate-Bearing Soils: Guidelines for Best Practice. Britpave, Bracknell, 12pp.
[7] IAEG Commission 25 Working Group- Guidelines for the Development and Application of Engineering Geological Models on Project – First Draft 10th September 2021
[8] Burland, J. 1987. The teaching of Soil Mechanics: a personal view, Volume 3 of In: Proceedings of the 9th European conference on soil mechanics and foundations engineering.: 1427–1447. Dublin.
[9] Burland, J. 2007. Terzaghi: back to the future. Bulletin of Engineering Geology and the Environment 66(1): 29–33
[10] Circular Ecology. 2021. Embodied Carbon – The ICE Database v3.0.
[11] Orr, J; Gibbon, O and Arnold, W. 2020. A Brief Guide to Calculating Embodied Carbon. The Structural Engineer, 98(7), 6pp.
Peer review
- Rick HartwigInstitution of Engineering and Technology
- Clive PaulseHS2 Ltd
- Jonathan RhindHS2 Ltd
- Nick SartainHS2 Ltd