Using Train-Borne Lidar to improve design confidence in railway electrification
The Midland Main Line needs to be remodelled and electrified to accommodate High Speed Two (HS2) train services to Sheffield. This paper addresses how the issue of site surveys, to accurately judge the level of intervention required for the system design, without site access, was solved. Detailed measurements were required on the 26km route, which encompasses over 100 bridges, culverts, viaducts and tunnels. Due to access constraints and limited availability of surveying staff, capturing this information would not have been possible by conventional means before hybrid Bill submission.
The Signalling Innovation Group at Network Rail use train-mounted cameras and laser scanners to record point cloud surveys for signal sighting. Over the course of a weekend, the entire route was surveyed using this technology, running the train in normal service without the need for disruptive line blockages or possessions.
The outputs from the software include 4K video footage and data which also provide benefits for community engagement and ecological assessments. This includes sharing graphical models of the newly electrified line with superimposed 3D overhead line visualisations. This additional planning assures the design as we move into the construction phase and could be applied to further touchpoints of HS2.
- Written by
-
Chris Bryan (HS2 Ltd/Bechtel)

- Resource type
- Resource type: Technical Paper
- Tags
- 4K posts
- BIM posts
- Class-37 posts
- Clearance posts
- electric posts
- Electrification posts
- LiDAR posts
- MPS posts
- Network-Rail posts
- OCS posts
- overbridge posts
- PVP posts
- safety posts
- Survey posts
- Touchpoints posts
- Train posts
Introduction
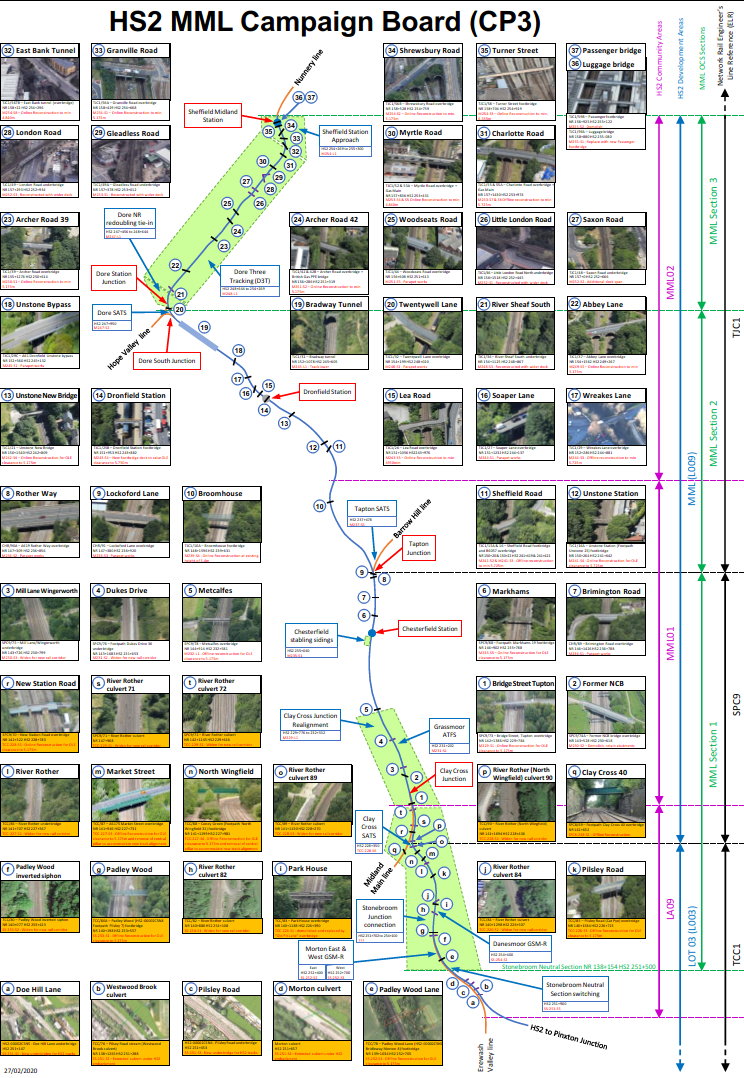
In 2018, the HS2 Phase 2b team was tasked with developing a programme of electrification for a 26km stretch of Network Rail infrastructure to complete the link to Sheffield Midland station (see Figure 1). A reasonable worst-case approach was taken to determine the cost associated with this work. Lessons learnt from previous electrification schemes on the Great Western Main Line recommended gaining knowledge of the barriers to efficient construction at the beginning of the project. This required early assessment of the overline structures that would impact the design for safe electrical clearance (01). A key part of OCS design is ensuring the vertical clearance can be achieved.
Electrifying an existing railway
When planning the electrification of existing railway infrastructure, designers must consider the operational requirements, feeding locations and stabling arrangements (03). The Overhead Contact System is selected based on usage patterns: linespeed, passenger loading and rate of pantograph passages. Variation in any of these operational characteristics will impact the specification.
System specification
The UK adheres to Interoperability regulations for the power supply of OCS governed by rules stated in EN 50163 (04). A nominal voltage of 25 kV is the measured value on the contact wire of the overhead line network for all main line railways maintained by Network Rail; HS2 will be fed at the same voltage. Differences in the system specification relate to the linespeed, topography and the associated track limitations. The Midland Main Line will never operate at linespeeds greater than 125 mph. In most cases between Clay Cross Junction and Sheffield Midland, a maximum linespeed of 90 mph is mandated.
Overhead line design is governed by European Normative standards. EN 50119 (05) specifies the main properties of the system and EN 50367 (06) lists the safe limits of pantograph interactions. A high-speed OCS must satisfy the wave propagation speed requirements and achieves this stability with a zero gradient and null change in gradient of wire height at speeds above 155 mph. The nominal minimum wire height of the V360 system designed for HS2 is between 5.12m and should not deviate from this position (07). The NR UK Master Series specification for the equipment proposed for the Midland Mainline recommends a nominal wire height of 4.70m (08). Lower operating speeds permit a change in wire gradient so can accommodate reduced-height bridges and overline structures (09).
Clearance requirements for overline structures
The clearance required from a 25 kV system to earthed or unearthed infrastructure is calculated based on the insulation characteristics of the intermediate medium. Minimum clearance distances to protect against electric shock are detailed in EN 50124-1 (10). The Current Collector Zone (CCZ) as shown in Figure 5 is the area around the live OCS at probable risk of becoming energised during fault conditions. Overline structures that infringe this zone must be risk-assessed to ensure they are adequately protected.
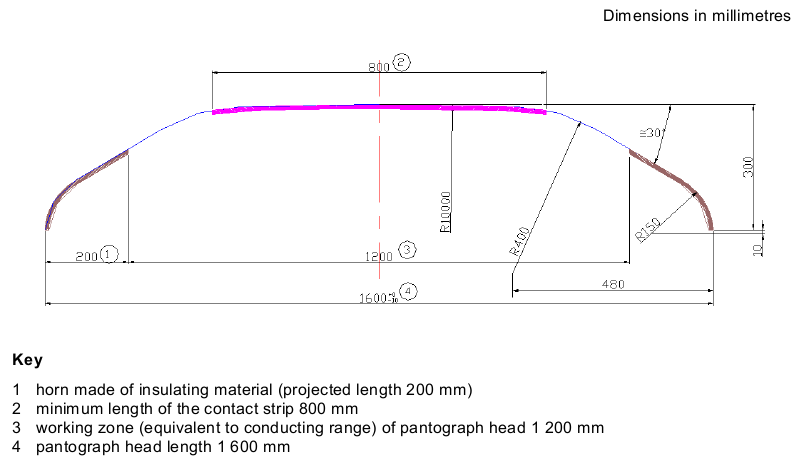
Further consideration must be given to the pantograph profile. EN 50367 (06) specifies the design shape of an interoperable pantograph and HS2 have mandated a 1600 mm width head. The interoperable design profile for this pantograph can be seen in Figure 2.
Legacy pantographs may also operate on the OCS and therefore additional consideration must be given for alternative profiles. Figure 3 shows the half-shape profile of pantographs used on HS1
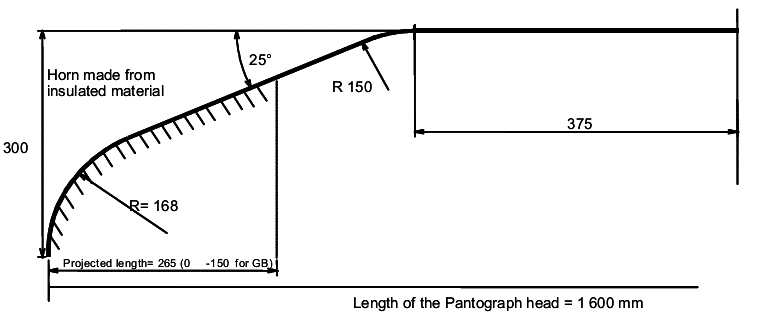
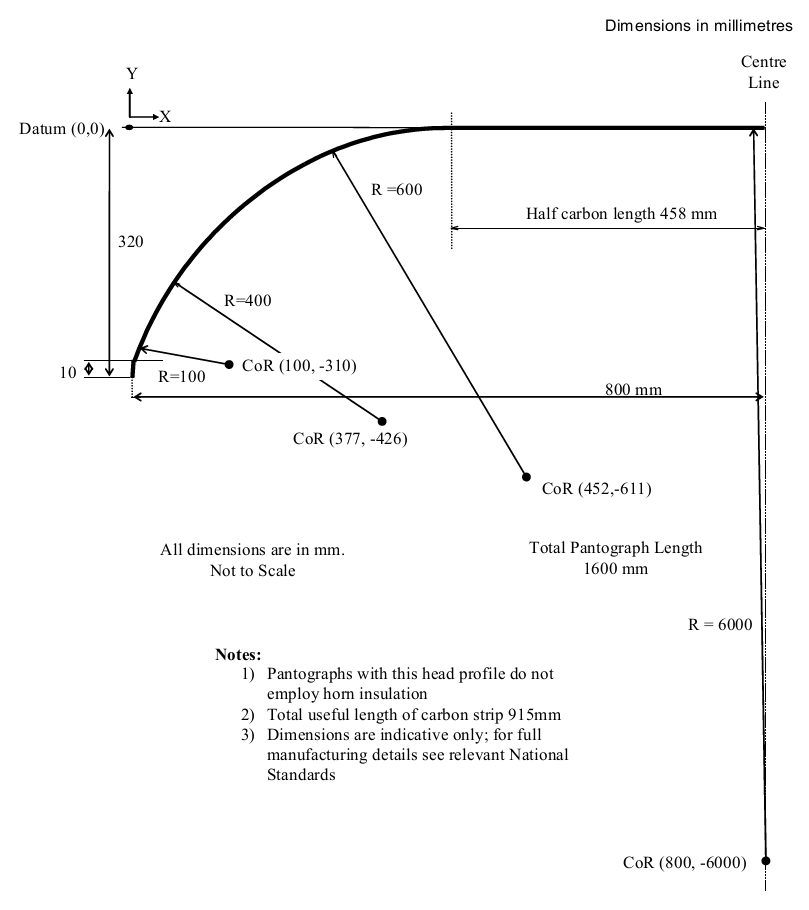
The absence of insulated horns impacts the safe clearance between the lowest point of the pantograph and overline structures (12). Figure 4 demonstrates this half-shape profile.
A combined model of worst-case potential infringement from each of the pantographs listed in EN 50367 was used as the basis for clearance assessment. In accordance with EN 50119 an electrical passing clearance of 200 mm was applied perpendicular to the upper limit. This formed the pantograph gauge when assessing each of the overline structures on the route.
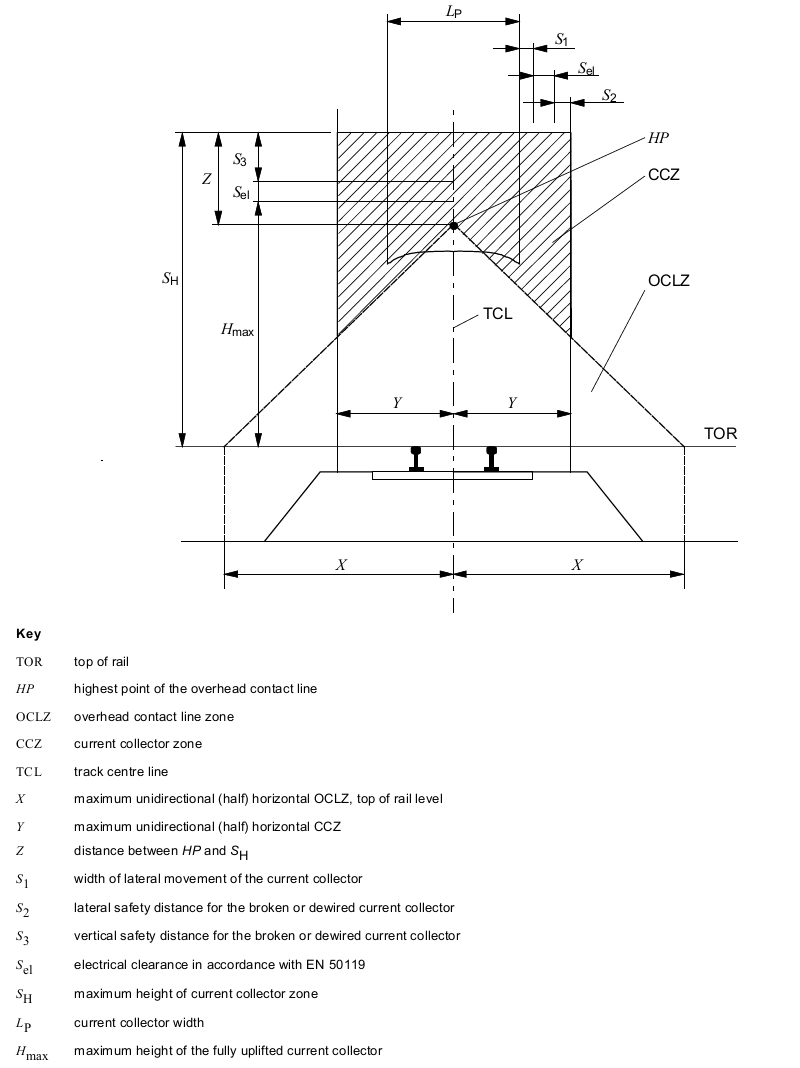
When dealing with existing UK infrastructure, it is common for bridges to infringe the CCZ (Figure 5) with the contact wire at a fixed height relative to the track. To deal with this problem, solutions include track lowering schemes, reduced system height OCS design, bridge protection, bridge raising and bridge replacement. For the purpose of design solutions prior to hybrid Bill submission, the reasonable worst-case option would be considered once assessment of the available clearance was complete.
Railway Group Standards also serve as a means of verifying the allowable clearances between infrastructure and rolling stock (13). Assessment of gauge clearance (14) is equally important to assessing the electrical compatibility of the interface (15). GI/RT 7073 defines the safe position of equipment with respect to vehicles used on the network (16).
Design tolerances for overline structures
Network Rail has summarised the requirements as they apply to designing OCS in NR/L2/ELP/27715. Module 4 specifies the electrical and mechanical separation with reference to static and passing clearances (17).
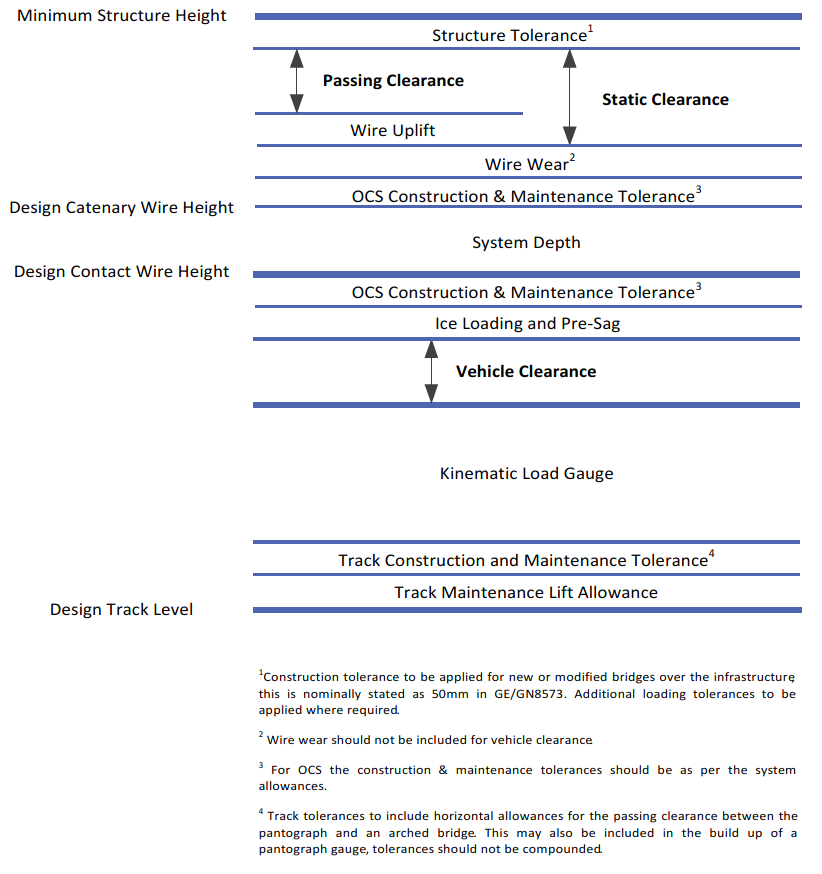
To calculate minimum overline static clearance (for fixed infrastructure):

To calculate minimum overline passing clearance (to accommodate pantographs):

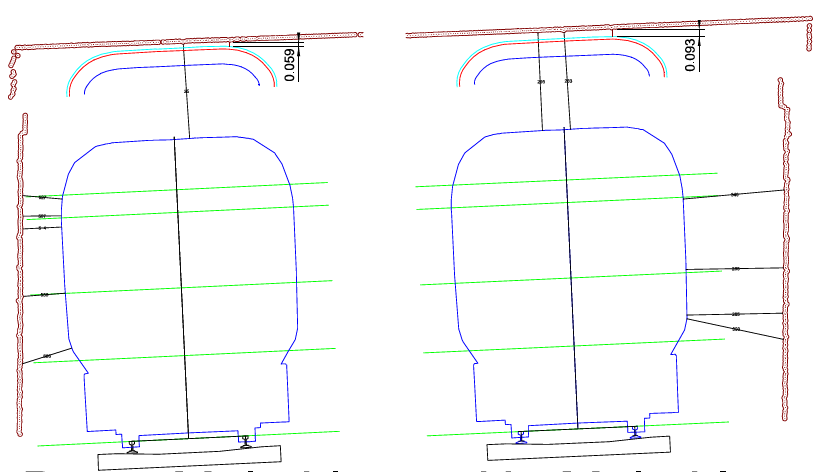
The impact on the design for flat deck bridges can be seen in Figure 6 above. When considering alternative bridge profiles, a visual assessment is required to determine if pantograph infringement occurs anywhere along the bridge cross-section.
Gauge clearance assessment
When generating a cost estimate for future construction work, the confidence in the accuracy of measured data is paramount. The measurement tolerances and age of data must be considered to assess the level of risk that should be attributed to the information.
Available data from Network Rail
As the owner and maintainer of the UK’s railway infrastructure, Network Rail are custodians for many useful databases, which store information related to the overbridges in the Sheffield region:
- Ellipse is the central repository for Network Rail infrastructure, including linear assets such as track and overhead line tension lengths. This same tool is used for maintenance scheduling activities.
- CARRS provides access to a complete record of structural surveys of civil assets. Condition reports are mostly based on visual examinations. This gives a good indication of the state of repair and likely timeframe before next major structural intervention.
- NGD records historical gauging assessments performed across the railway. SC0 files requested from the NGD are available for analysis in ClearRouteTM 2 (gauging software developed by Balfour Beatty) (19)
These datasets are only updated when new data is collected. New surveys are commonly associated with major projects, so many requests for information return data more than a decade old. Survey data that was recorded more than 18 months ago is subject to greater tolerances, as lateral track movement is likely over this timeframe.
Conventional methods
In a similar process to gathering CARRS data, lineside structural assessments using rail mounted gauges (shown in Figure 7) can be commissioned through Network Rail.
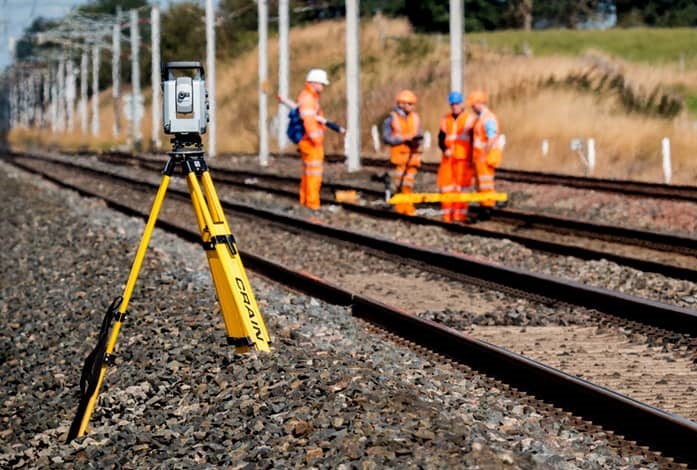
Full line closures are required for this work and detailed surveys can be gathered by a surveying team. Surveys of this nature are expensive and rely on the accuracy and attention to detail of those employed to complete the task. There is personal risk involved when accessing the track including slips, trips and falls, and the procedure to arrange a line blockage takes time and effort. The process is time-consuming and depending on how dispersed the civil assets are along a route, it may not be possible to survey more than one bridge per shift. The cost associated with closing a line to traffic to conduct detailed site surveys also has a reputational cost for the Train Operating Companies. The MML serves as a key part of the national rail freight network meaning significant diversionary route planning is needed before fully closing this railway.
Train-borne monitoring
Developments in the latter part of the 20th century have combined laser gauge technology with in-service vehicles to perform track surveys without requiring lineside access. This is a huge benefit in terms of safety of the workforce. Multi-Platform Surveys can capture HD video and 3D point cloud laser survey data to create geospatially calibrated 3D models of the railway environment (20). LIDAR is utilised with single or dual laser scanners rotating to collect 360 degrees of information. Light is reflected from the nearest object in the line of sight and the time taken for the reflection to return allows the distance to be calculated. When combined with a service train, a spiral corridor of measurements can be recorded with the density defined by the speed of rotation and speed of traversal along the route. A higher density 3D image is produced by reducing the speed and taking more time to gather data.
The scanning equipment is attached to a locomotive typically 1 m above the rail level to gain a fuller picture of the immediate environment. This calibrated height allows multiple tracks to be scanned from a single line. Importantly, this technique cannot see past obstacles so, for multi-span arches, laser scans are required from each track to develop the full picture. Using a dual laser system and skewing the scanners at a slight angle ensures that flat surfaces perpendicular to one laser can be picked out by the other.
Positioned Video Pixels
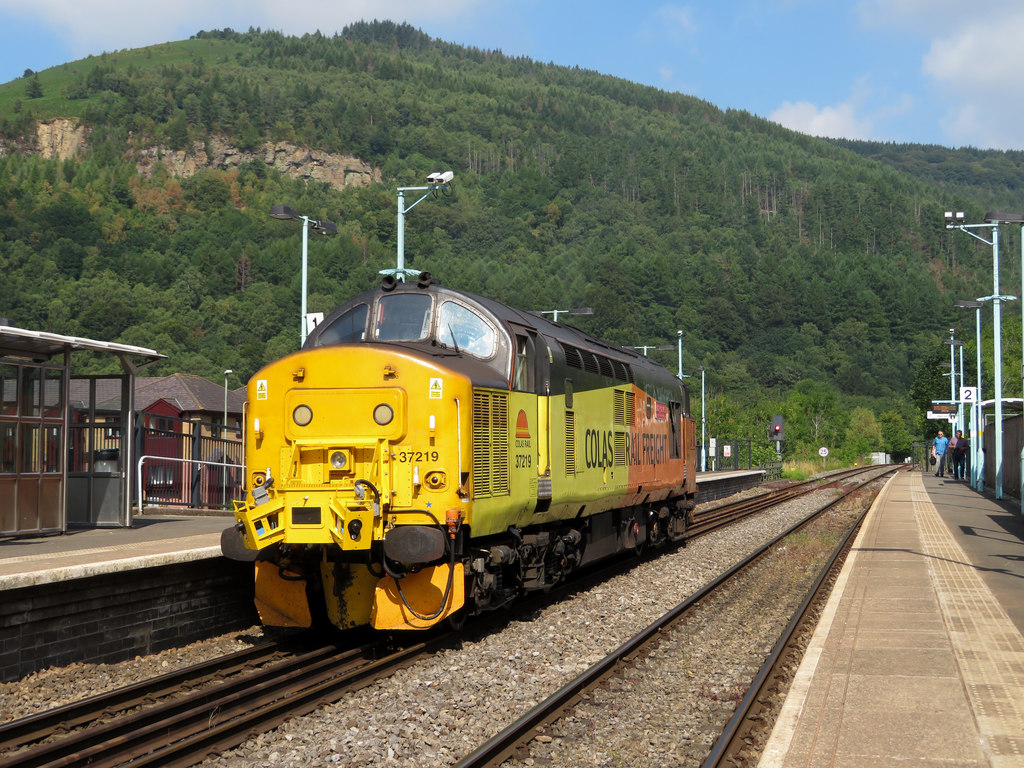
The Signalling Innovation Group at Network Rail (21) utilise a class 37 vehicle equipped with OmniCapture3DTM dual laser scanning equipment and 4K enabled video cameras (22). Lasers are positioned at one end of the locomotive (as shown in Figure 8) and the cameras are positioned both front and rear.
The information gathered from test runs is post-processed to be compatible with Positioned Video Pixel (23) software based on the OmniSurveyor3D framework (24).
The software includes several key functions:
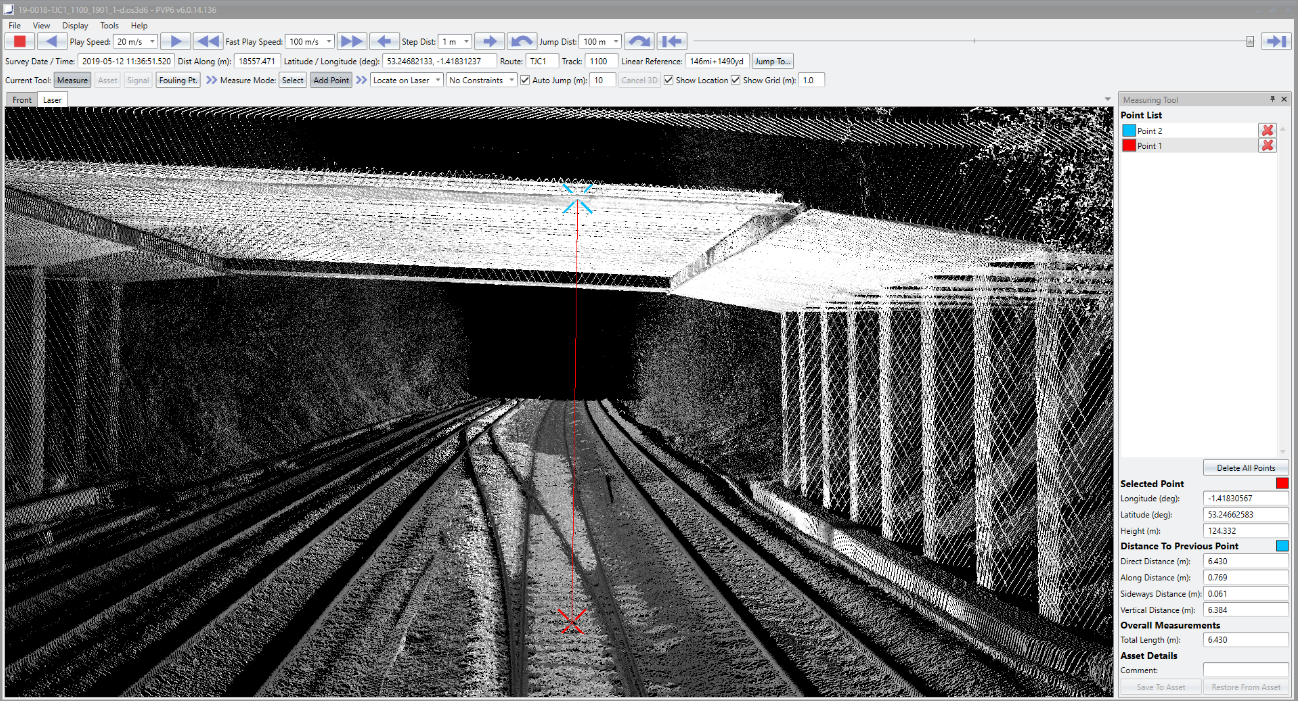
- Point to point measurements – measurement markers (shown in Figure 9) can be centred on the track level. Triangulation using the video footage enables 3D positioning of reference points and individual point cloud markers can be used for direct measurement of lengths. Measurements are automatically subdivided into direct, along-track, sideways and vertical components in addition to longitudinal, latitudinal and height positions. Multiple point measures can be combined and saved to a reference asset.
- Allocation of new permanent way infrastructure – visualisations of track infrastructure can be superimposed onto the video footage to represent new lines intended for future installation. These 3D rendered objects can then be used as measurement references.
- Asset capture – existing lineside equipment can be marked up on the video footage and included in reference files. These assets are then navigable waypoints in the video library enabling indexing of key infrastructure. This has key benefits for asset management activities with different asset types saved to sub-divided categories.
- Signal sighting – this was a key reason for the original commissioning of PVP software by the Signalling Innovation Group. Laser obtrusion can be superimposed onto the video footage to give assets physical form. Additionally, in-cab visual overlays can be utilised for a variety of rolling stock classes to accurately demonstrate the viewing angles seen by drivers.
- Driver route learning – within the software, visual overlays can be added to the video footage. This can then be exported to create driver route learning tools showing key bridges, stations and signal locations. These video files use standard file formats meaning that the videos can be shared to users without access to PVP.
- Fouling points – specific to analysis of switches and crossings, calculations have been built into the software that allows measurement of fouling points.
- OCS electrification detail – a library of 3D models of overhead line equipment has been included, originally to assist with signal sighting, but latterly to represent the positions of future electrification schemes. Models can be fully manipulated in 3D space and are saved to a geospatial reference. This means modelling data can be viewed on multiple video files by importing the file into the software.
Another feature which is available from Balfour Beatty is exporting to a virtual reality environment for Oculus Rift or HTC Vive. This has limited additional benefit currently but is a useful visualisation tool.
Repeatable measurements
A key benefit of the software is the repeatability of measurements. In comparison to manual measurements taken on site, the recorded distances logged in PVP can be saved to a file for direct verification by a secondary user. The point to point distances remain as a visual overlay and can be compared to measurements from adjacent tracks. The stated measurement tolerance is +/- 25 mm but this is in reference to the actual GPS position; measurements taken within the software have a relative accuracy of +/- 15 mm. To account for this risk, worst case measurements should be assumed for decision-making purposes.
Cross-sectional analysis
The system architecture of PVP belongs to the Balfour Beatty suite of software meaning that there is cross-compatibility with gauging assessment tools such as ClearRouteTM 2. SC0 and SCX files can be exported from the original data and the cross-sections can be analysed for vehicle and pantograph incursion risk. Figure 10 shows an example of where the point cloud data has been exported and compared against the HS2 standard vehicle gauge.
Design applications
In addition to clearance assessments, the geospatial data also enables OCS allocation design verification. Layout plans can be converted to 3D models using the asset insertion function. This is a manual process but measurement features of the software enhance the efficiency of placing masts. This extra step in the design verification process identifies allocation design flaws before reaching the construction phase.
Implementation on the MML
There are a broad range of benefits from implementing a test-run. Value engineering innovative solutions for road bridges and footbridges has the potential to save money and improve relationships with local stakeholders (26). A better understanding of the tunnel infrastructure assists with construction sequencing and preparing logistics and gaining a point-cloud model of the route assists environmental and engineering planning. Over a weekend in March 2019, the 26km MML route was surveyed by the MPS Class 37 running in normal service. After processing the data, the files were transmitted to HS2 and gauging analysis work began in July.
Road bridges
In total, 21 road bridges were surveyed on the route. A selection of these bridges did not have any measurements associated with them in the NGD such as SPC9/78 Metcalfes overbridge. In other cases, CARRS reports had indicated that bridges including TJC1/44 Woodseats Road overbridge had already been upgraded for safe electrification clearance but the NGD records showed them to be foul. In total 6 road bridges were saved during this process with the PVP data providing the justification for less-expensive hybrid Bill design solutions:
- SPC9/78 Metcalfes overbridge changed from a bridge reconstruction to a free-running overhead line design (also shown in Figure 9).
- CHR/90A Rother Way bypass was originally going to be made possible for electrification with a track lower but a fitted overhead line solution was demonstrated gauge clear.
- CHR/91 Lockoford Lane was in the same region as Rother Way bypass and similarly benefited from PVP analysis showing a fitted overhead line solution would be acceptable for clearance purposes.
- TJC1/27 Soaper Lane was earmarked for a fitted overhead line solution but needed additional measurements to confirm the appropriateness of this design. The PVP point cloud data provided the confidence needed to include this solution in the hybrid Bill proposal.
- TJC1/32 Twentywell Lane was a large road crossing that should have been acceptable to install OCS equipment beneath but was missing data from NGD. The PVP data confirmed the safe electrical clearances meaning the bridge only required parapet works.
- TJC1/44 Woodseats Road was also listed as “Skull and Crossbones” bridge – it emerged that this was the name of the bridge that sat in this location prior to reconstruction work in 2016. The new bridge was designed to be electrically clear.
Footbridges
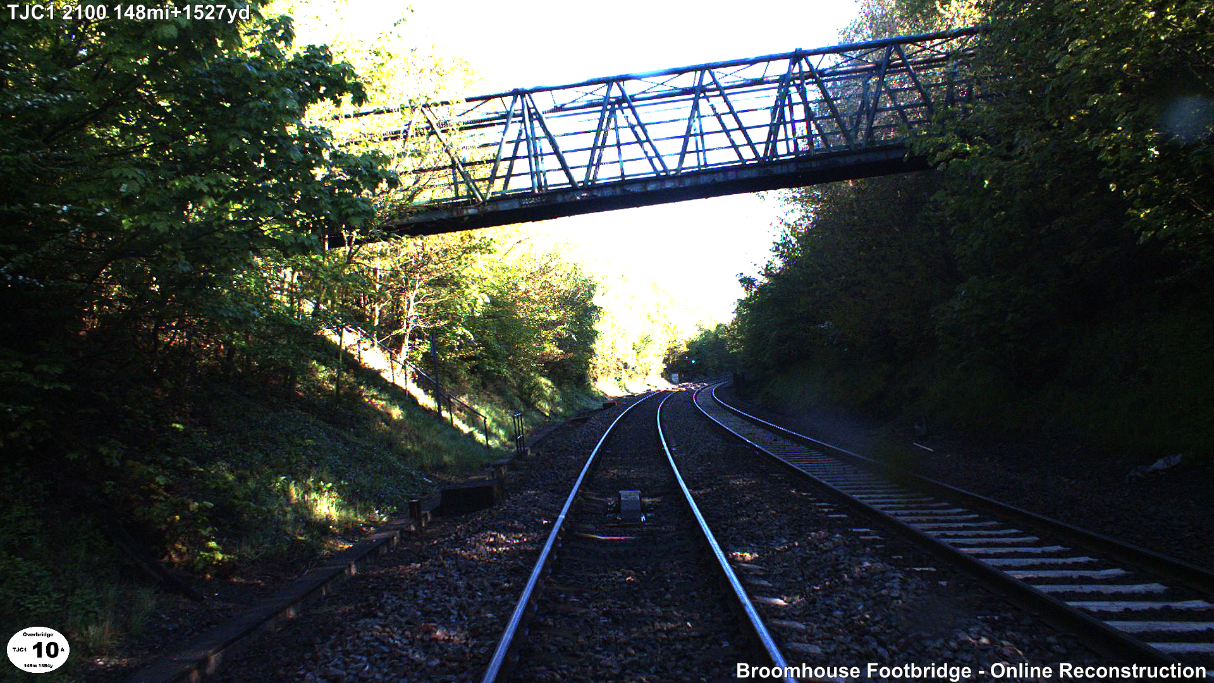
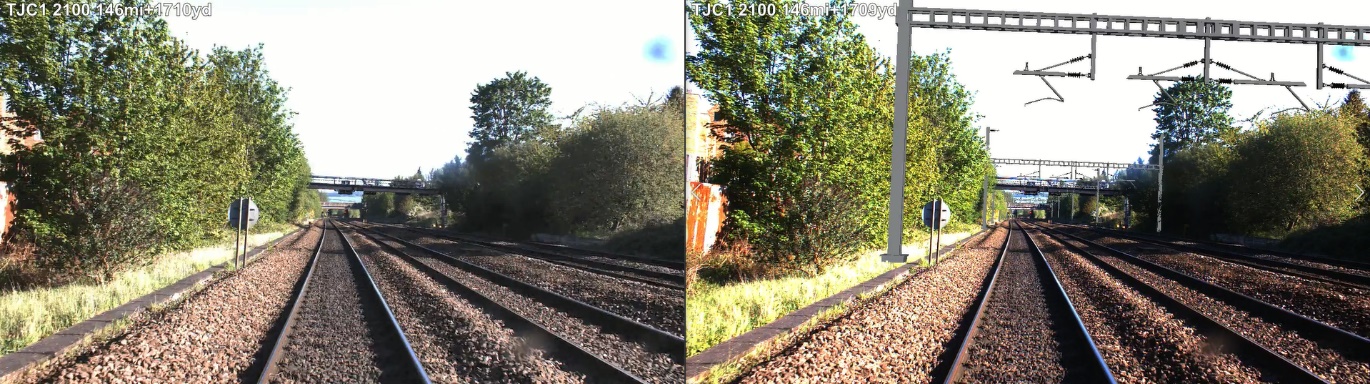
Structural adjustments to footbridges are less complicated than larger road bridges. However, if a change in the deck height alters the accessibility to the crossing by adding or removing steps, Diversity Impact Assessments are needed to study equality of access. Avoiding major reconstruction work on these bridges is a key driver for reducing the complexity and cost to the project. The open nature of common footbridge designs (as shown in Figure 11) means that protective barriers may need to be added to the existing deck to enhance electrical safety. The extra weight and/or wind loading against these barriers may result in the need to replace or reinforce the structure and requires further structural calculations.
There are 7 footbridges on the route to Sheffield; 5 of these were taken forward as DIA reports using the PVP survey data:
- SPC9/68 Markhams footbridge was measured as not electrically clear and in poor structural condition so still needs to be replaced
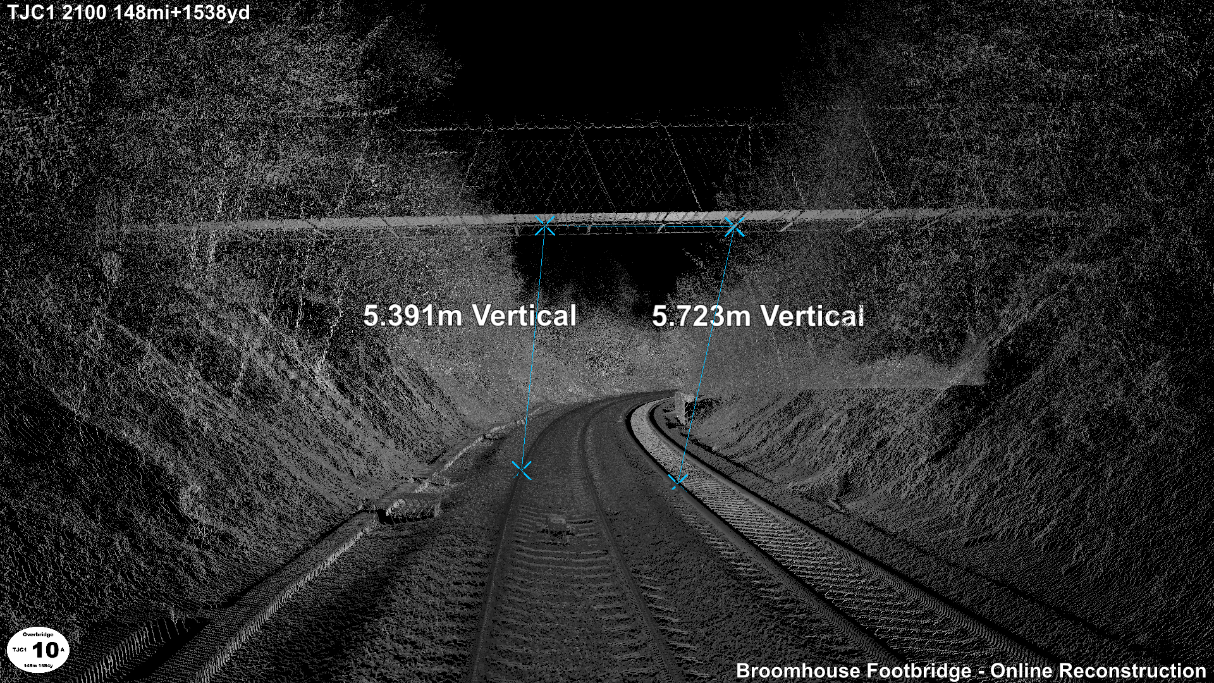
- TJC1/10A Broomhouse footbridge was sufficiently high (shown in Figure 12) but the deck is a mesh construction so the footbridge is scheduled to be reinforced or replaced at the same height if structural assessment shows additional strength requirements
- TJC1/16A Unstone Station footbridge is situated in a decommissioned station and serves as a link over the railway for walkers. There is a potential business case for demolishing this bridge without replacement as it is not electrically clear and alternative crossings exist in proximity to this bridge.
- TJC1/25B Dronfield footbridge is a complicated problem as it is situated in Dronfield station, which although not due to be serviced by HS2 trains, may receive electric traction vehicles once electrification is completed. The CCZ must also be assessed against the risk of electrical incursion from passengers standing on the platform edge.
- TJC1/58 Turner Street footbridge is in poor structural condition and spans Sheffield station. Additional requirements exist for safe electrical clearance in environments accessible to the general public and this bridge is too low for the wire height needed at this terminus.
Tunnels
There is just one official tunnel on the proposed HS2 route to Sheffield. East Bank Tunnel is, (despite its name), defined as a bridge by Network Rail leaving Bradway Tunnel as the sole enclosed electrification challenge on this route section. Measuring 1.8km in length means that the tunnel is longer than the maximum conventional tension length permitted in the Network Rail Master Series manuals. An alternative design solution from the standard is therefore required as overlaps cannot be adequately installed and maintained in reduced clearance environments. Fixed termination equipment permits longer complete tension lengths if evidence is gathered to prove the temperature variation in the tunnel is sufficiently small. Alternatively, Rigid Overhead Contact line solutions may also be considered that remove the mechanical tension but require slightly more headroom to accommodate the larger support registrations.
Early measurement of the tunnel cross-section was vital to determine the level of intervention needed in this area. Prior to running the laser scan through Bradway Tunnel, the working assumption was that a track lower would be necessary for the entire length of the structure. This included significant underpinning of the tunnel walls, the removal of rock bed under the track foundation and acknowledging the potential of uncovering cavities due to local mining activity. The total work package was sufficiently large, that alternative new tunnel routes were costed to compare against the scale of intervention at Bradway Tunnel.
The data gathered in the PVP survey was processed in a standalone report by a specialist firm called DGauge (27) to assess the electrical clearance throughout the tunnel. The findings indicated that for most of the tunnel, no track-lowering would be needed to accommodate the system height of an overhead conductor bar solution. Discrete areas were shown to need minor amendments to the tunnel lining, with the option of bespoke OCS design in these examples as a later design stage opportunity (28). The result was that the overall cost estimate of the Bradway Tunnel intervention could be significantly scaled back.
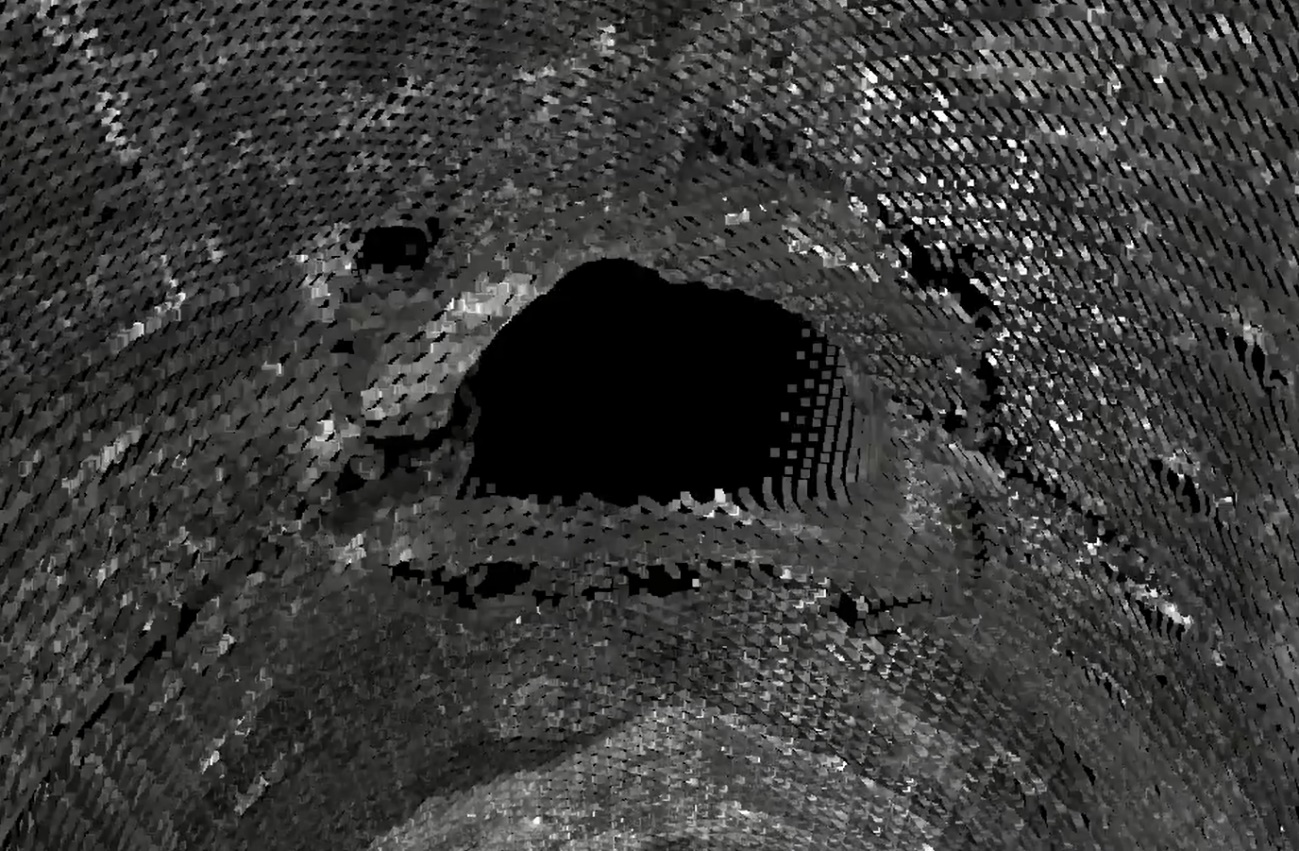
A further benefit was the ability to pick out the precise locations of the ventilation shafts in the tunnel. Whilst these are documented in CARRS reports, the geotagged positions of these shafts are extremely useful for the planning of OCS supports along the soffit. An image of one such ventilation shaft can be seen in Figure 13 above.
Modelling Overhead Line
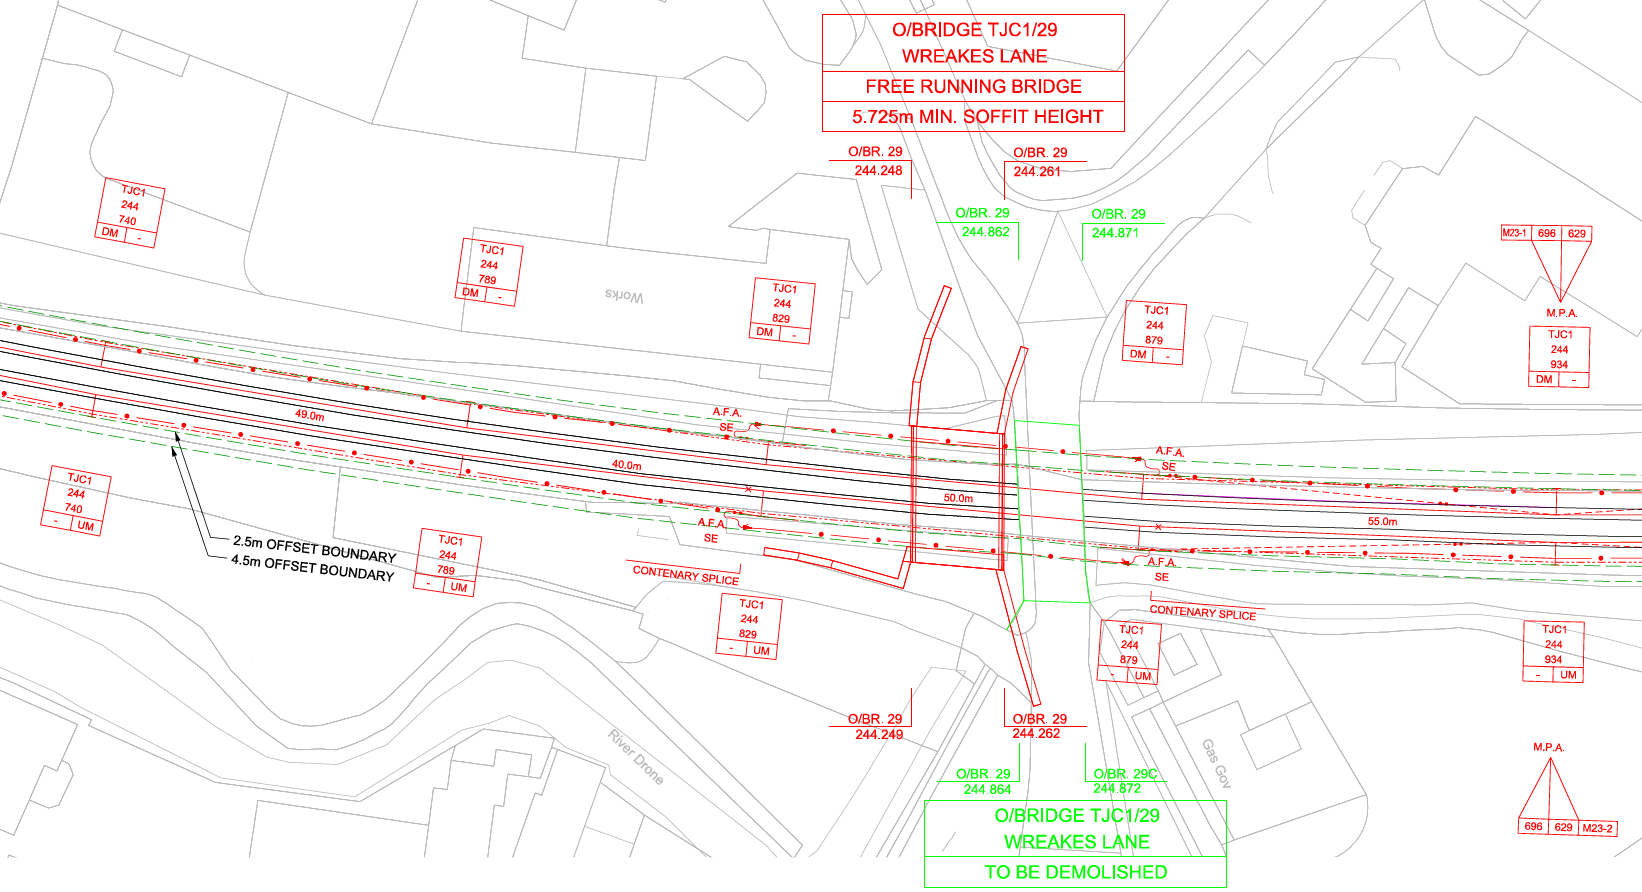
Although this route was at an early stage in the OCS design process, the best way to prove the feasibility of electrification on the MML was to prepare a proof-of-concept design. A diagrammatic representation of the tension lengths was produced (29) and from this, approximate layout plans were developed. These drawings provide a top down view of the railway with positions of foundations marked and indications of the type of equipment proposed in each area. At this stage in the process these geometric plans of the infrastructure did not need to be exact but were intended to indicate how the OCS would fit around the change in track design and civil structures. Figure 14 shows how the aerial autotransformer feeder wire (also known as the negative feed) is anchored and transferred to ground level cables underneath the proposed reconstruction of the low clearance Wreakes Lane overbridge (30).
With PVP, these layout plans can be converted to augmented reality BIM visualisations. The railway chainage shown on the diagrams can be converted to ordnance survey co-ordinates and the equipment can be represented by equivalent models in the software asset library. This is not a true representation of the finished installation but provides an indicative visual of the electrification system. Figure 15 shows examples of single-track cantilevers and 4-track portal booms added to the route. These can also be examined and interrogated as videos and in 3D point cloud view in addition to the stills shown here. The assets are saved in a reference file and can be stored in timeframes (equivalent to layers) meaning that asset types and design phases can be grouped together and toggled on/off as required.
Conclusions
This paper discussed the application of modern surveying techniques to improve the confidence and efficiency of assessing railway overbridges for overhead line clearance assessments. Network Rail’s PVP software was used for the purposes of preparing the MML for electrification. The utilisation of MPS train-borne monitoring gave full detailed laser measurements to assess the clearances at each of the overline structures on the 26km route.
The technological benefits are:
- Safety: No staff were required to walk the lineside and all civil infrastructure along the route could be analysed in detail from the safety of an office environment.
- Cost: The data recorded from these test runs provided a repeatable measurement pack to determine the gauging limitations of the railway. This allowed the team to identify innovative design solutions that reduce the amount of structural interventions, interruptions to services and environmental impact.
- Time: The gathered data was collected in a fraction of the time of equivalent surveys. The recorded information is then available to be analysed in perpetuity.
This data will continue to assist environmental and engineering designers and those involved in stakeholder engagement, construction planning and future surveying. The early gathering of this information saves money for the project in the longer term and was captured in a safe and timely manner to meet the schedule of the hybrid Bill programme. Adding the OCS meta data to the files results in a visualisation tool that can further aid the progress of electrification in latter design stages. The continued use of this technology at HS2–NR touchpoints adds to the assurance of the design decisions and gives the best overview of the connections in these areas. The 4K video footage remains a snapshot in time for the legacy of the project.
Acknowledgements
This project was originally co-ordinated by Kuldeep Sungher when he worked for the HS2 MML team in 2019. His management of the contracts specifying the survey limits is greatly appreciated. The Network Rail Signalling Innovation Group were key contributors, running the training for PVP and arranging the licences for software installation. Thanks also go to the team at WSP, managed by David Starbuck for their work producing the gauging assessments and OCS designs; with particular thanks to Andy Bestwick, Kate Wilson and Dave Johnston.
Final thanks go to Luke Agbenyo, Andy Keasley, Jeremy Claxton and Prue Fan for their contributions to this technical paper.
References
01. 2RS02-WSP-RT-REP-L009-000001. Midland Main Line Electrification Gauging Report, Bestwick, Andrew. January 2020.
02. HS2 MML Campaign Board. Keasley, Andy. CP3. February 2020.
03. Overhead Line Electrification for Railways. Keenor, Garry. 5th Edition. April 2019.
04. CENELEC Railway applications. Supply voltages of traction systems. BS. EN 50163:2004+A1:2007.
05. CENELEC Railway applications – Fixed installations. Electric traction overhead contact lines. BS. EN 50119:2020.
06. CENELEC Railway applications – Current collection systems. Technical criteria for the interaction between pantograph and overhead line (to achieve free clearance). BS. EN 50367:2012+A1.
07. SNCF IGTE CES11/400100. Technical Specification Overhead Contact Line V360 TSI. Revision D. February 2020.
08. 141667-FAF-MAN-EOH-000001. UK Master Series System Description Manual, Daffern, Rob. Issue 1.2. February 2017.
09. 141667-FAF-MAN-EOH-000002. UK Master Series Allocation Design Manual, Ramkhelawon, Anesh . Issue 1.8. February 2017.
10. CENELEC Railway applications – Insulation coordination – Part 1: Basic requirements. Clearances and creepage distances for all electrical and electronic equipment. BS. EN 50124-1:2017.
11. CENELEC Railway applications – Fixed installations. Electrical safety, earthing and the return circuit – Part 1: Protective provisions against electric shock. BS. EN 50122-1:2011+A4 .
12. RSSB – Providing safe electrical clearance at platforms to live electrical parts on rolling stock: . Feasibility of using non-conducting pantograph horns; Conway, Steven. Current Collection Solutions. April 2019.
13. GE/RT 8273. Assessment of Compatibility of Rolling Stock and Infrastructure – Gauging and Stepping Distances. Issue 1. December 2015.
14. GM/RT 2173. Requirements for the Size of Vehicles and Position of Equipment. Issue 2. June 2018.
15. GL/RT 1210. AC Energy Subsystem and Interfaces to Rolling Stock Subsystem. Issue 1. December 2014.
16. GI/RT 7073. Requirements for the Position of Infrastructure and for Defining and Maintaining Clearances. Issue 2. June 2018.
17. NR/L2/ELP/27715. Electrical and Mechanical Clearances and Separation. s.l. : Network Rail. Vol. 4, Issue 3. September 2018.
18. GE/GN 8573. Guidance on Gauging and Platform Stepping Distances. Issue 4. December 2015.
19. ClearRoute2 (TM) Gauging Assessment reference material.
20. Multi Platform Surveying (MPS) . Signalling Innovations Group Information Page.
21. Signalling Innovations Group Survey Support. Signalling Innovations Group Information Page.
22. OmniInspector reference material.
23. Positioned Video Pixels (PVP). Signalling Innovations Group Information Page.
24. Omnisurveyor3D reference material.
25. 2RS02-WSP-DS-NOT-L009-000001. Midland Main Line Bridge Clearance Requirements Technical Note – OCS; Moss, Andrew. P03. March 2020.
26. W1132S-WSP-REP-ETR-000016. Cardiff Intersection Bridges Gauging Report for Nominal Vehicle Heights; Freestone, David. B06. November 2019.
27. DGauge company background.
28. WSP069-MML-BRADWAY-RPT002. Bradway Tunnel Pantograph and OLE Clearance Assessment; Willison, Jennifer . Issue 2 . December 2019.
29. 2RS02-WSP-RE-DSK-L009-000001 . Midland Main Line Tension Length Diagram; Johnston, Dave. P01. April 2019.
30. 2RS02-WSP-RE-REP-L009-000008. Phase 2b 2RS02 Midland Main Line Electrification OCS Design Report; Johnston, Dave. P03. October 2019.
Notation
BIM Building Information Modelling
CARRS Civils Asset Register and Reporting System
CCZ Current Collector Zone
Cct OCS construction tolerance
Cdcl Design contact wire height
Cmt OCS maintenance tolerance
Csd OCS system depth
Cwu OCS uplift
Cww Contact wire wear
CHR Engineers Line Reference for Chesterfield region
Ds Static clearance
Dp Passing clearance
DIA Diversity Impact Assessment
HP Highest point of OCS
HS1 High Speed One Ltd
HS2 High Speed Two Ltd
LIDAR Laser Imaging, Detection and Ranging
LP current collector width
MPS Multi-Platform Surveying
NGD National Gauging Database
NR Network Rail
OCLZ Overhead Contact Line Zone
OCS Overhead Contact Line System
OLE Overhead Line Equipment
PVP Positioned Video Pixels
R Radius of curvature
S1 width of lateral movement of current collector
S2 lateral safety distance of broken or dewired current collector
S3 vertical safety distance of broken or dewired current collector
Sh Structure soffit height
Sel electrical clearance defined in EN 50119
SH Maximum height of current collector zone
St Structure construction tolerance
SPC9 Engineers Line Reference for St Pancras to Clayton Junction region
TCL Track Centre Line
TJC1 Engineers Line Reference for Tapton Junction to Sheffield region
TOR Top of Rail
X maximum unidirectional (half) horizontal OCLZ from top of rail level
Y maximum unidirectional (half) horizontal CCZ
Z distance between HP and SH
Peer review
- Dr Sonia Zahiroddiny, Head of Digital EngineeringHS2 Ltd