Environmental surveys management – digital innovation
The management and delivery of environmental surveys on a scale as large as High Speed Two (HS2) is an inherently complex challenge. Within HS2 Phase 2a, contractors have been working to deliver 20 different ecology survey types that could potentially be undertaken across over 6,000 land parcels, all with unique rules and constraints.
To manage this scale of surveys, a system has been implemented to collect survey data in the field digitally using the Esri ArcGIS Collector App, which has produced efficiencies in data collection, management, and submission. Data capture requirements are defined and then enforced within a mobile data capture application. Survey results entered via the application are uploaded directly to a spatially enabled database, ensuring a single source of truth and allowing the implementation of rules to ensure robust data. The production of extract, transform and load workspaces has allowed automation of data management processes and the creation of web-viewers has simplified quality assurance and provided live data views, ahead of periodic data submission. The benefits of digital data have also been leveraged to streamline a number of survey project management functions, including progress tracking.
Implementation of the digital solution has created efficiency through a reduction in manual processes, achieved a significant improvement in data quality and consistency, and provided earlier data visibility, supporting robust decision making for HS2 Ltd and other stakeholders. The benefits of the digital solution have already compounded as the dataset increases in size and complexity. Thorough documentation of the application of a digital data collection approach on a survey programme of this scale will enable the transfer of learning to other major projects, supporting the increasing requirement for data driven environmental decision making.


Introduction
Understanding environmental risks and benefits is part of the development process for major projects. For most projects, the existing environmental baseline at project commencement has data gaps and therefore environmental surveys are essential to early project development to support formal processes such as Environmental Impact Assessment (EIA) [1]. Surveys ensure that the potential environmental impacts are understood, inform stakeholders’ decision making, influence design development through measures to be taken to prevent or reduce impacts and provide enhancement, and allow the effects of the project to be monitored through construction and operation [2]. Environmental surveys have complex requirements and a wide variety of stakeholders including developers, regulators, environmental consultants, designers and contractors. Traditional methods of conducting environmental surveys utilise paper-based maps and forms manually translated into spreadsheets or written reports for submission to the client via email or online portal. For small projects on constrained sites this traditional approach is sufficient as the datasets are small and the information they contain is often unique to the project site, allowing the environmental consultant to provide a clear and in-depth assessment. However, projects at the scale of High Speed Two (HS2) challenge traditional methods of data management.
Within HS2 Phase 2a – the section of line that will extend HS2 from Fradley in the West Midlands to Crewe in Cheshire – the survey area covers over 10,000 ha, split into more than 6,000 third-party owned land parcels. As many as 50 different surveys could be needed on each land parcel, each with its own methodology to ensure execution to the required standard. Delivery of surveys at this scale is a complex, resource-intensive task which, particularly when using traditional methods of data capture, presents significant challenges to maintaining data integrity, even with a robust management framework in place. The challenges presented by the scale of HS2 Phase 2a offers opportunities to innovate. Digital technologies could be introduced to replace traditional survey methods, introducing efficiencies and defining a new standard for delivery of survey data. The key aims of introducing a digital approach were to introduce a system of data capture directly into a database, automate and reduce manual intervention where possible, and improve efficiency and data integrity.
This paper will explore how Arup, working under the C861 Design and Environmental Services contract, delivered a digital solution for HS2 Phase 2a environmental surveys. It will first describe the methodology and development works undertaken to achieve the solution, then provide an overview of the functionality of the delivered product and the benefits that have been realised by its implementation. It will conclude with a reflection on future use cases and further development opportunities.
Methodology
Pre-development
After defining the key aims, a proof-of-concept trial was conducted to evaluate how digital technology could be applied to surveys in practice. The market was assessed to find a suitable commercial off-the-shelf (COTS) mobile data capture software that could host field data and could readily integrate into the GIS infrastructure being used on the project.
Subsequently, an initial database was designed which integrated the ecological requirements captured within the existing proforma data schema into the GIS data schema. Mobile data capture was trialled in the field using the new database and compared by surveyors with traditional survey methods. The success of the trial allowed conclusions to be drawn regarding efficiencies, improved reliability, and quality of data that a digital solution would offer. The data captured using the digital approach were recorded directly to a database and automatically converted to two project deliverables – a GIS schema and a proforma data format.
The proof-of-concept trial was also used as an opportunity to further define key aims. The agreed aims for the digital solution were to:
- Capture data directly into a database during field survey;
- Automate repetitive, manual tasks that risk human error and which are labour intensive;
- Automate the assurance process where possible, maximising consistency and quality of data;
- Apply attribute rules and automated calculations to reduce surveyor input needed during field survey;
- Allow for both current and future potential integration with other aspects of survey management, including progress reporting, health & safety, land access and scheduling, to maximise reach of benefits;
- Provide a deliverable package that could be redeployed on other stages of the project, including development documentation; and
- Document an approach adoptable across the UK on other major projects
Development framework
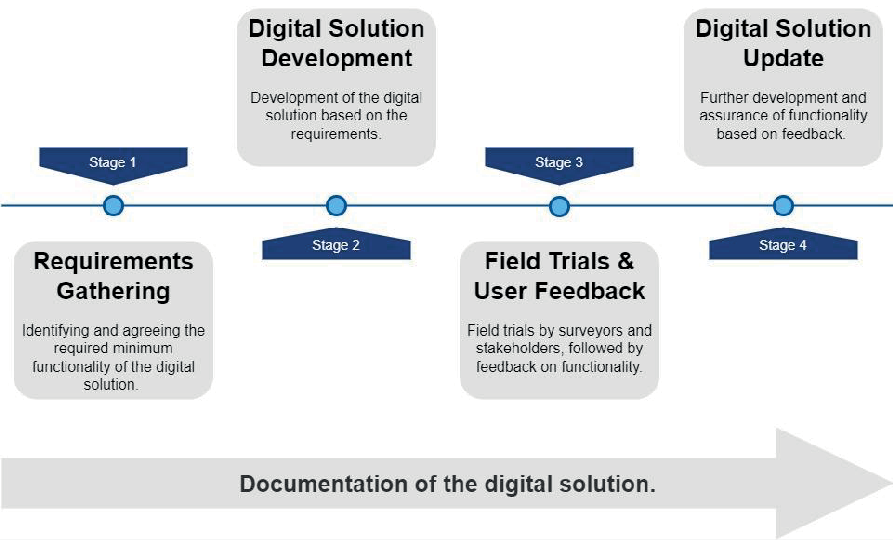
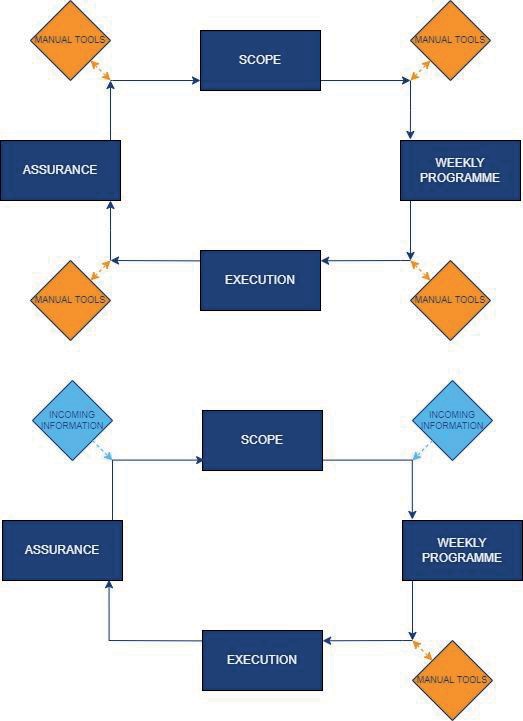
A staged development framework, illustrated at Figure 1, was set to guide the execution of the works. Additionally, an agile project management approach was adopted to ensure an incremental and iterative approach to development that would allow substantive input and feedback to be provided at regular intervals by HS2 Ltd, environmental consultants and ecological surveyors, and regulatory bodies. The COTS software Jira and Git were used to manage development changes and to control versions of automation processes. This provided a development record and enhanced quality assurance of development works.
Stage 1: Requirements Gathering
Requirements gathering is a critical project stage to define the parameters of the development works prior to commencement, ensuring that clear tasks for delivery are agreed, enabling the product owner to monitor progress throughout, and limiting scope creep.
Requirements were captured from key stakeholders to identify the functionality required to achieve the aims of the digital solution. A series of sessions were held to engage stakeholders including the product owner, environmental consultants and survey project managers. Requirements were categorised using the MoSCoW [2] prioritisation method to focus upcoming development works; under this method each requirement received an assessed rating of ‘Must do’, ‘Should do’, ‘Could do’ or ‘Won’t do’.
Requirements were recorded in a best-practice requirement register which was agreed with and issued to the product owner. The register was used to shape the product backlog for the digital solution development stage.
Stage 2: Digital Solution Development
Development of the digital solution required consideration of a series of complex inputs, including stakeholder and user requirements, COTS software data structures and wider project constraints. The development challenge was to bring these elements together, resulting in a coherent product that gathered all required data whilst remaining user friendly.
The following sections present an overview of the development work.
Software Selection
A key requirement defined by the product owner was to maximise ease of use, value-for- money, interoperability and future use opportunities by using COTS software, leveraging systems that were already in use on the project and limiting custom development to develop a Minimum Viable Product.
A cross functional analysis was undertaken to assess several COTS software options, with Collector for ArcGIS by Esri considered the most suitable option for the project. It provides the functionality to store large data sets and records all necessary geometry types
(points, lines and polygons). Many users and stakeholders were already familiar with Collector, which helped to reduce development and configuration time and eased the transition from traditional methods of capturing survey results data.
Table 1 summarises all COTS software selected for the solution, and how it has been used.
Table 1. COTS software utilisation
|
Software |
Process/task it was used for |
|
Collector for ArcGIS |
Mobile data capture in the field, easily configurable to developers and familiar to many of the stakeholders. |
|
Portal for ArcGIS and ArcGIS Server |
Hosting services required for mobile and web applications and providing a template for developing web applications quickly. |
|
ArcGIS Pro |
Desktop management of the database and configuration and publishing of services to Portal/Server. |
|
Microsoft SQL Server |
Enterprise database to support multiple simultaneous users accessing and updating data. Such databases enforce integrity of data being captured, helping to improve the quality of the data, and their subsequent value to consumers. |
|
FME (Feature Manipulation Engine) |
Automated post processing, quality assurance (QA), and extract, transform and load (ETL), allowing for development of complex workflows without the need for coding knowledge. |
Solution Architecture
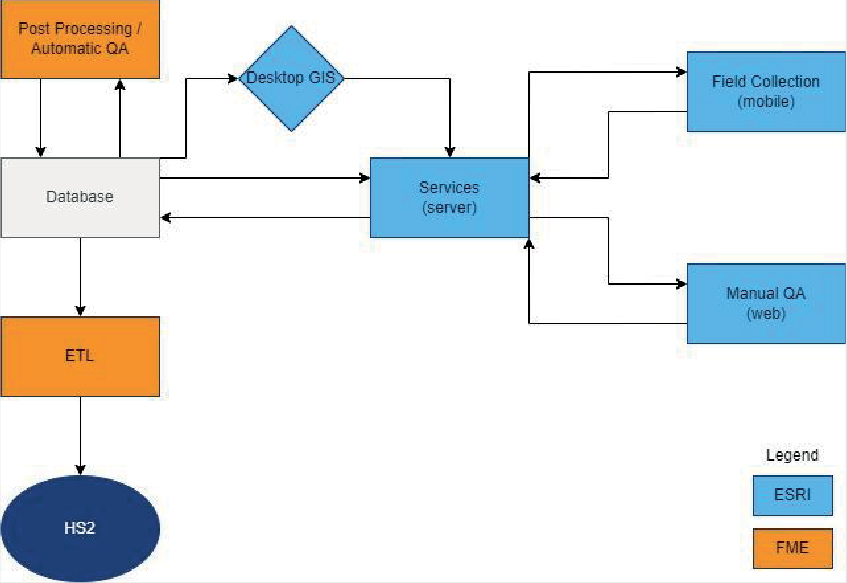
Figure 2 presents a flowchart of the digital solution architecture. Implementation of the digital solution largely consisted of database development to support use of the software outlined in Table 1. Users access the database via mobile or web applications, using services published to a server from a desktop GIS platform. Automated processes (post-processing, QA, and ETL) are applied to the database as part of the workflow, minimising repetitive manual tasks.
Database Development
A database schema was provided by HS2 Ltd defining the required format and content for data delivery. Stakeholder engagement and analysis of software requirements identified that a modified version of the schema targeted at data capture and survey management would better facilitate use with the mobile data capture app. Data gathered in this modified schema would therefore need to be translated back into the original HS2 schema optimised for data delivery prior to submission. Toolboxes were developed to automate the schema conversion to support the mobile data capture application and ETL models were developed to automate data conversion back to the HS2 schema. All modifications to the HS2 schema were documented in a methodology document and, additionally, the series of toolboxes that delivered the schema modification effectively documented the processes performed and supported peer review of changes being made. Examples of modifications to the schema and their benefits for the data capture and survey management stage of the project are outlined below.
To maximise usability of the mobile data capture app for surveyors in the field, certain metadata fields were removed, such as the HS2 contract code, as these fields and their values could be restored and more efficiently populated during the ETL process. User-friendly aliases were added to tables and feature classes within the database schema, to ensure consistent naming of layers and tables within maps and improve ease of use.
Feature classes in the HS2 schema were reprojected from British National Grid (EPSG:27700) to the Web Mercator (EPSG:3857) projection used by the software provider’s mobile data capture application and web services. It is considered to be best practice for datasets used in web services to use the same projection system [4][5]. The OSTN15 transformation from the Ordnance Survey was used to perform this reprojection [6].
Relationship classes were added to enforce relations between tables and feature classes. To fully support the relational model, Global ID fields were added to all tables, and corresponding GUID foreign key fields were added to the table that required them. The use of Global IDs for relationships is a requirement to enable offline editing [7] of data within the mobile data capture application. Other geodatabase features were also enabled on tables and feature classes to support offline editing [7].
This included Editor Tracking, and Archiving[8]; in combination these provide a way to keep a history of every change made to a database record, including when they were made and by whom. This was important given that use of the application in the field was likely to be undertaken without an internet connection given the remoteness of much of the areas to be surveyed. While Global IDs are used internally by the geodatabase to uniquely identify records, the HS2 schema requires generation of unique IDs following a specified format. To support this, a database sequence was created, and the Attribute Rules [9] geodatabase feature was used to automatically generate a further ID in the desired format at the point when a new record was created.
Tracking survey progress was one of the requirements identified to extend the benefits of the digital solution and enhance survey management and reporting. To support this, extra fields were added to the primary table for each survey, enabling the user to record if they were able to access, start and complete the survey. Adding these fields meant that a record could be created for a survey that was attempted, or started, but not completed, improving survey management. To ensure that a justification and reasoning were recorded for incomplete surveys, an automated QA check ensured that any such surveys recorded explanatory text in the SurveyDetails attribute of the survey extent. Another addition to the database schema to enhance survey management was a QA records table. This table was related to the main survey table for each survey type and used to record the QA status for each survey, tracking the status of the QA process. The QA table was configured to use Attribute Rules [9] to automatically update usernames and dates when the status changed.
Further modifications were made to individual survey tables to meet specific needs identified through requirements gathering, including the addition of fields, modification of domains, and addition of attribute rules to calculate values automatically. Domain modification within database tables in particular was important to enforce data integrity and supporting data capture. Domains restrict the possible values that can be entered into a field, for example allowing only “Yes, No, Unknown” to be recorded. Finally, where the survey type required photographs to be captured as part of the survey or for QA purposes, the attachments feature [10] was enabled. This functionality allows photos to be captured directly into the database, maintaining database integrity.
GIS Services Development
In line with the minimum viable product methodology, and with the majority of field configuration completed at the database level, minimal additional configuration was needed to create services to support the web and mobile applications. To make the databaseaccessible to users, a number of services were created using desktop GIS products to publish maps to the GIS server. Two services for each type of survey were created, one focused on data capture, and one focused on data QA. Using the desktop GIS product, feature classes and tables from the database schema were added to a series of survey maps. The symbology for each layer was configured to only show features relevant to each survey. For some survey types, fields were also reordered in the layer/table settings to expedite data collection in the field. Each map was published to the server as a feature layer (feature service), with the ability to edit and sync the data enabled. This allows the data to be edited using both web and mobile applications, and the option for the user to download offline working areas to their mobile devices. Once published in the server, the feature layers were added to Web Maps for use by web and mobile applications. Figure 3 shows an example of a Web Map as viewed via a web application.
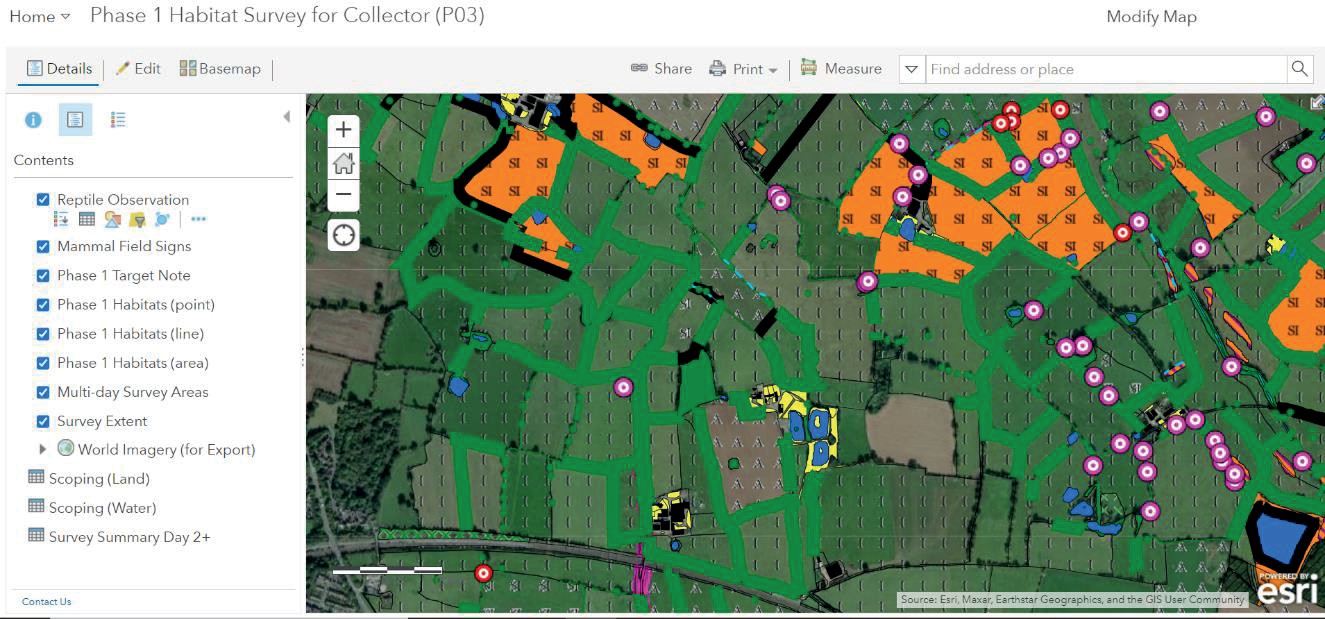
Map image is the intellectual property of Esri and is used herein under license. Copyright © 2020 Esri and its licensors. All rights reserved.
Within the settings for each layer and table in the Web Map, the visible status of fields can be modified to present the user with the minimum set of fields required to complete their task. In the mobile data capture application, only fields required to be populated during field surveys are visible. However, in the web-based QA application, additional fields updated or populated in post processing are visible. Additional customised settings were also applied, such as formatting the start date field to display only the day avoids the user being asked to enter the time where this information is not relevant or required.
Front End Configuration
The mobile data capture application builds data entry forms based on the field settings configured in the database or Web Map, and displays appropriate controls, such
as providing a date picker for date fields and drop-down lists for fields with coded value domains.
Post-processing & Automated QA
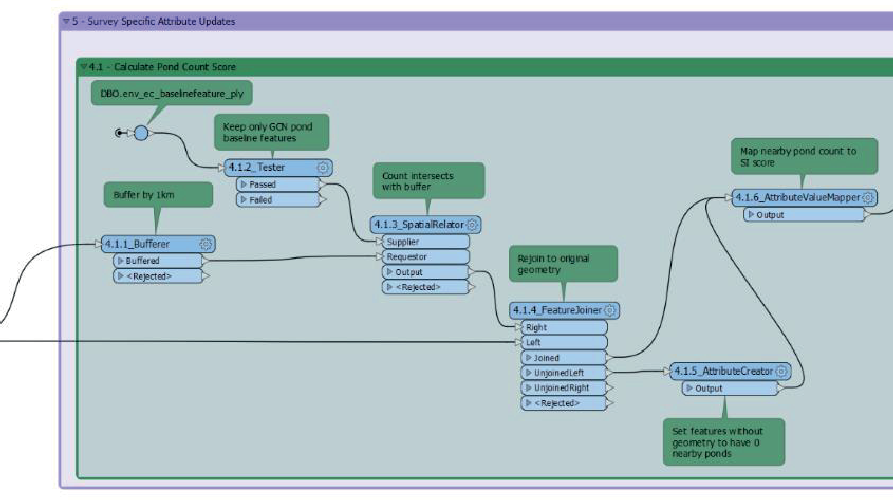
Field data capture effort has been minimised by making effective use of post-processing automations through development of FME models. Post-processing automations targeted fields that do not require interpretation such as the length of a hedge, or area of a pond. Post-processing was designed to run on a schedule, updating the collected data at regular intervals. Figure 4 shows an example of typical post-processing automations. In this example, a 1km buffer zone is applied to a GCN pond feature and then all other GCN ponds within that buffer are counted, and the count is applied as an attribute value of the original feature.
Additionally, as part of post-processing, automatic QA of captured data has been developed. These automations check for:
- issues that are common across all types of surveys, for example geometry validity, and confirmation that required relationships are present;
- completion of fields identified as required; and
- specific QA requirements identified for individual survey types.
The requirements for automated QA checks were developed in consultation with ecologists, ensuring that the rules are appropriate for the survey. Potential checks were logged in a register, along with development and ecological notes, and a record of development completion.
Because a modified version of the HS2 schema was used for data capture, an automated ETL task was set up to export data back to the original schema format. The ETL task comprises the following processes:
- All records in the database are checked to confirm they have passed all stages of the QA process before being exported;
- The fields previously removed from the schema to simplify data collection are reintroduced with appropriate values, and any modified domain values are mapped to the appropriate value in the HS2 schema;
- Any additional fields and tables are stripped from the exported data;
- Images attached to the data are exported to a standard folder structure, assigned an appropriate name according to HS2 naming conventions, and photo reference fields in the data are updated with the new image names, ensuring data is correctly associated with files; and
- The data are written to a transfer database.
Stage 3: Field Trials and User Feedback
Field trials were organised for different groups of stakeholders to assess functionality of the digital solution and provide feedback.
Stage 4: Digital Solution Update
Following the collation of feedback from field trials, potential new requirements for development were identified. New requirements were rated using the MoSCoW prioritisation, taking into account input from ecologists, developers and the product owner. Where possible, solutions were sought that addressed multiple similar or interrelated requirements to maximise efficiency. This process was iterated until a minimum viable product was reached.
The Digital Solution
A summary of the operational functionality of the developed digital solution is outlined below.
Survey Preparation
For each survey type, a map is configured in the desktop GIS application, containing one or more feature classes or tables from the database. Maps are published from desktop GIS to a GIS server as Feature Layers. These Feature Layers are then combined in a Web Map with other layers, such as a base map. Some additional configuration occurs at this stage, for example hiding fields from view, marking fields as read only, and setting display formats for fields.
Mobile data capture application
The mobile data capture application allows the field surveyor to open a map of the area they need to survey. The map provides all the necessary datasets to conduct the survey and record its result. Information relating to health and safety and land access is currently provided separately. Within the data capture application, users are able to query, create, and edit data geometry and attributes, and capture images that are automatically linked to the survey data.
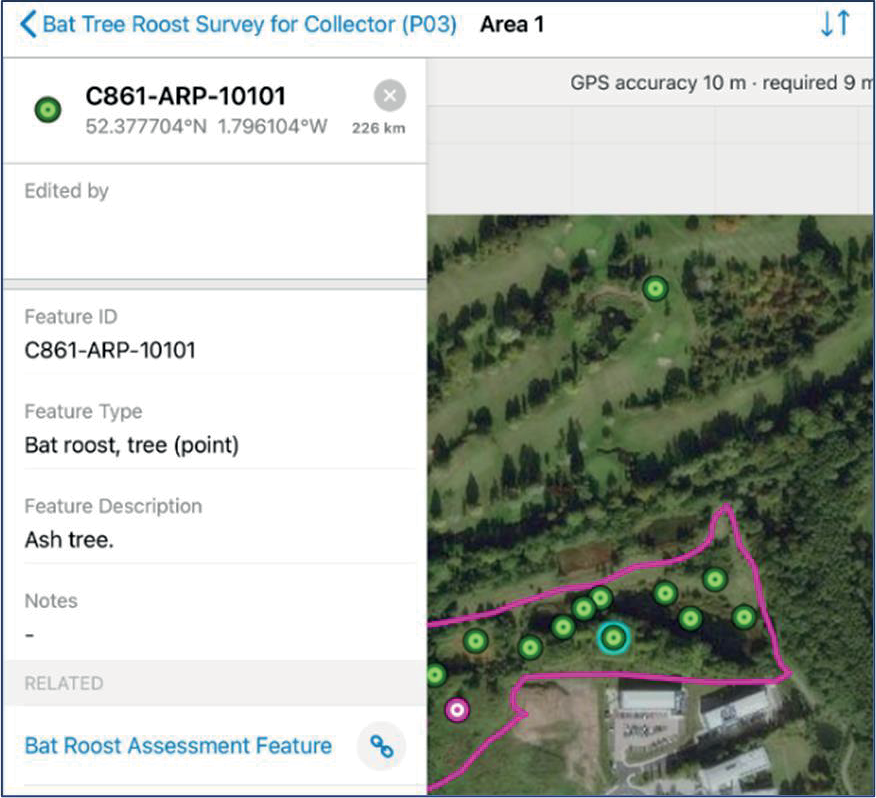
Map image is the intellectual property of Esri and is used herein under license. Copyright © 2020 Esri and its licensors. All rights reserved.
Some geometries and attributes are pre-populated during the scoping and scheduling process. Additional attributes are calculated as part of post-processing automation, allowing the surveyor to focus on field data collection. As part of its default functionality, the application can download data prior to the surveyor going to site. This is especially important for environmental surveys as network coverage can be poor so access to the data is available in an offline portable environment. The surveyor completes the data tables via the application interface, which ensures that mandatory fields are completed, and data is entered in a pre-determined format. After a survey is completed the survey result can be synchronised to the central database as soon as access to 4G or Wi-Fi is available.
Post-processing
Automated processes run directly against the data in the database, performing post processing, QA, and ETL tasks. Post processing tasks help reduce the amount of data users need to enter during the field survey. Tasks include updating fields that do not require interpretation or may be difficult for the surveyor to define in the field, for example calculating the number of ponds within 1 km distance for an amphibian HSI survey. An automated QA process also runs against the data for each type of survey, performing basic checks such as confirming valid geometry, but also applying the rule-based tests developed with stakeholders. This can include the identification of data gaps or inconsistencies. The automated QA checks result in generated comments being added to the QA record for the survey and can optionally fail the QA for that survey. As this process occurs at regular intervals and can also be run on demand, a user performing manual QA can identify records that need attention as early as the day following the survey, and any automatically identified data issues will already be outlined for them.
Quality Assurance Platform
The data from the field survey are directly submitted to the centralised database, making them available to the wider project team for viewing and QA. At this stage the surveyors or representatives of the surveying contractor can review their data and sign off for the next QA step. The survey information, including photos, and QA records, can then be reviewed and signed off by a lead ecological specialist. All these processes are recorded in the same database providing consistent and easy access to all information and allowing for progress monitoring and reporting of survey data and QA completion.
Extraction and submission
Finally, the automated ETL process is used periodically to extract the data which have passed the QA from the database to a suitable delivery format, specified by HS2 Ltd. Finalised data can then be used to support project requirements, such as identifying further surveys or applying for ecological licences.
Benefits
The benefits of a digital solution for survey management include both immediate efficiency benefits to HS2 Ltd and delivery partners, and wider technical benefits that will be realised as works on the project proceed. The digital solution has been implemented on ecological field surveys and has already achieved its aims across data integrity, data availability, interoperability and reporting and monitoring as detailed in the following sections. The immediate value of the solution has been clear, and whilst the longer- term potential is difficult to quantify at this early stage of usage, recommendations for potential future benefits and opportunities are also outlined in the following section.
Data integrity
The digital solution provides a more robust approach to data management than the previous system at all stages of collection, handling and submission. The move from a spreadsheet-based system to a database has meant that manual handling of data is almost entirely eliminated. The digital solution reduces the potential for surveyor error by enforcing the required data format at the point of data capture, and the quality assurance of data through a dedicated platform has eliminated the manual errors that often occur when manipulating very large spreadsheets. The use of additional automated quality assurance for basic and definable checks increases data consistency and allows quality assurers to focus on ecological issues. Finally, when data is submitted, they are no longer bifurcated into separate spatial and non-spatial formats, ensuring a single source of truth. These improvements in data integrity have created an almost entirely closed-loop system, as outlined in Figure 6, and ensure the provision of compliant datasets to HS2 Ltd and wider stakeholders along with increased confidence in any analysis of and subsequent decisions based upon the data.
Data availability
The digital solution facilitates more frequent delivery of survey data due to the simplification and streamlining of data capture and the automation of the QA process. The data delivery process in the previous system was limited by the time and resource constraints of manually preparing a data submission. Data were previously submitted once at the end of the collection season; the digital solution facilitates the rolling delivery of data packages, supporting earlier and more robust information and decision making that is able to feed into design development.
Data capture using the digital solution also supports near-live data viewing online as soon as surveyors have synced their device to the server post-survey. Access to this draft data has been made available to limited key stakeholders through web-based data viewers such as web maps. Whilst these data are heavily caveated due to its non-assured status, they allow stakeholders an early look at the developing data for indicative purposes.
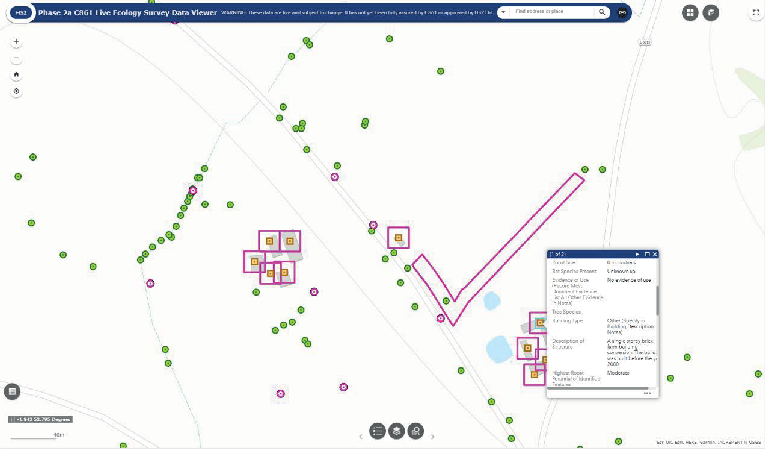
Map image is the intellectual property of Esri and is used herein under license. Copyright © 2020 Esri and its licensors. All rights reserved.
Monitoring and reporting
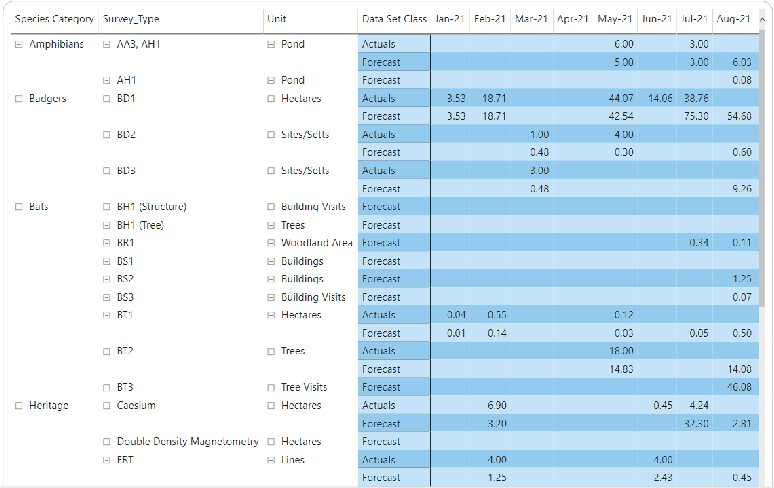
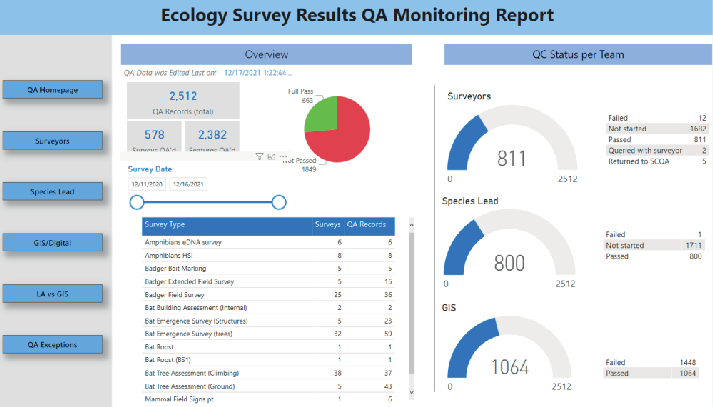
The digital solution has also reduced reliance on multiple complex spreadsheets. The previous approach of reporting and monitoring via spreadsheets required substantial manual processing, which in addition to being inefficient also introduced risk of human error. The digital solution database enables progress reporting and analysis to be partially automated which creates a time saving. Many project management functions can now be achieved by accessing the database via a business analytical software interface, providing clear and accessible reporting from a single source of truth (Figure 8). The near-live completion status of surveys, combined with the use of a digital scope, has allowed progress to be more promptly and accurately monitored. The digital solution also facilitates tracking of useful supplemental information such as QA status (Figure 9).
Interoperability
The digital solution implemented on the HS2 Phase 2a environmental survey programme has demonstrated the significant improvements in efficiency and consistency that can be achieved through adopting a digital approach at this scale. The approach has been thoroughly documented, both in terms of technical set-up and user guidance, so that learning can be transferred to and built on by others, and lessons from implementation have already been shared both with HS2 contractors and other major projects including East West Rail, where learning was utilised to enable an expedited start to the survey programme, ensuring outputs could feed into early design.
Recommendations
The digital solution was developed specifically as a minimum viable product for use in undertaking environmental surveys on HS2 Phase 2a. The use of configured COTS products to develop the solution ensures that extended functionality can easily be accommodated through further development work. There are opportunities both to expand the usage of the solution and add functionality to it, as indicated below.
Interoperability and future use
The proof of function delivered on HS2 Phase 2a and adaptability of the digital solution means it is easily transferable by HS2 Ltd to other contractors for re-configuration and use on any environmental survey works supported within the solution, both for future HS2 Phase 2a environmental surveys, or other HS2 phases.
Additional functionality opportunities
While the minimum viable product for the digital solution has been achieved, additional areas of development could further enhance the improvements to the environmental survey management process. In particular, the digital solution has been developed only for a subset of the overall environmental survey suite that is typically carried out for projects under the UK regulatory framework and extended functionality could support a greater range of surveys.
As outlined in Figure 6, the remaining exception to the closed loop data model of the current solution is the export of scope data from the database for survey scheduling and land access. The integration of this remaining manual process into the database system represents an opportunity for further enhancement.
Additional areas of further development could include:
- Integration of health and safety processes;
- Enhanced automation of post-processing works; and
- Addition of pre-survey processing automation capabilities.
Conclusion
The development of a digital solution for HS2 Phase 2a environmental surveys aimed to improve survey data collection and management. The development works outlined in this paper have resulted in the creation of a minimum viable product using an efficient approach through use of COTS software and minimal bespoke development. Development focused on producing a modified schema that would function with the mobile data collection application, configuring the schema and application to improve usability and data quality in the field, and providing efficient post-processing automations, including processes to return the data to their required submission format. The digital solution has been implemented across a range of ecological field surveys and met its defined requirements, and there are many opportunities for additional development of the solution as well as for its wider deployment. In conclusion, the developed digital solution has successfully achieved its key aims of capturing survey results directly to a database, improving data integrity, using automation to increase efficiency, and providing a documented solution that is interoperable and can be replicated to provide a legacy of benefits that extend beyond the limits of the original project.
Acknowledgments
This development was delivered thanks to collaborative input from a wide range of stakeholders from both HS2 Ltd and delivery partners, and from across digital, ecological and project management disciplines.
References
- Glasson, J, Therivel, R and Chadwick, A. (2005). Introduction to Environmental Impact Assessment – Oxon: Routledge.
- Agile Business Cosnortium (2022). Chapter 10: MoSCoW prioritisation – The DSDM Handbook .
- Briggs, S and Hudson, M.D. (2013). Determination of significance in Ecological Impact Assessment: Past change, current practice and future improvements – Environmental Impact Assessment Review, vol. 38, pp. 16-25.
- Esri Inc. ArcMap authoring considerations – Esri Inc.
- Esri Inc. Optimizing map content for performance – Esri Inc.
- Ordnance Survey. OSM15 The new geoid for Britain – Ordnance Survey .
- Esri Inc. Prepare data for offline use – Esri Inc.
- Esri Inc. Geodatabase archiving – Esri Inc.
- Esri Inc. Introduction to attribute rules – Esri Inc.
- Esri Inc. Enabling attachments – Esri Inc.
Peer review
- Clive PaulseHS2 Ltd
- Jonathan RhindHS2 Ltd
- Rick HartwigThe Institution of Engineering and Technology ( IET)