Ground Heave in Deep Cuttings: Evolution From Generic to Specific Models to Enable Refinement of a Risk Management Strategy
The route of the UK’s High Speed Rail network traverses the hilly terrain of the south midlands of England on a low, flat, straight alignment. Creating this alignment requires the formation of deep excavations through hills and ridges formed from the local geology which includes argillaceous (clay) strata. The process of excavation removes significant weight from the strata below the base of the excavation, and it is expected that this ground will rebound. Observation of similar effects elsewhere, particularly in basement excavations in London Clay, indicate that this ‘rebound’ can take many months to occur and can be of magnitudes far greater than the movement tolerances set for the High Speed Two (HS2) track formation. This paper presents the evolution of a numerical modelling technique for the assessment of long term heave in the base of deep, open, infrastructure cuttings. The key drivers and impacts of the phenomenon are discussed and illustrated with case studies. The development and calibration of soil models for geological materials anticipated on the HS2 route are presented. The application of the modelling is related directly to the engineering challenges on HS2 Phase 1 with examples of both conventional and unconventional mitigation options.
- Written by
-
Simon PV Butler (HS2 Ltd/Atkins)

-
Andrew R Hope (EKFB/Arcadis)

-
Bénédicte Madinier (EKFB/SETEC)

-
Andreas Zilles

- Resource type
- Resource type: Technical Paper
- Tags
- Base Heave posts
- Charmouth Mudstone posts
- Cutting-Heave posts
- Excavation Heave posts
- FEM posts
- Finite-Element-Modelling posts
- Geohazard posts
- geotechnical posts
- Ground Hazards posts
- ground investigation posts
- Ground Risk posts
- High plasticity over-consolidated clay posts
INTRODUCTION
This paper focuses on the rural 80km section of route through the south midlands of England between Wendover and Southam, designated Sector C23. The route includes the construction of deep cuttings in over-consolidated high plasticity clays and mudstones. Stress relief in the underlying ground is expected to result in heaving of the cutting base which is time-dependent and potentially extends into the operation phase of High Speed Two (HS2).
Due to the high running speed and service frequency on the proposed route a ballastless ‘slab’ track system is being used. Such track systems can be sensitive to long-term ground movements. The high proposed running speed on HS2 in Sector C23 of 225 mph (360 kph) also imposes very strict tolerance on the operational track profile.
The combination of long-term ground movements due to stress relief in deep cuttings and strict track tolerances presents a potential threat to operations of the railway, in particular the risk of requiring significant maintenance interventions during the early years of service. This risk was highlighted during the desk study stage of the project while the final route alignment was being developed, and the HS2 Technical Specification for Earthworks [1] places limits on the amount of heave that can occur during the operational phase of the railway.
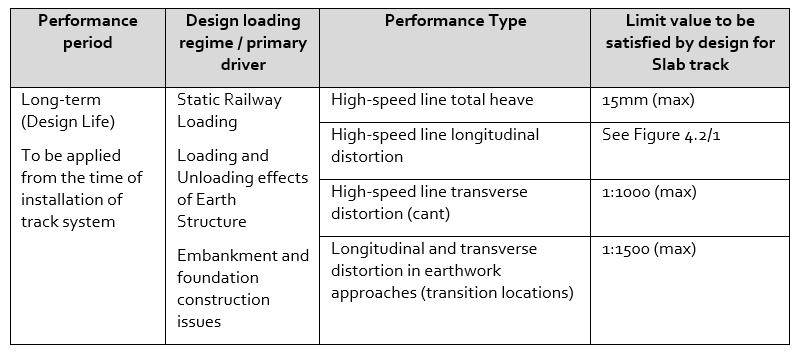
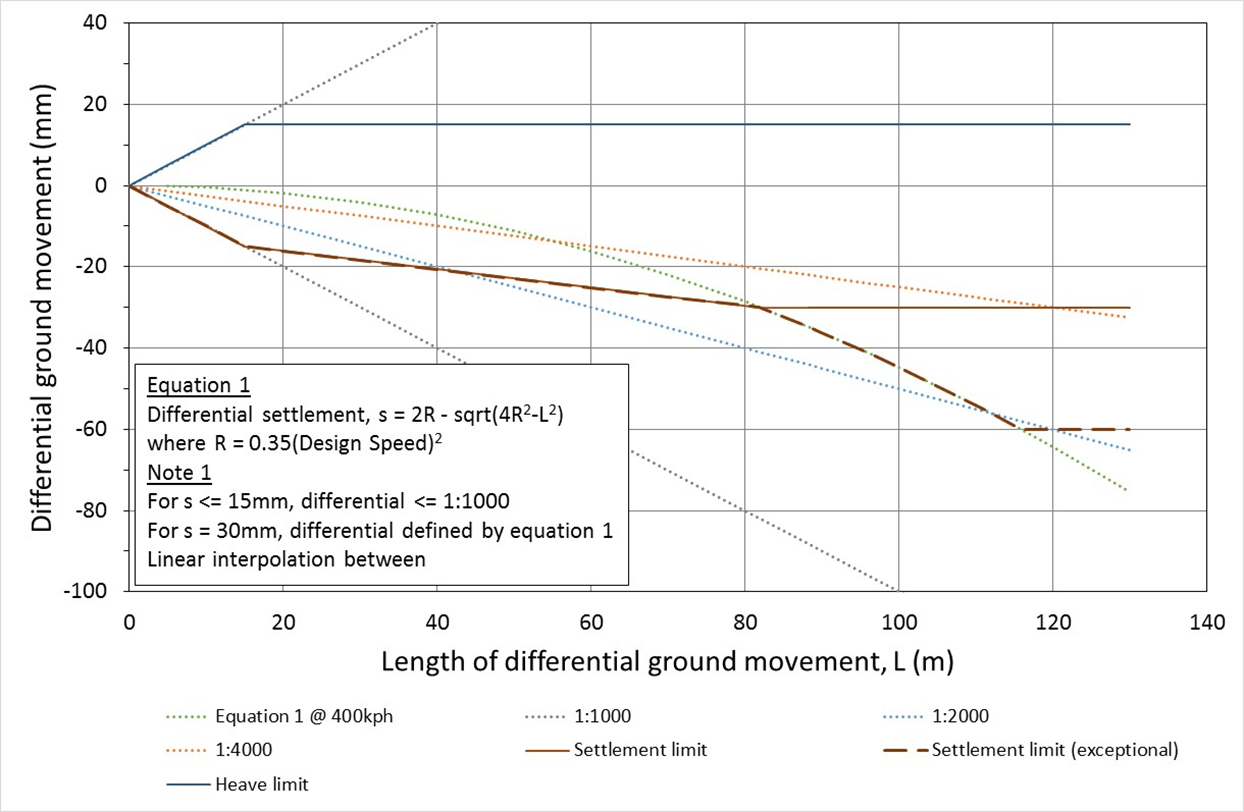
The performance requirements and limit values relating to heave ground movements have been through a series of development stages, an example of the limits imposed during the development of the scheme design, and therefore relevant to the analyses referred to in this paper, is presented below. It is noted that such limits may be amended as the HS2 project progresses into future stages and phases:
There is no generally accepted analytical approach or design code for estimating this effect or defining design within these circumstances. This paper presents the development of an analytical approach to the estimation of cutting heave using numerical modelling techniques. It provides an insight into the ground investigation techniques used to further enhance understanding of the local ground conditions and discusses the refinement of the modelling approach using this ground investigation data. Finally, the paper presents an approach to the use of the analytical output for developing engineering mitigation measures to reduce the impact of this phenomenon on the operations of the high-speed railway.
The development of HS2 Sector C23 has been through a series of phases, the initial outline design was developed for HS2 Limited (‘HS2’) by Atkins Limited (Atkins) between 2013 and 2017, in 2017 the scheme design and detailed design was let to a design and build joint venture CEK JV (now EKFB JV) who in turn engaged a design joint venture comprising; Arcadis UK (Arcadis), Setec and Cowi. From 2017, Atkins were retained by HS2 as part of their Engineering Delivery Partner (EDP) to provide technical assurance and other engineering support. This paper is a collaborative effort between the geotechnical teams of HS2, Atkins, Arcadis and Setec to outline the process of developing, refining, and using finite element modelling to enable the assessment of heave risk throughout the development of the ERD and Scheme Design Stages of HS2 Phase One. These stages are now complete and as the project moves into detailed design and construction the work described in this paper is being developed and refined with more detailed analyse, large scale tests and monitoring to provide even greater clarity on the issues raised.
GENERAL PRINCIPLES
Upward ground movement or ‘heave’ is a phenomenon that has been observed in the base of deep excavations formed in high plasticity over-consolidated clay soils, and several case studies are presented below. Similar soils are expected to occur within Section C23 of HS2 in the location of proposed deep cuttings[2].
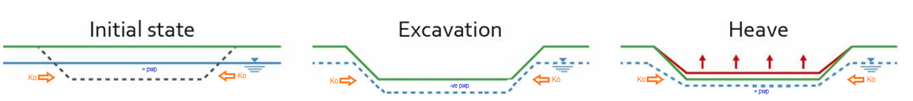
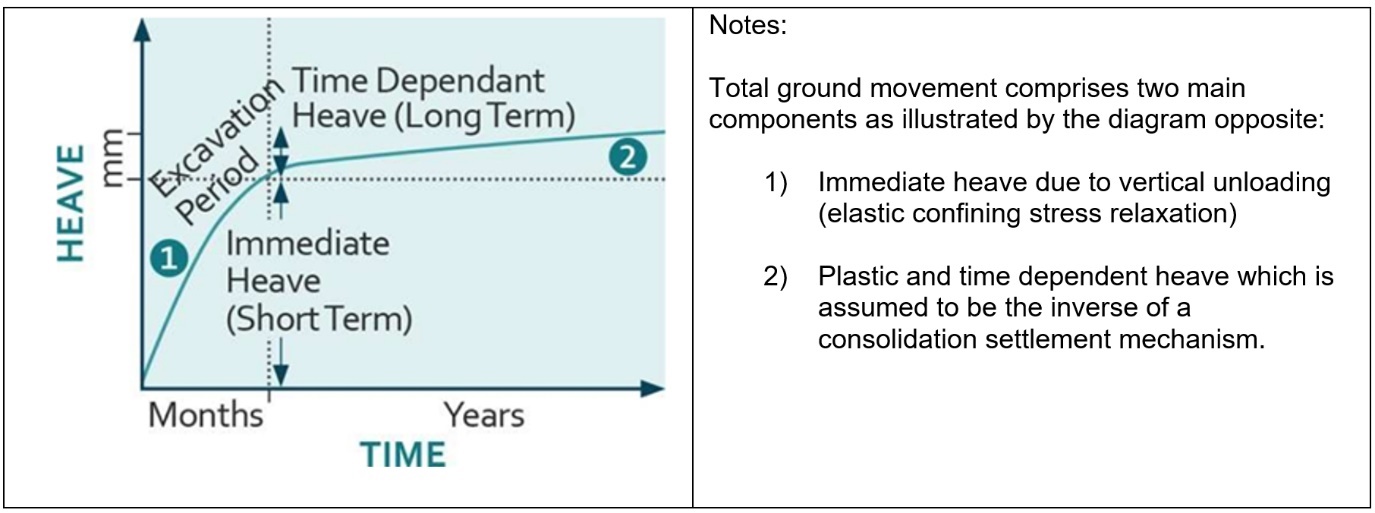
The upward movement is the result of a reaction to the changing stress state in the ground during and after excavation as illustrated in Figure 2. The phenomenon is experienced in all soil and rock materials but is particularly pronounced in clay soils for several reasons, which are discussed below. Excavation of a deep cutting involves the removal of many tonnes of soil and rock from the cutting location. As this weight is removed the ground below the final cutting level experiences a reduction in pressure (vertical stress) which allows the ground to relax or rebound; this expansive movement (strain) in an upward direction manifests itself as heave.
As this expansion occurs various factors within the ground affect the amount and progress of the heave. As well as the reduction in load from the overburden removal the other three primary factors affecting the heaving process are; soil stiffness, stress history and soil permeability.
Soil stiffness
The total heave is a result of stress change in the ground and the stiffness of the soil. In response to a change in loading, deforming soil exhibits a large range of stiffness depending on the experienced strain. At small strain, the behaviour is almost linear elastic and the stiffness is high. With increasing strain, the soil deformation becomes plastic, i.e., non-recoverable upon load reversal, and the stiffness reduces. Therefore, quantifying the soil stiffness through the range of strain the soil is undergoing due to the cutting construction is critical for the prediction of heave. For deep-reaching, heave-prone deposits, the small-strain stiffness governs the heave at depth; this can be significant due to the additive effect of heave over the thickness of the deposit. The majority of heave, however, is expected to occur in the soil close to the excavation and is governed by the large strain, plastic behaviour driven by local yielding due to shear strength exceedance.
Stress history and high, locked-in horizontal stress
The insitu lateral stress becomes particularly significant in strata that have been subjected to large vertical pressure in their history as a result of lithification or burial below thick glacial ice. Some of these pressure effects become ‘locked in’ to the fabric of the strata, creating an ‘over-consolidation’. In stress terms, the ratio of insitu horizontal effective stress (σ’h) and vertical effective stress (σ’v) is expressed as the Coefficient of Earth pressure at Rest (Ko). For a heavily over-consolidated soil, Ko is greater than 1 indicating that σ’h > σ’v; Ko tends to be greater at shallow depth reducing with depth. Upon unloading due to cutting excavation, σ’v is reduced (increasing Ko further); this is only sustainable up to a certain point beyond which shear failure of the soil occurs and the horizontal stress is released by upward shearing which increases heave. The shear resistance of high plasticity, over-consolidated clays is relatively low which makes these more susceptible to shear failure and heaving compared to low plasticity clays or coarser grained soils in general.
Soil permeability
The soil’s permeability has two main effects; it influences the speed at which negative porewater pressure (PWP) generated from unloading dissipates and thereby the time it takes for heave to fully develop. It also effects the total amount of heave as it controls groundwater flow towards the excavation and thereby the change flow has on the effective stress.
Time dependency effects of pore water pressure changes
For fully saturated soil, the expansion of its water filled pore space in response to stress relief is initially counteracted through generation of negative PWP (i.e., suction); this is also referred to as ‘undrained soil behaviour’ during which the soil volume remains constant. To relieve the imbalance of PWP, groundwater is drawn towards the zone affected by the unloading. The time for the PWP to return to equilibrium and the soil expansion to complete depends on the permeability of the ground as well as the PWP gradient. At constant permeability, the rate of heave is, therefore, initially high but slows with time as the gradient reduces, and this creates a modelling linkage between rate of heave and the permeability of the heaving strata.
For over-consolidated clays, the horizontal permeability tends to be significantly greater than the vertical permeability due to the horizontal lamination of the soil that remained following deposition and subsequent historical unloading. As a result, groundwater is preferentially drawn horizontally from the surrounding soil rather than vertically from the cutting excavation surface; this lengthens the flow path and, thereby, reduces the rate of heave.
Effective stress change due to groundwater flow
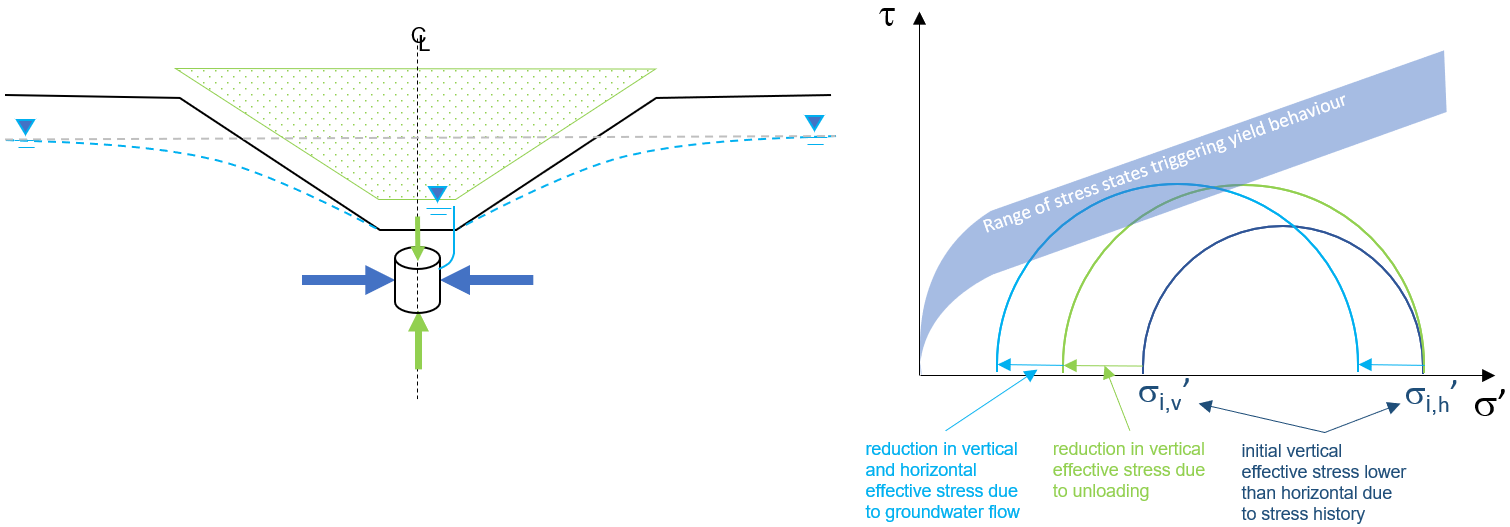
Where the natural groundwater level is above the base level of the cutting, the cutting will, in the long-term, act as a drain for the surrounding ground creating a groundwater flow towards the base. Ultimately this flow increases the PWP below the cutting base to higher than hydrostatic pressure which reduces the effective stress and, thereby, exacerbates the upward shear failure as described above. This is also illustrated in Figure 3 which shows the development of the stress state due to stress history, unloading and groundwater flow relative to the soil strength dependent yield zone.
Although all these effects are contemporaneous their interdependencies result in a non-linear response. This non-linear effect is schematically illustrated in Figure 4 and is essentially considered a two-stage process with a prolonged transition from one phase to the other.
On this basis it could be expected that a deep excavation in high plasticity, over-consolidated clay soils, which will have high insitu lateral stress, low stiffness, low strength and low, anisotropic, permeability, would be particularly prone to large magnitudes of base heave which could take a considerable time to come to completion.
There are other factors that could have a significant impact on total heave and its development with time. These are:
- the mineralogical swelling of high plasticity, over-consolidated clays which could influence the expansive behaviour at very low vertical confinement stress, and
- the increase of soil permeability due to soil expansion, opening of fissures and creation of new flow paths, which should increase the rate of heave.
These factors have not been taken account of in the development of this paper; but warrant further consideration in such excavations. The former is likely to be a slow process related to chemical weathering. The latter, if it occurs, would probably result in the rate of heave being greater than estimated by the models described below.
HISTORICAL EVIDENCE OF EXCAVATION HEAVE
Twenty case studies of ground movements occurring in deep excavations have been found in available published and unpublished data. These case studies were evaluated for their relevance to heave prone HS2 cuttings [3], and their potential for re-analysis to enable calibrating of numerical models. The table below summarises the case studies reviewed:
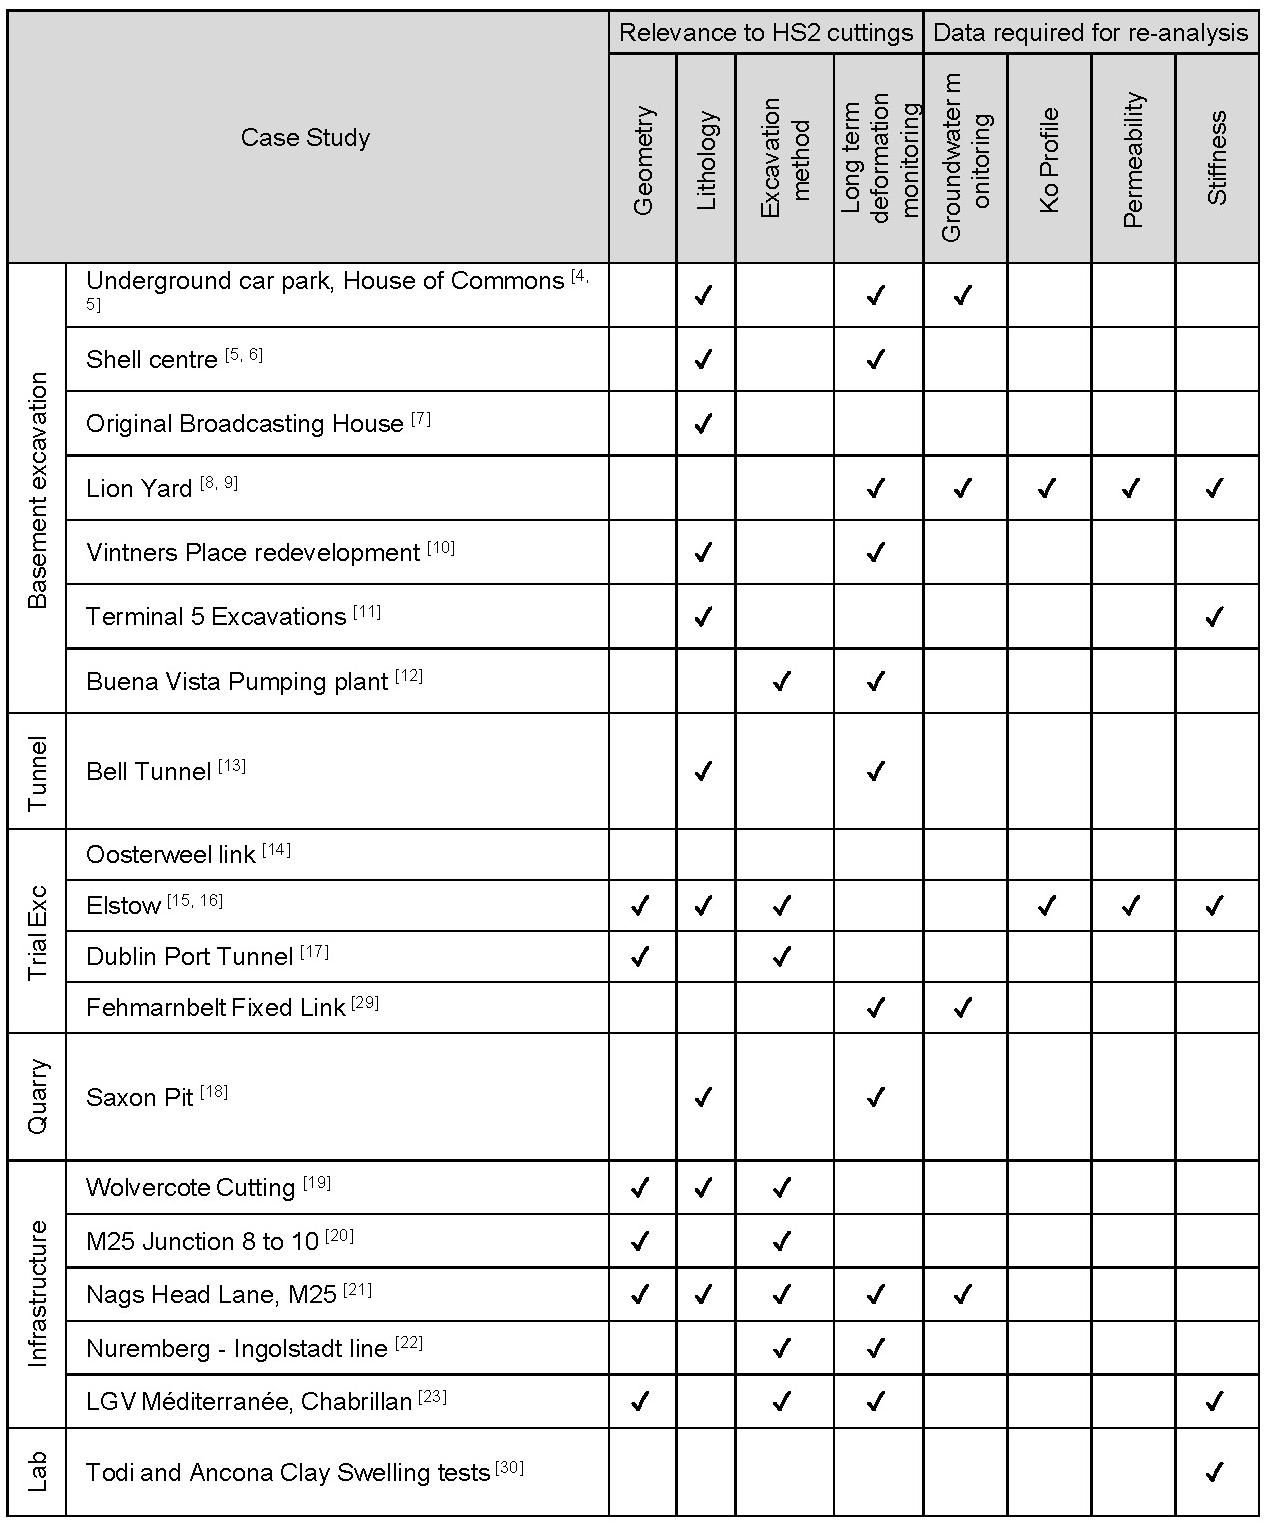
The review indicates that most of the case studies identified heave occurring within deep excavations but that none of the case studies presented the full range of geotechnical, construction and observational data required to develop a fully validated analytical model. However, it was considered that the following three studies provided some greater insight into the heave process.
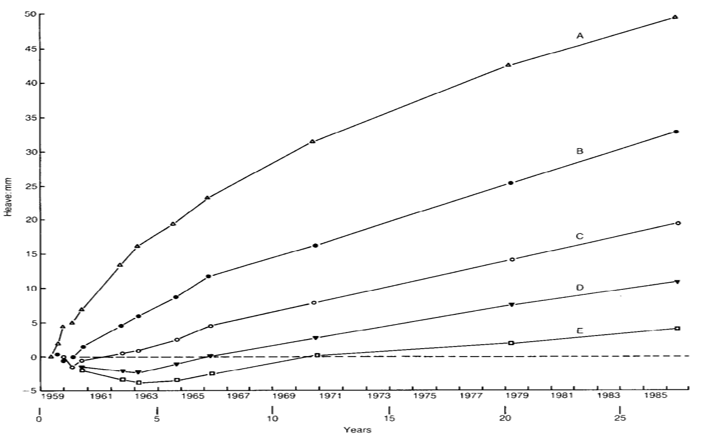
Shell Centre, London
Burland et al. (1979) [5] and Burford (1988) [6] discuss the monitored long-term heave associated with a 12m deep basement on London Clay which heaved up to 50mm over a 27-year period.
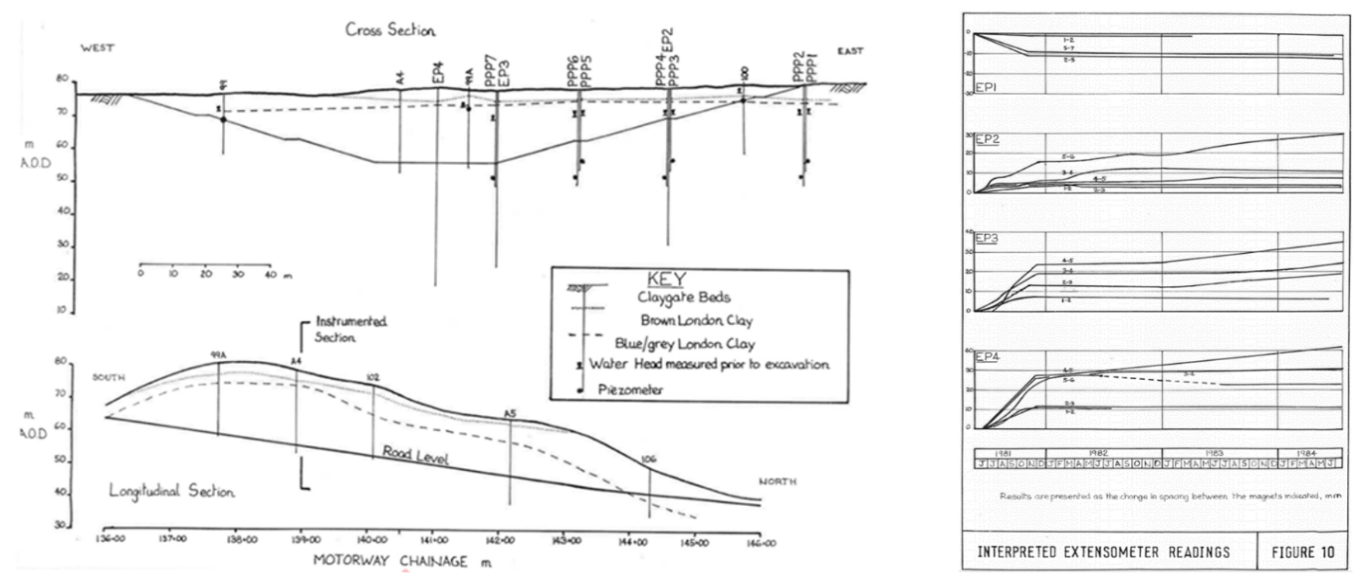
Nags Head Lane, M25
Mettyear (1984) [21] details monitoring undertaken on the Nags Head Lane cutting, excavated in 1981 as part of the M25 Motorway construction. Monitoring of this 20m deep cutting in London Clay identified up to 100mm of immediate heave, and a subsequent average long-term rate of 15mm per year during the following three years. This is a good example of the large magnitude and rate of heave that can occur in deep infrastructure cuttings. However, there is limited information on key parameters and it is, therefore, not suited for the basis of a full validation of any model.
Elstow Trial Excavation
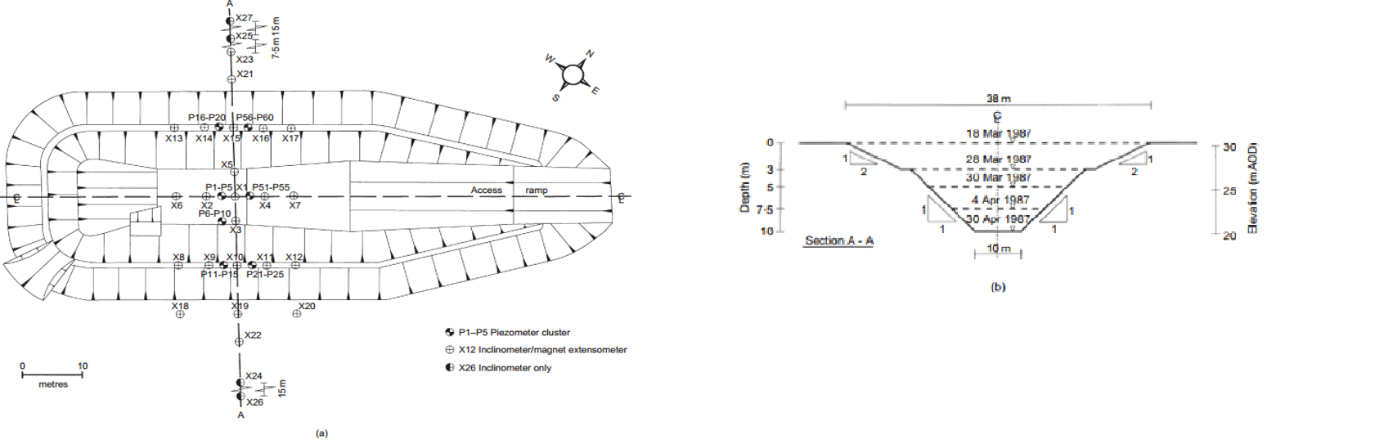
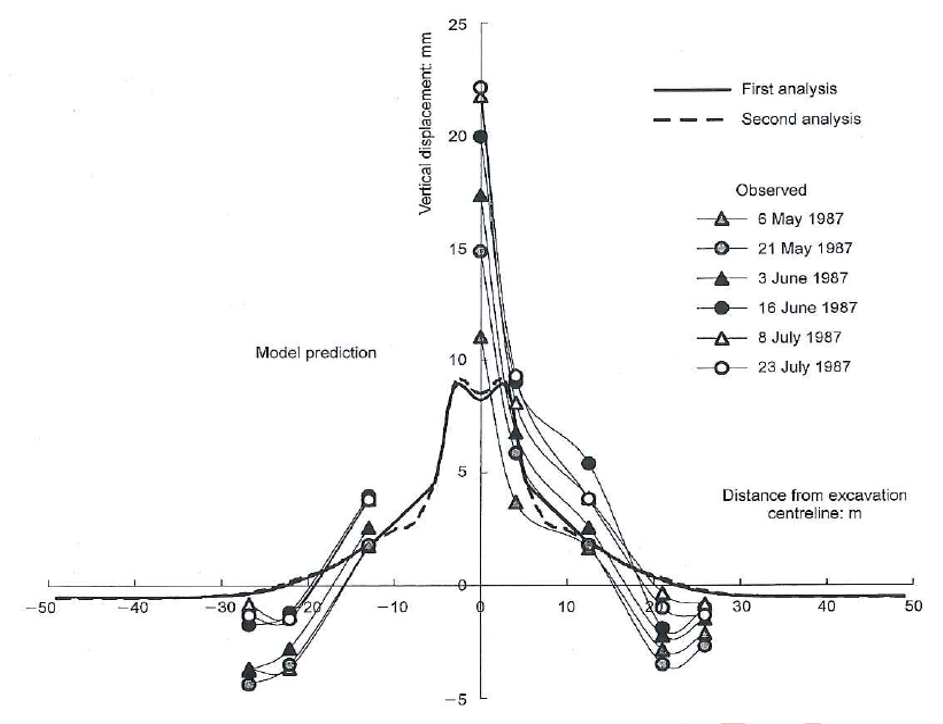
Pierpoint (1996) [15] discusses a trial excavation carried out in Oxford Clay, at Elstow, near Bedford. The trial excavation was 10m deep but was cancelled only two months after excavation. During this time the maximum heave monitored was 22mm. The Elstow Trial is an example of a carefully controlled, well-instrumented piece of research incorporating extensive monitoring and advanced laboratory testing. This case study is of direct relevance to HS2, because of its similar geology but, due to early termination of monitoring (after five months) the study is not considered suited for the basis of a full validation of the numerical models.
IDENTIFICATION OF POTENTIAL STRATA SUSCEPTABILE TO HEAVE
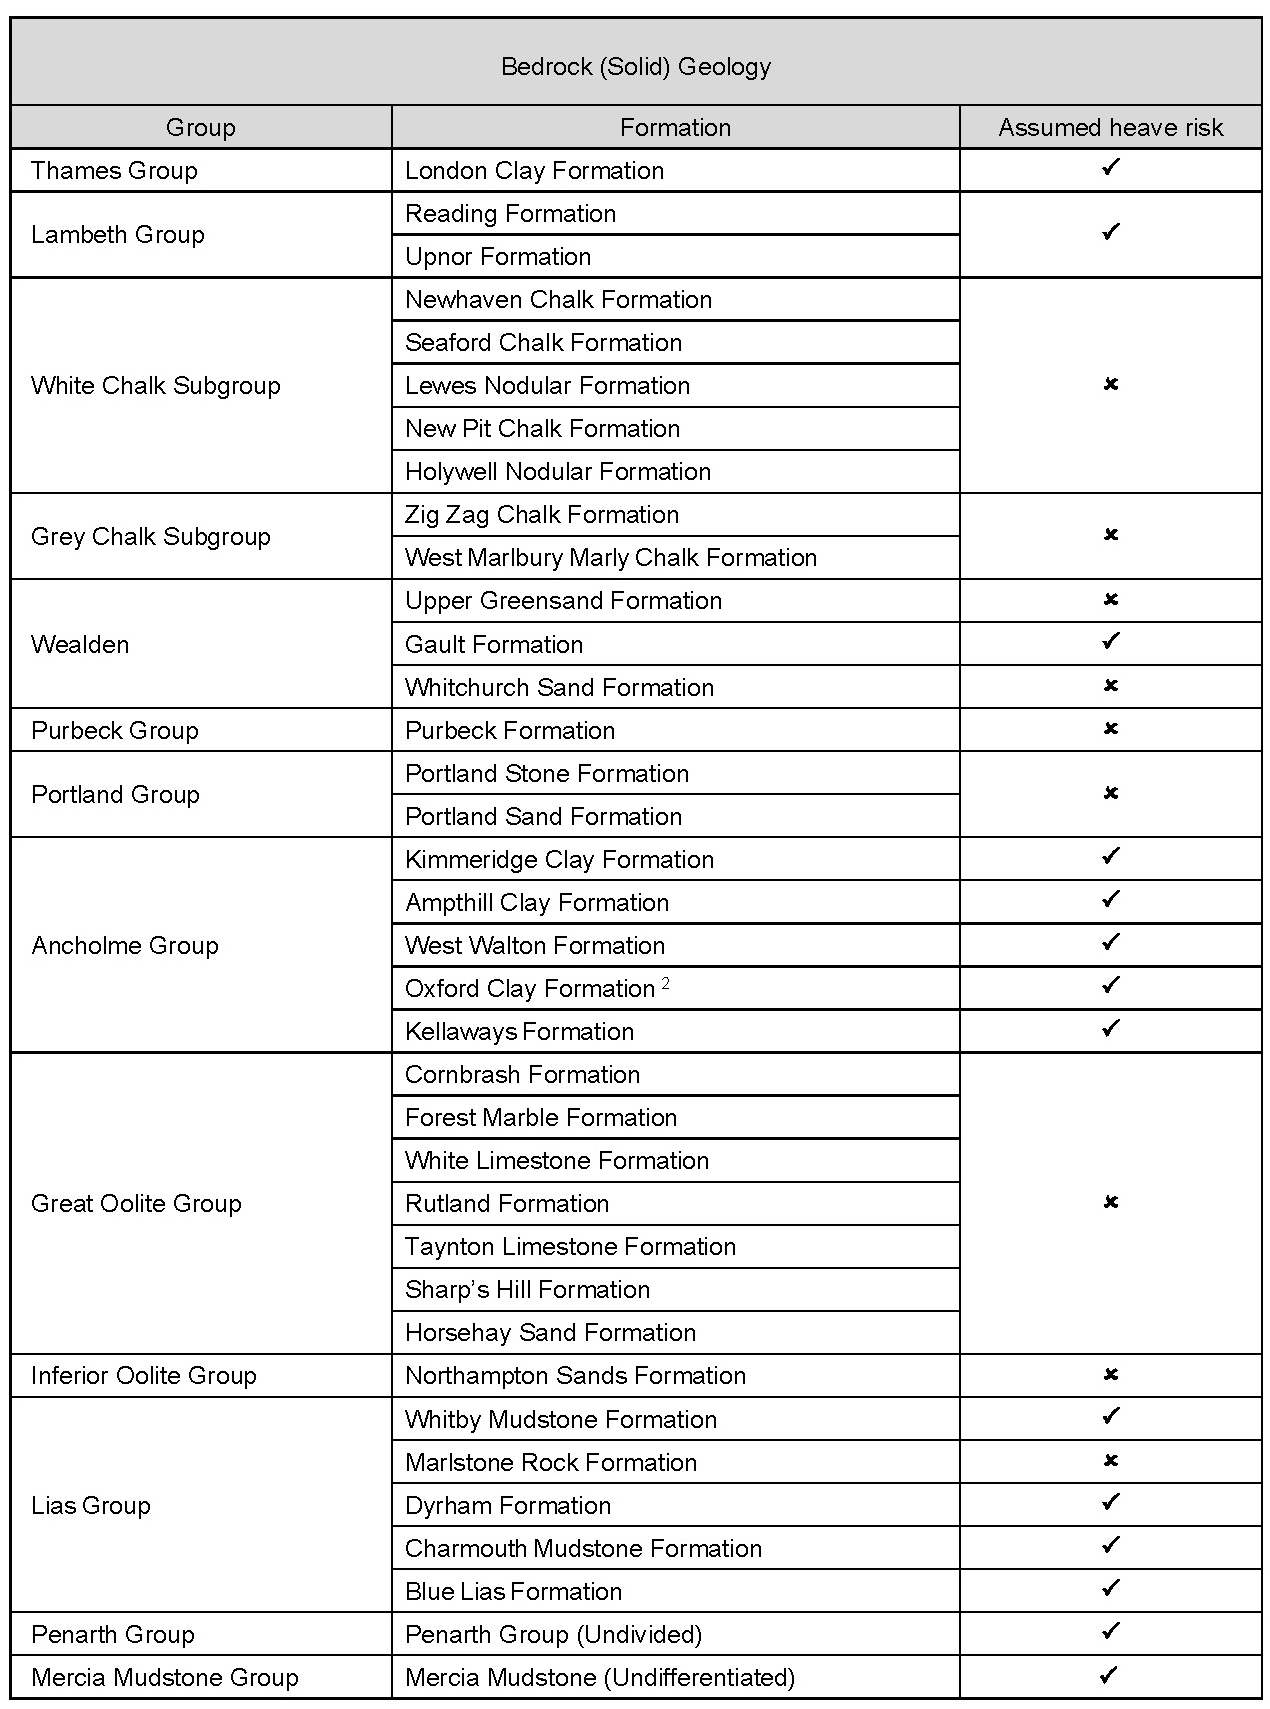
The HS2 Phase One route cuts across the geology of the United Kingdom from the youngest Eocene deposits of the London Basin in the south to the Triassic rocks in the north.
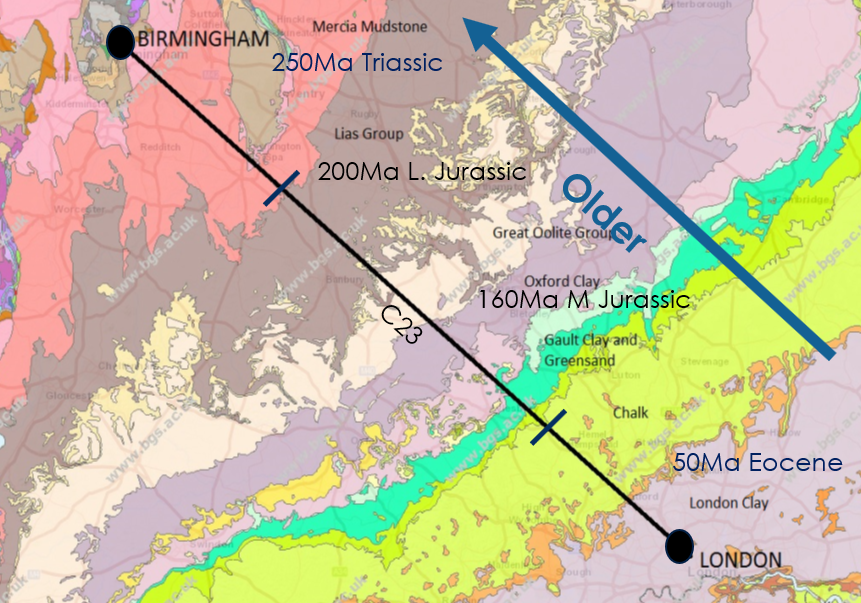
The first stage of the assessment considered the geological units along the alignment likely to be prone to significant stress relief induced heave. The focus of this study was high plasticity over-consolidated clay strata that are likely to be present to substantial depth. Much of the northern part of the route has a veneer of glacial deposits, including clay rich Glacial Till that will have been subject to glacial over-consolidation in the recent past. However, in the English Midlands these deposits tend to be laterally variable and less than 10m thick and as such are unlikely to be present to significant depth below deep cuttings [31]. This paper therefore concentrated on the bedrock (Solid) geology.
DEVELOPMENT OF INITIAL ‘GENERIC MODELS’
Due to lack of available guidance regarding cutting heave and how to predict it, the initial approach was to estimate the total amount of heave and its development with time using a traditional approach for the assessment of settlement assuming that soil behaviour due to stress reduction is the same as for stress increase. For the total heave assessment, the vertical stress change with depth due to unloading was predicted using Boussinesq based methods[32]. The heave was then calculated using Coefficients of Volume Compressibility (mv) from unload/reload loops of published Oedometer test data for typical high plasticity, over-consolidated clays (in the absence of data from Oedometer based swelling tests). The prediction of heave with time was based on Terzaghi’s Theory of one-dimensional Consolidation using Coefficients of Consolidation (cv) from the literature [32].
As well as recognising that the employed methods were not originally developed for the evaluation of heave with time, there were additional limitations such as; the effect of the distribution of stress reduction in the ground due to the shape of the cutting, and pre-determination of the length of drainage path for a soil with anisotropic permeability. This led to the decision to employ advanced numerical analysis capable of capturing the main factors expected to govern heave and its development with time in a holistic model. All these factors are complicated and mostly not well understood on a microscopic level; however, a reasonable understanding exists on a macroscopic scale and has been translated into behavioural numerical models. In addition, numerical models allow accurate consideration of geometry and how geometry changes with time during construction. It was considered that this justified the use of advanced numerical models. Due to the lack of cutting specific ground investigation information at the early stage of the project, a generic model was developed to explore the issue and provide initial insights.
The numerical analysis was based on the Finite Element Method (FEM) using commercially available software for two-dimensional (2D), plain strain models. The model was capable of reproducing undrained soil behaviour predicting initial ground movements at constant volume and generating the negative PWP associated with the volume expansion. It also allowed for prediction of the dissipation of the PWP to an equilibrium state with time and the associated volume change which compounded into the predicted heave. The following presents two examples of how the generic model was developed for two of the key factors influencing the predicted heave.
Historical stress state
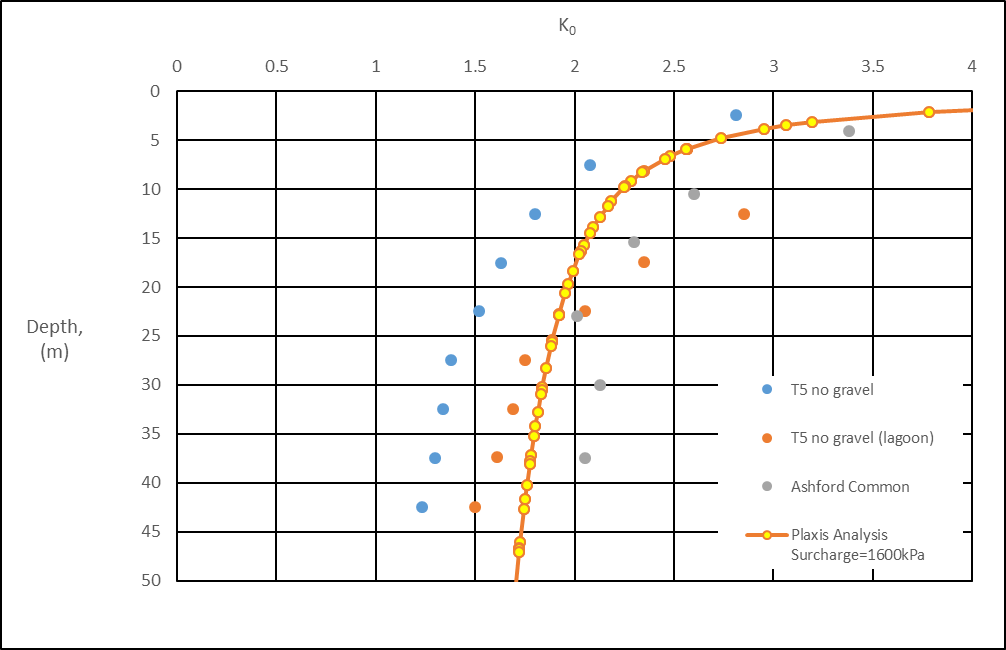
To establish the initial stress state and Ko-profile with depth prior to cutting excavation, a calibration with historial data from a typical high plasticity, over-consolidated clay was undertaken by loading and unloading the numerical model with the estimated historical overburden stress reported in the literature for the particular deposit. A comparison of data for London Clay (Hight et al. [34] and Bishop et al. [35]) with the predicted Ko-profile with depth is shown in Figure 10. This gave a reasonable fit to the available data and the resulting methodology was then used with the estimated historical overburden pressure for the lithologies and locations of cuttings within the study area to generate the Ko-profile. However, there is limited information within the literature for the local lithologies to enable this method to be reliably applied in modelling. Modelling a reasonable range of potential Ko-profiles indicates a degree of sensitivity of the calculated heave to variations of Ko. For initial generic models, a reasonably conservative profile was adopted based on the methodology described above and recommendations were made from further investigations, at the site, as described in the sections below.
Groundwater flow
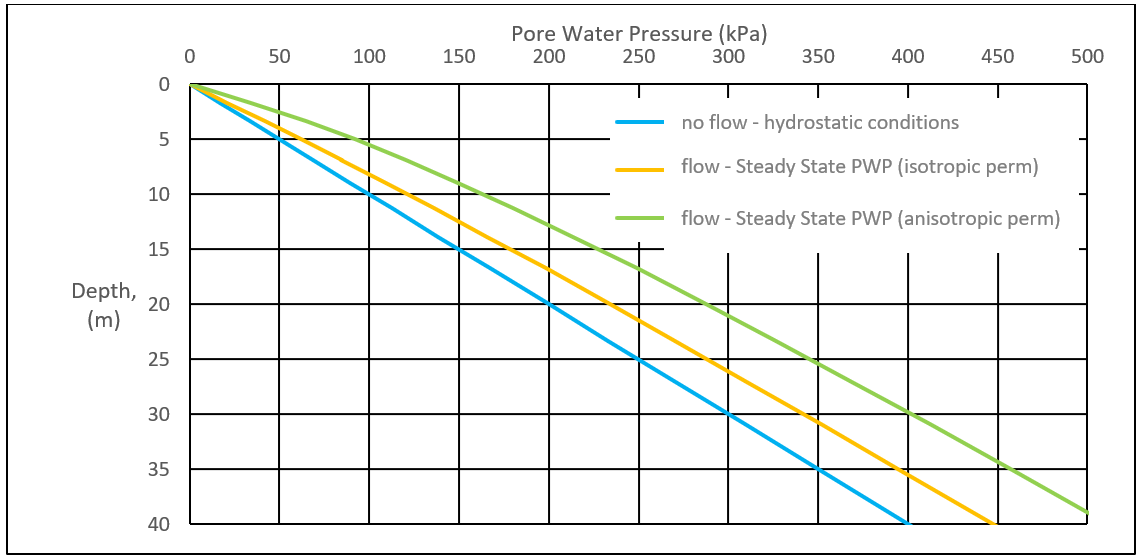
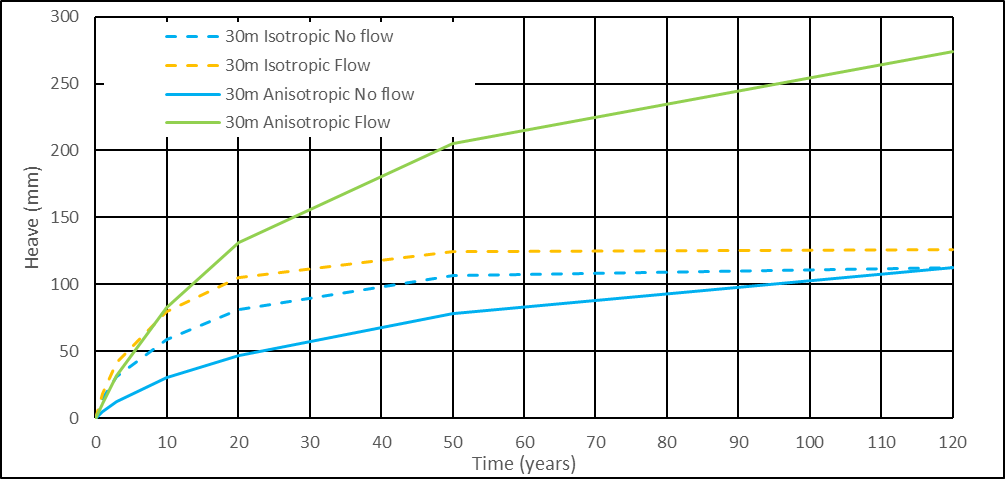
To assess the effect of groundwater flow due to groundwater draining towards the cutting base, a comparative study for a generic, 30m deep cutting was undertaken comparing the predicted heave for ‘flow’ (groundwater table close to ground surface) and ‘no flow’ (groundwater table below cutting base) and therein for an anisotropic (kh > kv) and an isotropic permeability (kh = kv) of the soil. The results demonstrated the impact of the groundwater flow assumption as well as the effect of the ratio of horizontal and vertical permeability on the final PWP profile below the centre of the cutting base (Figure 11) and the resulting amount of heave predicted (Figure 12). This highlighted the need to carefully investigate the groundwater regime and soil permeabilities at the specific site locations.
Through exploring the impact of modelling assumptions on the heave prediction, key assumptions and the analysis methodology were agreed. The generic models were then used to undertake sensitivity analysis identifying the key input parameters and the potential range and timescale of heave. As well as feeding into the wider ground risk assessment and mitigation process, the numerical model informed the ground investigation strategy. For example, exploration depth and parameters to be investigated were determined with future numerical modelling requirements in mind.
Due to the flexibility of the numerical analysis approach, the generic numerical model also proved advantageous for the evaluation of potential construction options to reduce, accelerate or mitigate heave (as further discussed in the Application section at the end of this paper).
GROUND INVESTIGATION STRATEGY
The development of the initial generic models indicated several key parameters, to which the outputs of the heave modelling were particularly sensitive. These parameters and the associated testing used to define them were used to develop a Ground Investigation Strategy[33] and are summarised below.
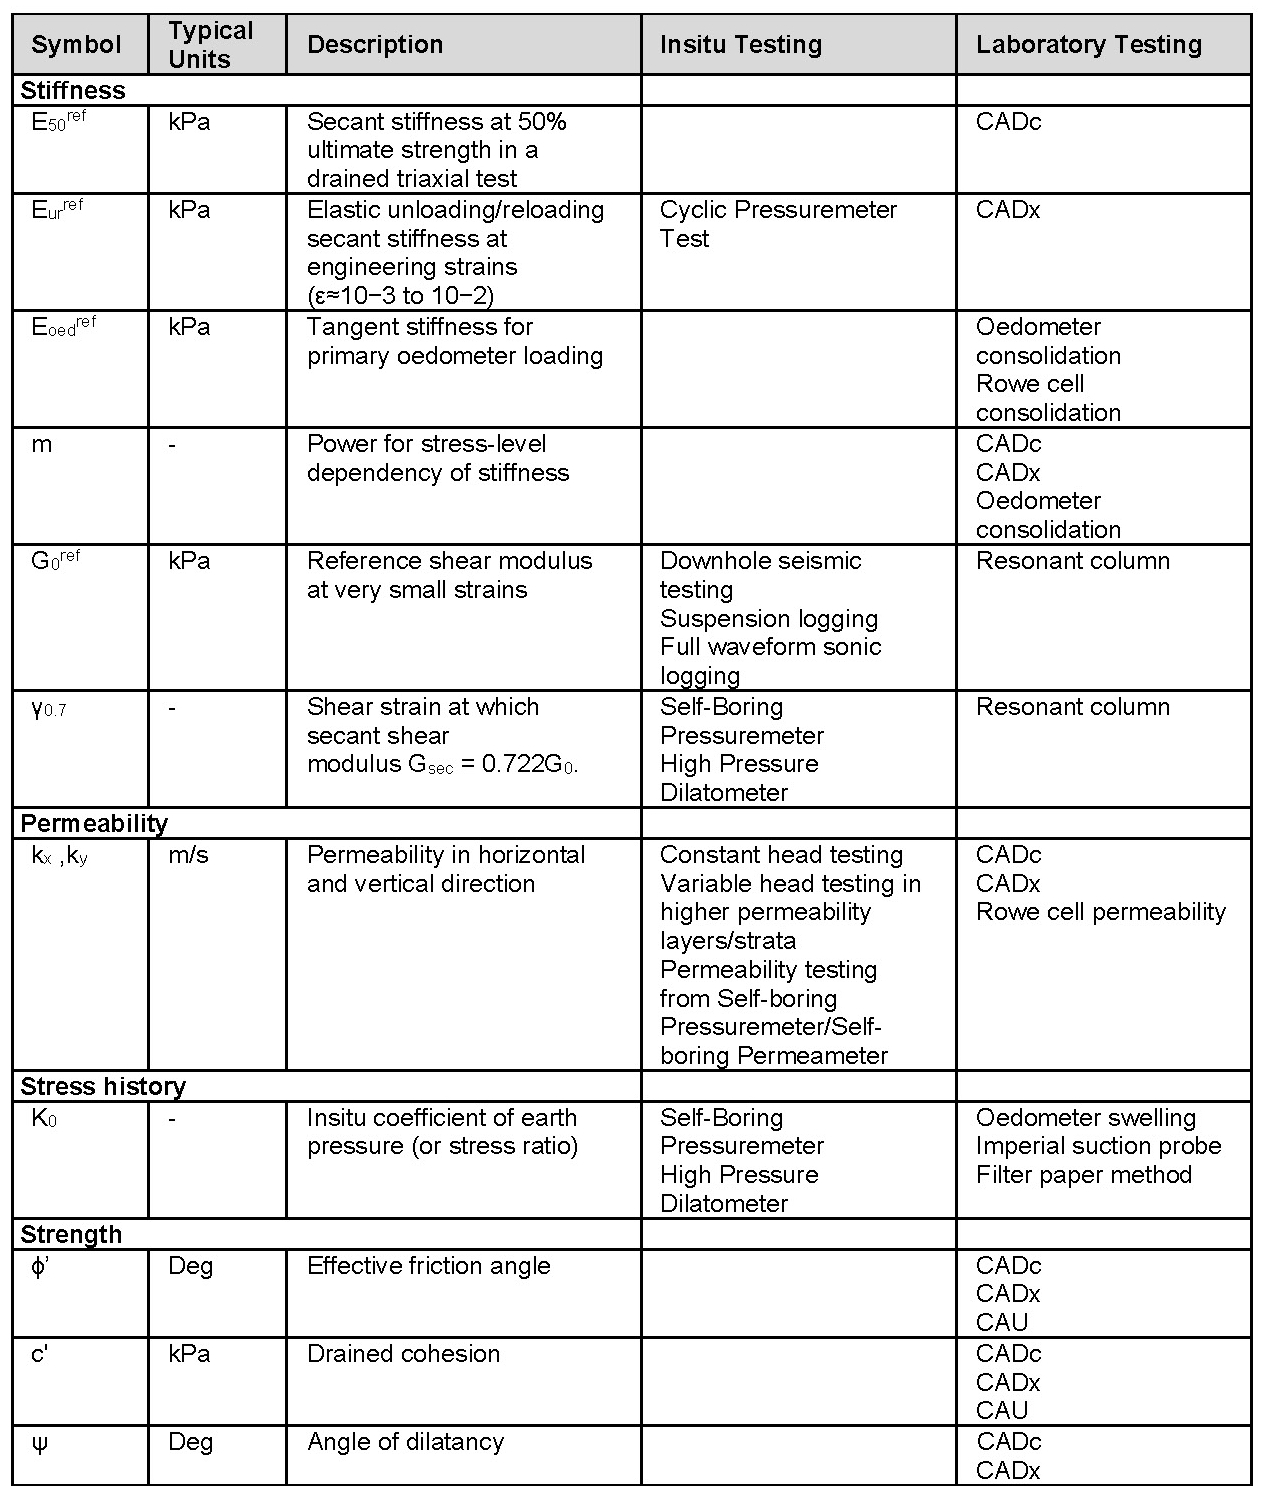
Notes:
Anisotropically consolidated drained triaxial compression (CADc)
Anisotropically consolidated drained triaxial extension (CADx)
Anisotropically consolidated undrained triaxial extension (CAU)
In order to define the location specific risk of deep cutting heave and allow the development of a mitigation strategy ground investigations were undertaken at the locations of the various cuttings of concern along the route. The investigations for cutting heave were combined into a wider engineering ground investigation of the route. These investigations were intended to provide a range of data for a range of geotechnical and other design purposes. Where possible the specialist investigations for heave modelling was integrated and optimised with these other investigations. As well as the specialist testing indicated above the determination of the stratigraphic sequence and the results of ‘Standard’ geotechnical tests, such as Atterberg limit, particle size distribution or other geotechnical classification tests, were of significant importance to the modelling of heave and the site wide application of the heave modelling results [33].
The HS2 project has undertaken several stages of ground investigation, including studies of potentially heaving cuttings. This has informed the development of location-specific models, but has also highlighted the need for further investigation.
DEVELOPMENT OF SITE-SPECIFIC MODELS
The heave assessment in high risk cuttings were undertaken using 2D Finite Element (FE) analysis generally in line with the approach taken for the generic models but with parameters derived from the GI data as described below. In addition, the following refinements to the generic modelling methodology were adopted:
- Discretisation of the FE model with depth with the “m-parameter” used to control the stress-level dependency of stiffness set to 0 in each soil layer, the increase of stiffness being directly implemented by using specific stiffness parameters in each discrete soil.
- Updated Construction Sequencing and Hold Periods to reflect the developed construction programme.
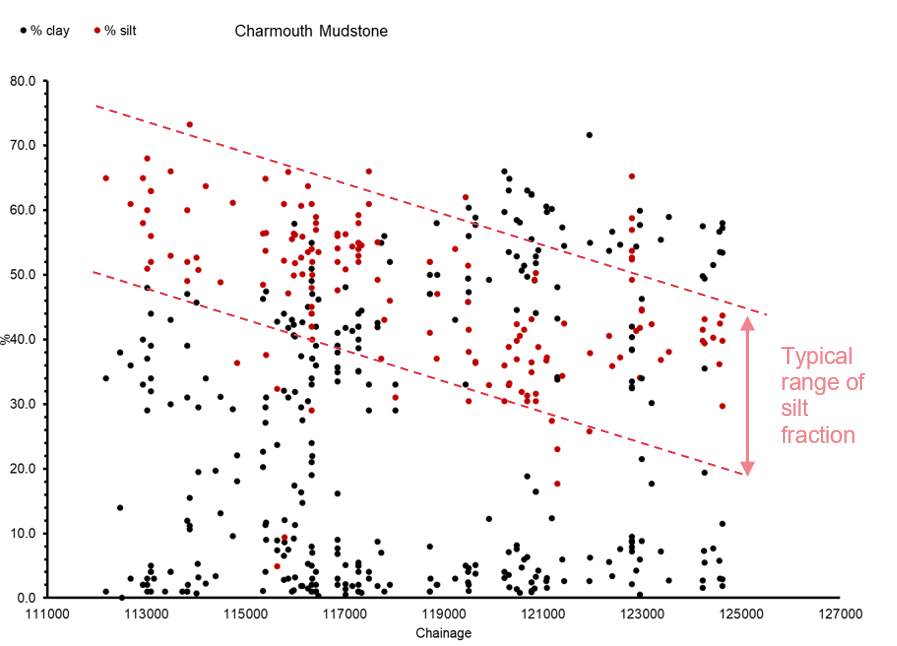
The site-specific ground models identified several complicating factors such as previously unidentified fault zones with significant vertical throws and more complex groundwater regimes. The advanced insitu and laboratory testing that was available was evaluated by formation to provide a more informed assessment of the likely parameter ranges. However, on long linear projects, such as HS2, regional variations in ground parameters may occur in the same formation and the validity of parameters derived from advanced testing in one location need to be assessed for their validity in another location even within the same geological formation and adjusted accordingly. To support this assessment, a geospatial database was developed using the results of grading, Atterberg limits, void ratio, and density testing within a formation which helped to identify geographical/depth variations and identify factors that could be considered when selecting a parameter set for use in the models for a particular site. An example of this is the variation in the silt/clay fraction within the Charmouth Mudstone which shifts towards a lower silt fraction in the direction of rising chainage, i.e. towards the older portion of the formation, Figure 13.
This paper uses a cutting within these deposits as an example of the development of the location specific models. The cutting characteristics are described in Table 5 below.
| ID/Name | Length (m) | Max Depth (m) | Side Slopes | Geology |
|---|---|---|---|---|
|
115-L1 Bdt |
350 |
14.1 |
1:4 |
Cutting excavated in Charmouth Mudstone Formation (CHAM) and extends to at least 30m below the base of the cutting. |
The following table provides a summary of the stiffness parameter values used in 2D FE analysis for the example cutting. Similar parameters were derived for each identified heave prone stratum along the C23 route.
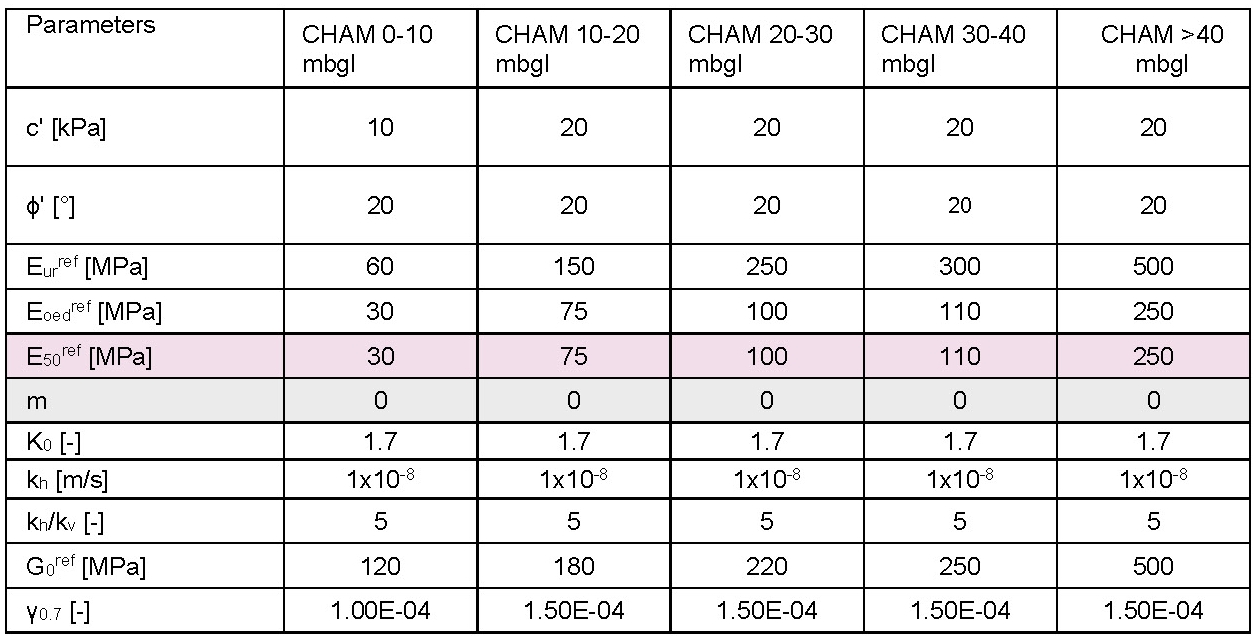
Notes: In the above table, the presence of limestone beds within the formation is not taken into consideration when assessing the stiffnesses values for the whole formation.
It should be noted that some of the parameters derived from the GI data for use in the modelling are specific to the problem being modelled, i.e. heave. In this respect the cohesion value c’ used at shallow depth is considered representative of the behaviour of the soils below the base of the heaving cutting, but may not be appropriate for other analyses, such as slope stability. The choice of such a value avoids the modelling and numerical issues associated with shallow slope stability effects. The modelling of heave is found not to be sensitive to this value provided a suitable ‘tension cut-off value’ is included within the modelling.
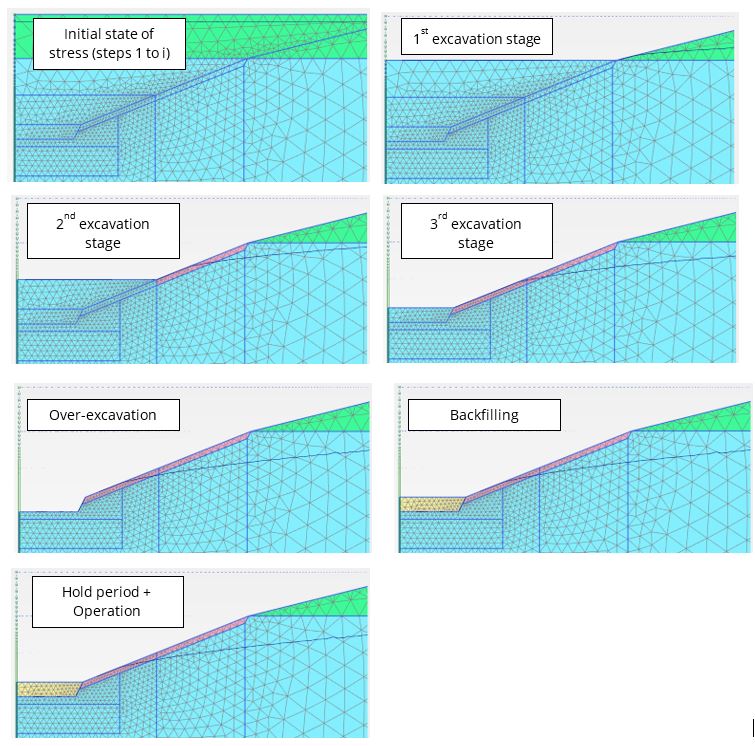
In addition to the characterisation of the ground conditions, the duration and sequence of construction represents a significant factor influencing the magnitude of heave that could be expected to occur during the operational phase of the project. Site specific construction sequences were developed that aimed to maximise the duration of a hold period in the construction that could be used to evidence compliance with the technical standards. A series of models were used to replicate the proposed construction sequence and durations for different cutting depths and foundation treatment options. A typical FE model and construction sequence is illustrated in Figure 14 below with the addition of an excavate and replace which is one of the possible solutions to aid in mitigating the risk.
An example of the predicted movements is provided in the figure below which illustrates one of the sensitivity studies to assess the impact of variation in the assumed permeability and an accelerated excavation period.
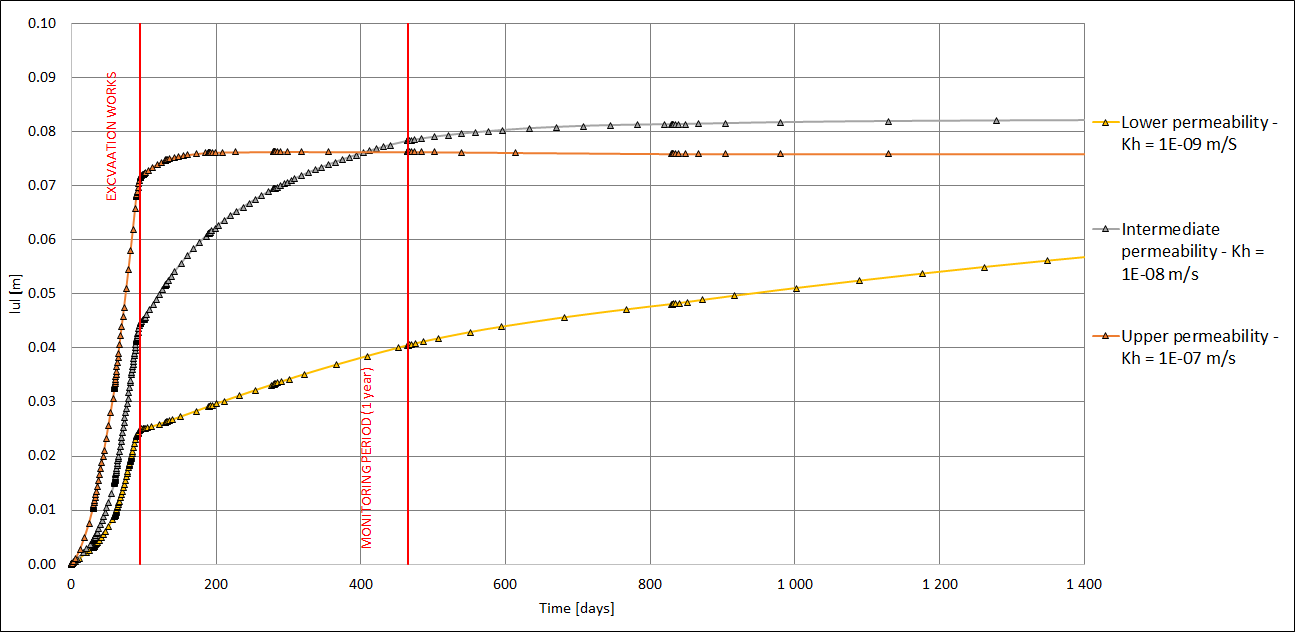
The ground investigations provided an improved understanding of the majority of the parameters required to develop the site-specific FE modelling, leading to a refinement of the estimated heave. However, estimation of permeability remains subject to a large degree of uncertainty when dealing with low permeability materials where discrete low or high permeability layers can have a significant contributing factor to a modelled outcome and subsequent engineering assessment. In these cases, the uncertainty in ground conditions should be managed through full scale field trials and/or careful observation during construction. The results also illustrate the influence of permeability on the estimated total movement due to the effect of different pore pressure distributions during the excavation and hold periods.
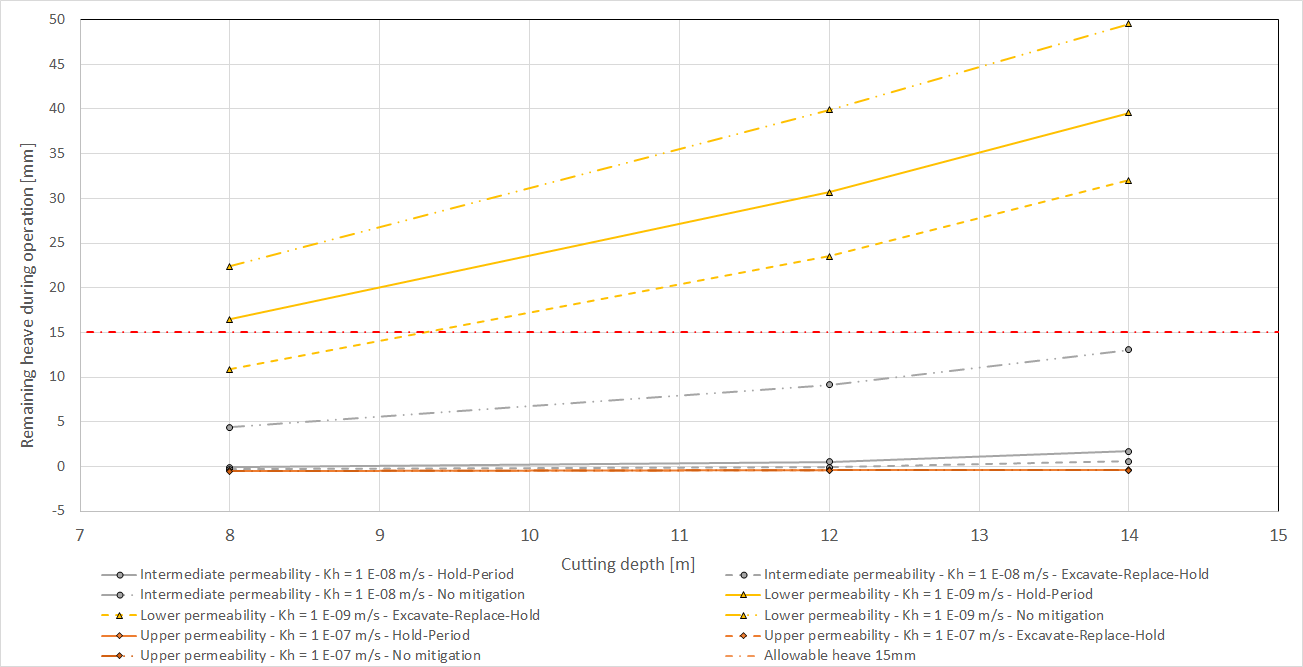
Figure 16, below, illustrates the expected remaining heave during operation as a function of the cutting depth, based on a sensitivity study undertaken to review the effect of insitu permeability on estimated residual heave. It should be noted that the data presented in Figure 16 were obtained from models considering a longer duration (450 days) for the excavation works than the excavation duration (of 100 days) used to develop Figure 15 above. As discussed above and illustrated in Figures 15 and 16 the rate of heave, and thus the residual heave post construction and hold period are highly sensitive to the permeability of the heaving strata. While the determination of a reasonable estimate of in situ permeability from ground investigation data and field observations is outside the scope of this paper it should be noted that such parameters, and thus the estimation of effects sensitive to them, are subject to a considerable degree of uncertainty. Results from in situ permeability tests on site indicate permeability values ranging from 1×10⁻⁹ m/s to 1×10⁻⁵ m/s, with a cautious estimate for the upper bound value of 1×10⁻⁷ m/s being taken in the analysis presented in Figures 15 and 16 rather than the highest value measured in situ.
A combination of the proposed cutting height combined with the modelling outputs were used to estimate the movements at intermediate depths along the cutting profile.
APPLICATION OF FINDINGS TO ASSESSMENT OF MITIGATION STRATEGY
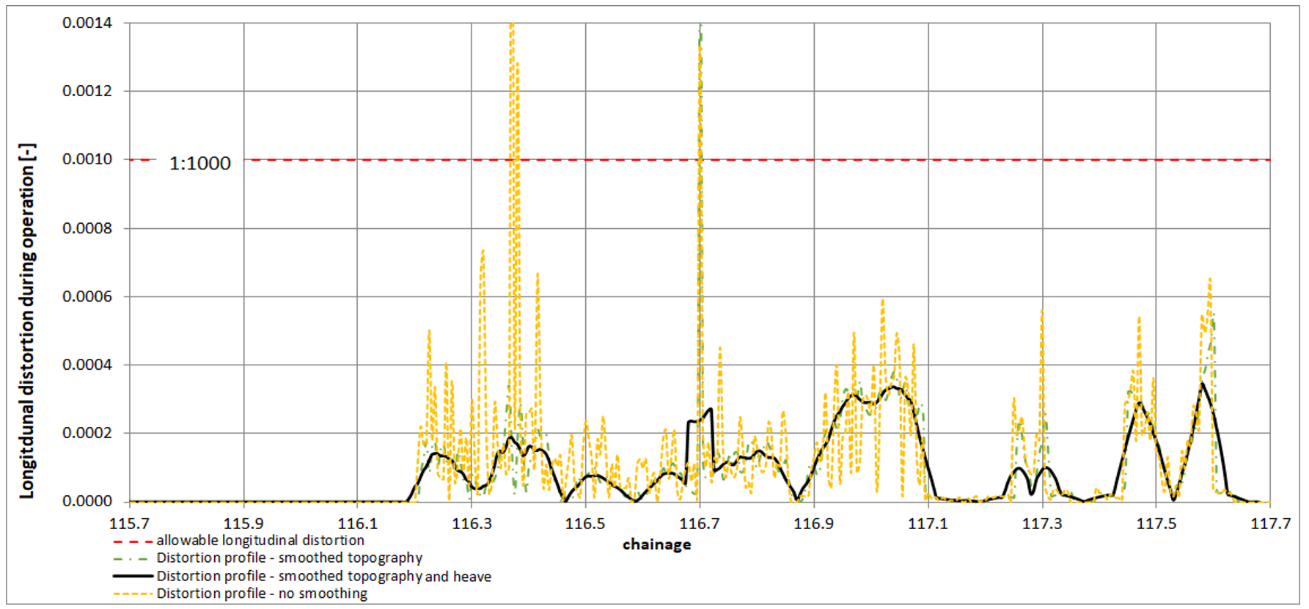
The results of the calculations provide an estimate of the evolution of vertical heave at the cutting base during the excavation, hold period and operation phase of the project. These 2D ‘slices’ through the heaving cutting were calculated at various points along the cutting, to provide an indication of the potential heave with variations in strata and cutting depth. By interpolation a potential heave profile for the entire cutting can be generated from these 2D slices. However, when viewed longitudinally this series of points tends to give a very irregular profile due to local variations in topography. To account for this a smoothing approach was adopted in lieu of a full 3D FE analysis. The smoothing took two forms.
The initial smoothing deals with local variations in topography, such as ditches and road surfaces, by considering the average vertical loading being applied by the overburden at the proposed base of the cutting, by shedding the load from any local topographic highs and lows through the overburden a more representative load state at cutting formation level can by estimated, and then this average depth related loading used in the calculation. The next stage of smoothing considers the heave effect generated at depth below the base of the cutting level, and the distortion shedding effect the intervening strata would have in smoothing out any locally calculated variations. By applying these two simple depth-related smoothing approaches a more representative pseudo-3D profile was generated. The smoothing effect of these techniques are illustrated in Figures 17 below:
When the HS2 acceptance criteria for total heave and allowable longitudinal distortion are applied to these outputs the extent of any engineering measures required to mitigate the effects are apparent, as illustrated above. The design of such measures is outside the scope of this study, but mitigation falls into essentially four approaches:
- Observational Approach; allow sufficient flexibility in the program, with some form of acceleration, for the heave effect to dissipate such that any residual movements are within acceptable limits (Options 1 and 3)
- Engineered Separation Approach; separate the track system from the heaving strata by using a heavily engineered track support (Option 2)
- Containment Approach; reduce the load being removed from the formation by constraining the excavation dimensions (Options 4, 5 and 6)
- Maintenance Approach; provide sufficient adjustment within the track system to allow movements to be compensated for by regular maintenance interventions (Option 7)
Conceptual arrangements for some of the options that may be considered for the mitigation of cutting heave are shown below. Deployment of such options would be subject to a significant level of detailed analyses, investigation and design.
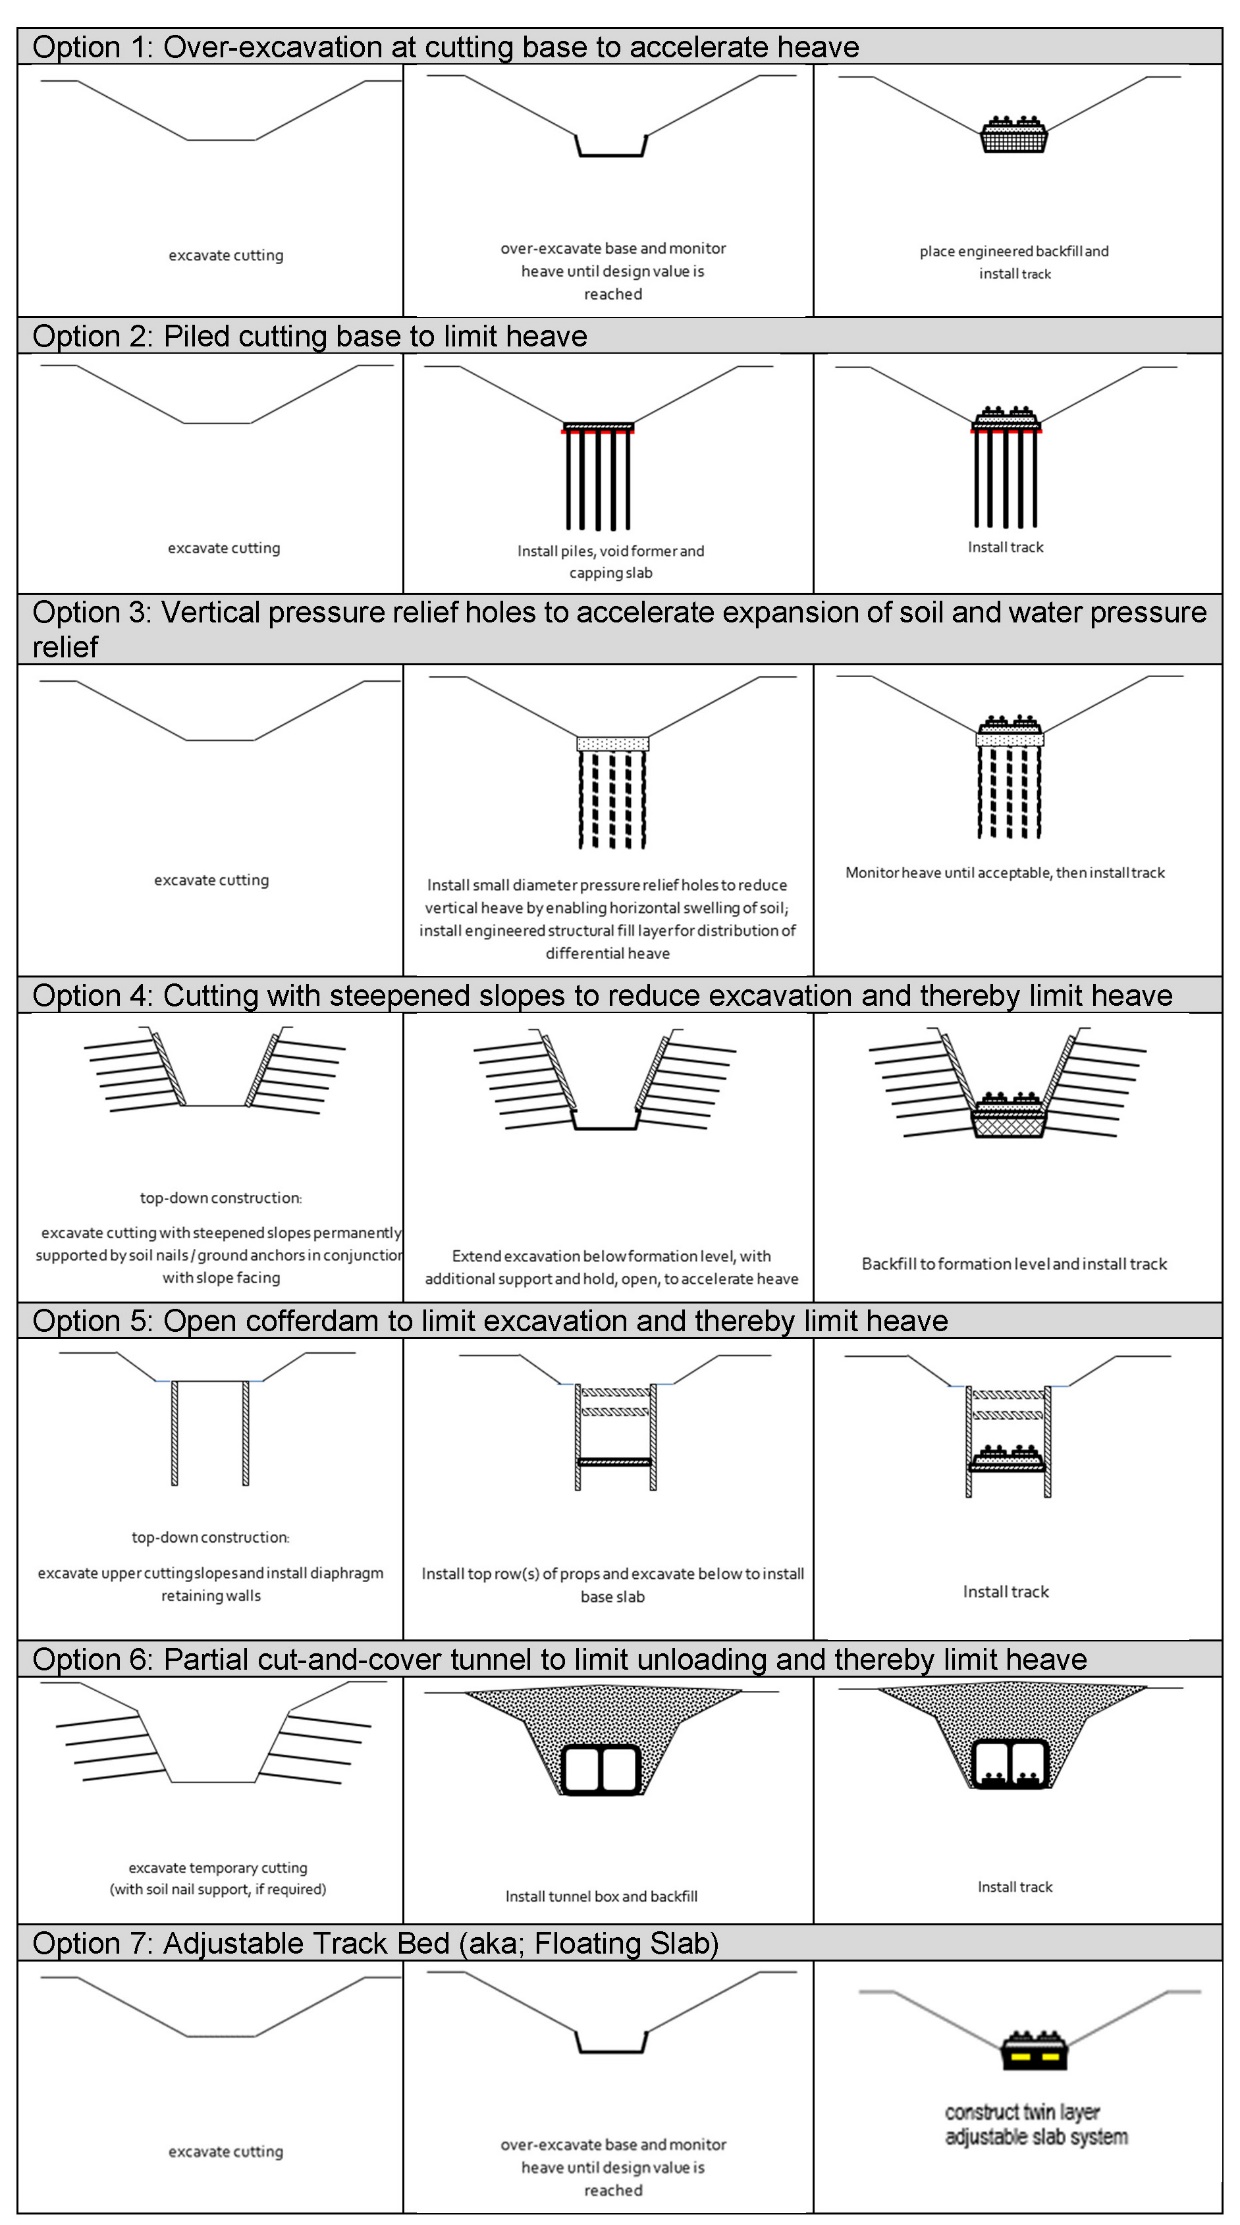
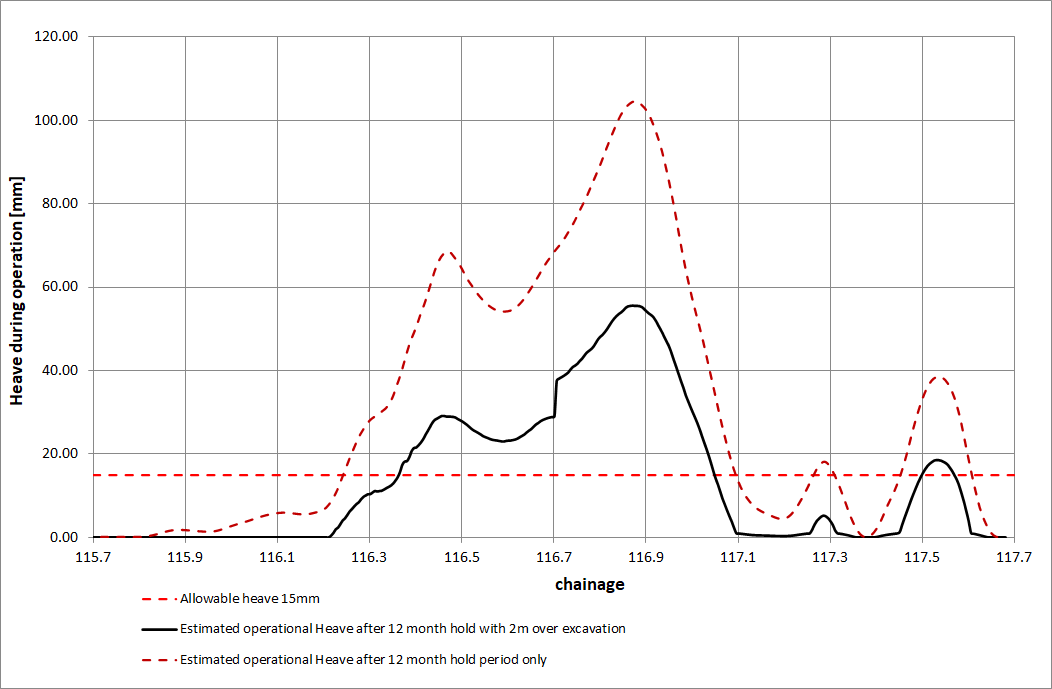
Figure 18, below, illustrates the potentially beneficial effect of using Option 1, above, excavate and replace to accelerate the heave. It should be noted that in the case shown the use of this simple mitigation does reduce the maximum calculated residual heave by about 45mm, but for the central section of the length assessed does not reduce the effect to a value below the specified acceptance criteria.
CONCLUSIONS
The HS2 Phase One alignment creates the requirement for deep cuttings which will be underlain by high plasticity over consolidated clay deposits. There are historical examples of heave occurring in the base of such excavations with magnitudes and time to completion which could cause unacceptable distortion in sensitive linear infrastructure such as HS2.
The heave phenomenon is dependent on key ground characteristics and conditions, which can be estimated with varying degrees of certainty from GI. Understanding the stratigraphic succession, groundwater conditions and stress history are as important as the output of advanced laboratory testing. The impact of the phenomenon is also influenced by design decisions such as the geometric form of the excavation, the period available before operation and the form of track system utilised.
Simplistic calculation can be used to estimate the effect, but their use is limited once considerations of variable geometry, geology and construction sequence are taken into account. Industry standard FEM software can model the phenomenon in a holistic manner. It was apparent that the results are very sensitive to the key input parameters but through a process of sensitivity assessments and testing of key assumption the generic FEM analysis provided useful input to the specification of GI requirement.
The derivation of input parameters for all forms of site-specific analysis, including FEM, from GI data remains subject to a degree of uncertainty that requires caution when applied to the development of mitigation measures. In particular, the time dependent elements of the effect, which is dependent on permeability and its anisotropy, remain significantly uncertain. A degree of risk management is required during the design and operation of the infrastructure to account for this uncertainty.
Despite these inherent uncertainties, the approach described in this paper gives a reliable methodology for estimating potential ground heave from available ground engineering data during the early stages of design development.
The use of large-scale trial excavations, such as those carried out, in the past, at Elstow, provide a significant reduction in the uncertainty, allow refinement of strata specific models and ensure optimised design. However, such trials require a substantial amount of expense and time to ensure they provide reliable data and thus value. It is recommended that the findings of a trial excavation currently being undertaken by HS2 be published at a later date to inform the wider understanding of this phenomenon.
Acknowledgements
Development of research within a commercial environment is always a team effort. It requires a client prepared to fund the work, employers willing to take the risk of undertaking the work and employees willing to stretch themselves mentally, as well as often giving of their free time, to advance their own understanding of the subject. The authors would therefore like to acknowledge the support of everyone involved in the development of the work described in this paper, a few are specifically mentioned below, many more are not, and probably many more are not even known to us, but all have supported us in the development of this element of the HS2 project, and for that we are grateful.
The authors would like to acknowledge the support of HS2 Ltd in the development of the approach described in this paper. Particularly former and current staff; Nick Sartain, Duncan McFadyean and Sarah Trinder from the HS2 Technical Team and Uma Shanker, David Williams and Luis Gonzalez from the C23 Sector Management Team.
The Atkins team would further like to acknowledge the support and guidance of former and current members of the Ground Engineering Team; particularly Peter Gilbert and Paul Nowak for guidance and encouragement, and the tireless efforts of the geotechnical and numerical modelling teams; especially Alex Lee, Peter Houlston, Spiros Liakas.
The ASC team would like to acknowledge the works undertaken on this topic by the geotechnical team; especially Deneys Schreiner, Mathilde Vernay, Richard Yuan, Mélina Turle-Daumas
References
[1] HS2 Limited (2017) Technical Standard Earthworks Unpublished Doc Ref: HS2-HS2-GT-STD-000-000001 P05
[2] Atkins (2013) Country South Interim Preliminary Design Geotechnical Desk Study Report Unpublished Doc Ref: C222-ATK-GT-REP-020-000001 P04:
[3] Atkins (2017) HS2 Phase One (Area Central) Historical Cutting Heave Review Report Unpublished Doc Ref: 1D031-EDP-GT-REP-000-000012 P02
[4] Burland, J. B., Hancock, R. J. R., & Burland, J. (1977). Underground car park at the House of Commons, London: geotechnical aspects Building Research Establishment.
[5] Burland, J. B., Simpson, B., & St John, H. D. (1979). Movements around excavations in London Clay. In Proc. 7th Eur. Conf. Soil Mech., Brighton (Vol. 1, No. 13.20).
[6] Burford, D. (1988). Heave of tunnels beneath the Shell Centre, London, 1959–1986. Geotechnique, 38(1), 135-137.
[7] Vaziri M., Steen P., Hartlib T., (2007), Designing for geotechnical risks of a deep basement in an urban environment – a case study European Conference on Soil Mechanics and Geotechnical Engineering
[8] Ng, C.W.W., Simons N., & Menzies, B. (2004), A short course in soil structure engineering of deep foundations excavations and tunnels ICE Publishing,
[9] Ng, C. W. W. (1992). An evaluation of soil-structure interaction associated with a multi-propped excavation (Doctoral dissertation, University of Bristol).
[10] Nicholson, D. P., & Harris, S. J. (1994). The use of gravity relief wells below basements in London Clay to control the rise in groundwater level. In Groundwater problems in urban areas: Proceedings of the International Conference organized by the Institution of Civil Engineers and held in London, 2–3 June 1993 (pp. 424-442). Thomas Telford Publishing.
[11] Kovacevic, N., Hight, D. W., & Potts, D. M. (2007). Predicting the stand-up time of temporary London Clay slopes at Terminal 5, Heathrow Airport. Géotechnique, 57(1), 63-74.
[12] Chang, C. Y., & Duncan, J. M. (1970). Analysis of soil movement around a deep excavation. Journal of Soil Mechanics & Foundations Div.
[13] Carder, D.R & Darley, P. (1998), The long-term performance of embedded retaining walls Transport Research Laboratory (TRL Report 381),
[14] De Nijs, R., Kaalberg, F., Osselaer, G., Couck, J., & Van, K (2015). Geotechnical monitoring of a trial pit excavation toward the Boom clay in Antwerp (Belgium). Geotechnical Risk and Safety V, At Rotterdam
[15] Hird, C.C & Pierpoint, N.D. (1997), Stiffness determination and deformation analysis for a trial excavation in Oxford Clay Geotechnique, 47, No.3, 665 – 691
[16] Pierpoint, N. D. (1996). The prediction and back analysis of excavation behaviour in Oxford Clay (Doctoral dissertation, University of Sheffield).
[17] Menkiti, C. O., Long, M., Kovacevic, N., Edmonds, H. E., Milligan, G. W. E., & Potts, D. M. (2004). Trial excavation for cut and cover tunnel construction in glacial till-a case study from Dublin.In Advances in geotechnical engineering: The Skempton conference: Proceedings of a three day conference on advances in geotechnical engineering, organised by the Institution of Civil Engineers and held at the Royal Geographical Society, London, UK, on 29–31 March 2004 (pp. 1090-1104). Thomas Telford Publishing.
[18] Burland, J. B., T. I. Longworth, and J. F. A. Moore (1977). A study of ground movement and progressive failure caused by a deep excavation in Oxford Clay Géotechnique 27.4 (1977): 557-591.
[19] Atkins (2016) East West Rail: Phase One. Area 7 Ground Investigation Report Unpublished Reference 5114534-ATK-GEO-RPT-010047 Revision: A02
[20] WS Atkins (1994) M25 Widening – Junctions 8 to 10 Geotechnical Factual Summary Report R1272/C/GEO/920491007 Unpublished HAGDMS Reference 19144
[21] Mettyear, N.V., (1984), The short term behaviour of a deep cutting in London Clay MSc Dissertation, Imperial College,
[22] Gartung, E., Von Wolffersdorff, P. A., & Schmidt, C. (2005). Serviceability assessment for a high speed railway track in Overconsolidated clay formations Case Studies in Geotechnical Engineering, GEOPRACTICE, 25-26.
[23] Zerhouni M, Dhoib A. & Hubert B. (2002), Swelling and Shrinkage Parameters for Clays – Standard Testing in France, Magnan (ed), Presses de l’ENPC/LCPC, Paris
[24] Rathje, E. M., Woo, K. S., & Crawford, M. (2006). Spaceborne and airborne remote sensing for geotechnical applications In GeoCongress 2006: Geotechnical Engineering in the Information Technology Age (pp. 1-19).
[25] Olsen, M. J., & Gillins, D. T. (2015, November). How Can Geomatics Technologies Benefit Geotechnical Studies?. In Proc. 6th International Conference on Earthquake Geotechnical Engineering.
[26] Wright, D., Dhillon, N., Wright, A., & Christie, C. (2012). Fusion Of High-Resolution Laser Profile And Lidar Measurements For Enhanced Condition Assessment 7th Symposium on Pavement Surface Characteristics: SURF 2012
[27] Viner, H., Abbott, P., Dunford, A., Dhillon, N., Parsley, L., & Read, C. (2006). Surface texture measurement on local roads Published Project Report PPR148, TRL Limited
[28] Nash, D. F. T., M. L. Lings, and C WW Ng.(1996) Observed heave and swelling beneath a deep excavation in Gault clay Proc. Int. Sym. on Geotechnical Aspects of Underground Construction in Soft Ground, City University, London
[29] Morrison, P., Kammer, J., Hammami, R., Frederiksen, J. K., Hansen, G. L., & Humpheson, C. (2015). Fehmarnbelt Fixed Link–trial excavation Geotechnical Engineering for Infrastructure and Development: XVI European Conference on Soil Mechanics and Geotechnical Engineering
[30] Calabresi, G., & Scarpelli, G. (1985, August). Effects of swelling caused by unloading in overconsolidated clays. In Proc., 11th Int. Conf. Soil Mechanics and Foundation Engineering (Vol. 1, pp. 411-414).
[31] British Geological Survey (retrieved 2020) Geology of Britain Viewer
[32] Atkins (2016) HS2 Phase One (Area Central) assessment of cutting heave and mitigation methods Unpublished Doc Ref: P1C-ATK-GT-ASM-000-000001 P02
[33] Atkins (2016) HS2 Phase One Cutting Heave Ground Investigation Guidance Note Unpublished Doc Ref P1C-ATK-GT-NOT-000-000002 P02
[34] Hight D.W., McMilan F., Powell J. J. M., Jardine R.J. and Allenou C.P. (2003), Some characteristics of London Clay. Proc. Conf. Characterisation and Engineering, National University Singapore. Tan T.S., Phoon, K.K., Hight D.W., Lerouil S. (eds). Balkema, Vol. 2, pp851-907.
[35] Bishop A.W. , Webb D. L. and Lewin P.I. (1965), Undisturbed samples of London Clay from the Ashford Common shaft: Strength-effective stress relationships, Geotechnique, Vol. 15, pp. 1-31
[36] ASC JV (2019) Heave Risk Assessment and Mitigation Design Unpublished Doc Ref: 1MC07-CEK-GT-REP-C003-000044 C01
[37] ASC JV (2020) Boddington Cutting Heave Trial – Monitoring Report at the End of Scheme Design Unpublished Doc Ref: MC07-CEK-GT-REP-CS07_CL14-000018 C01
[38] ASC JV (2020) Ground Engineering Technical Note – Deriving Parameters for the Assessment of Heave – Charmouth Mudstone Unpublished Dec Ref: 1MC06-CEK-GT-NOT-C002-000025 C01
Note: during review the following paper was highlighted to the Authors as providing further confirmation of long-term heave effects in London Clay excavations. It is recommended that the findings are incorporated into any future studies:
[39] Chan, D., Madabhushi, G., Nicholson, D. P., Chapman, T., & Solera, S. A. (2018). Twenty-one years of heave monitoring in London Clay at Horseferry Road Basement. Ground Engineering
Notation
| Notation | Units | Description |
|---|---|---|
|
E50ref |
kPa |
Secant stiffness at 50% ultimate strength in a drained triaxial test |
|
Eurref |
kPa |
Elastic unloading/reloading secant stiffness at engineering strains (ε≈10−3 to 10−2) |
|
Eoedref |
kPa |
Tangent stiffness for primary oedometer loading |
|
m |
– |
Power for stress-level dependency of stiffness |
|
G0ref |
kPa |
Reference shear modulus at very small strains |
|
γ0.7 |
– |
Shear strain at which secant shear modulus Gsec = 0.722G0. |
|
kx ,ky |
m/s |
Permeability in x axis (horizontal) and y axis (vertical) direction (lab) |
|
kh ,kv |
m/s |
Insitu Permeability in horizontal and vertical direction (field) |
|
K0 |
– |
Insitu coefficient of earth pressure at rest (or stress ratio) |
|
ϕ’ |
Deg |
Effective friction angle |
|
c’ |
kPa |
Drained cohesion |
|
ψ |
Deg |
Angle of dilatancy |
Peer review
- Nick Sartain, Head of Geotechnical EngineeringHS2 Ltd
- Graham ChurchHS2 (EDP Jacobs)