Incorporation of digital ground investigation data and geological model into the 3D BIM environment
Traditionally, geological interpretation is undertaken by manually annotating cross-sections, and updating them when new information becomes available. This is a time-consuming process and goes against the principles of good digital engineering.
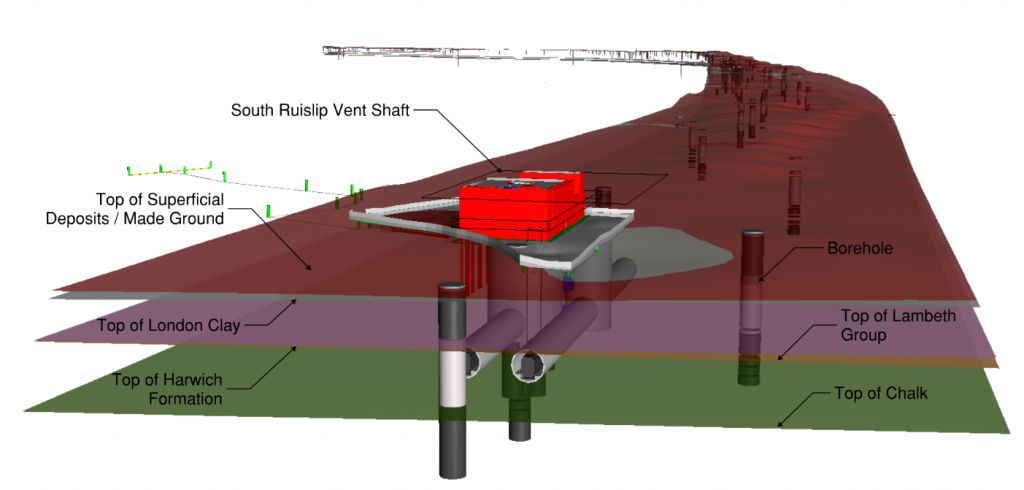
A workflow was developed for High Speed Two (HS2) so that raw ground investigation information forms a database that is then used to generate an up-to-date 3D geological BIM model. This model contains the geological strata covering a ~200m wide corridor along the HS2 alignment. Intelligent geometry represents the borehole sticks used to derive the surfaces, so the user can view the factual data behind the interpretation.
This approach automates the process of geological model updates with low manual effort, based on a series of algorithmic rules, and available on a Common Data Environment (CDE), allowing baselining of versions and easy transfer of information between disciplines.
This offers important time and cost savings to the project as most of the process is automatic, and the result only needs to be quality checked once the model is set up. Having a centralised, intelligent, up-to-date 3D ground model as a single source of truth allows easy access for all design disciplines using ground data, with improved consistency, quality and cost.
This paper discusses each step of the workflow, including how the geological modelling was undertaken. The paper then goes on to describe how the model has been checked, and some of its uses and benefits. Finally, possible future developments are discussed.
- Written by
-
James Bottomley (SCS/Arup)

-
Enrique Fernandez (SCS/TYPSA Ltd)

-
Roberto Alberola (SCS/TYPSA Ltd)

- Resource type
- Resource type: Technical Paper
- Intended audience
- Contractors
Introduction
One of the challenges facing designers when working on large infrastructure projects is the continual availability of new data. Drawings and models quickly become outdated and version control can be difficult. Moreover, it can often take a significant amount of time to update the drawings and models at great expense to the project.
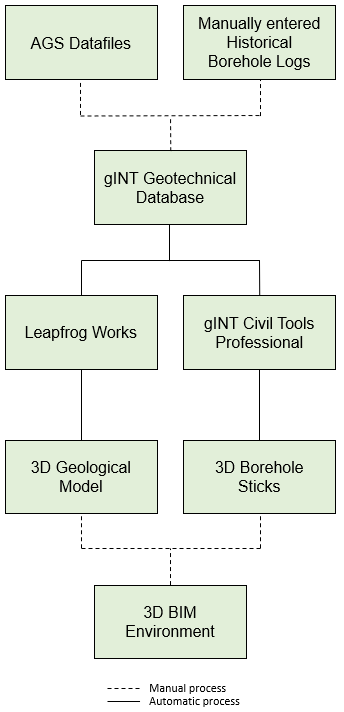
Here a workflow is presented of managing ground investigation data in gINT, using the data to build a geological model in Leapfrog, and then outputting boreholes and geological surfaces into a 3D BIM environment (Figure 1). The workflow minimises the requirement for manual processing as both the geological model and borehole sticks are linked to the gINT geotechnical database and automatically update based on a set of user-defined rules. This saves time and allows the geologist/engineer to focus their efforts on quality checking the output.
The geological BIM models are stored centrally in a Common Data Environment (CDE) for digital traceability and internal baselining. Traditional large infrastructure projects are limited by a siloed approach, where different design teams have access to different repositories of information, inefficiently updated, and poorly and irregularly connected to each other. This made the availability of good, up-to-date, and coherent interpreted geological data difficult, and generated vast amounts of waste in the form of lost time, inefficient change management and abortive work.
The current BIM Maturity Level 2 approach, set out in the 2011 UK Government Construction Strategy [1], aims to do away with all that waste, using what is normally described as the ‘Single Source of Truth’ to inform all design decisions. This approach relies on making available all the project information to all design teams through a series of data management systems under a Common Data Environment.
The geological model is intended to be used by a variety of disciplines, not just restricted to geotechnical or tunnelling engineers. The model is an effective way of communicating indicative sub-strata boundaries but does not contain the level of detail contained within the Ground Investigation Reports, so should not be relied upon for detailed design.
This paper focuses on work undertaken for the southern section of High Speed Two (HS2) Phase One – Lots S1 and S2 (Area South) – which includes the Northolt Tunnels and the Euston Tunnel and Approaches, being delivered by the SCS Integrated Project Team.
Workflow
Figure 2 shows a workflow of the steps that have been taken to go from the raw data provided by the ground investigation (GI) contractor to a 3D Building Information Modelling (BIM) Environment. The sub-sections below provide an overview of each of the software used in the workflow and how they are interconnected.
AGS datafile
All geotechnical data are provided by the GI contractor digitally in AGS format. The AGS format was developed by the Association of Geotechnical and Geoenvironmental Specialists (AGS) which “allows for seamless sharing of data between different software used within the geotechnical/geoenvironmental industry” [2]. AGS files are treated as the factual data that form the basis of geological and geotechnical interpretation.
After every phase of ground investigation, an AGS file is issued containing information about a hole such as its location and depth, geology encountered, laboratory testing results, monitoring installations, and monitoring results. AGS files are checked before they are added to the gINT geotechnical database by cross-referencing their contents against the accompanying factual report. The factual report and AGS are also checked against the specification to ensure all holes and laboratory testing specified have been undertaken. Also, if available, the factual report and AGS are checked against driller’s notes and/or the investigation supervisors notes. Once the data have been checked, they are imported into the database.
The final step is to ensure duplicates do not exist by exporting data to Microsoft Excel and using the ‘highlight duplicates’ function. Duplicate data should not exist if the correct overwrite setting is selected when importing, however this doesn’t always work if, for example, strata depths or monitoring IDs have been modified from one issue of the AGS file to the next.
gINT Geotechnical database
Bentley’s geotechnical database software called “gINT” has been used to manage all geotechnical data associated with the project. gINT acts as a central repository where all geotechnical data can be housed. These data mainly come from AGS files that have been imported, but also contain other data that have been manually entered such as historical boreholes from the British Geological Survey (BGS) that have no associated AGS file and downhole geophysics data. Within gINT, the BGS boreholes were named as “Historical” in the Investigation Reference field. This allowed these holes to be filtered out if required.
The database version is strictly controlled and a record of each new import is kept so that engineers can understand what has changed since they last used the database. This record of version history is an inbuilt feature of gINT, but one that relies on the user to diligently fill out a table that shows the changes.
As well as managing the geotechnical data, the database can also be used to create figures, graphs and geological cross-sections. Other third-party applications, such as Leapfrog Works (discussed in the next section) can connect to the database and extract information.
Leapfrog Works to produce a 3D geological model
Leapfrog works is a geological modelling program. Boreholes containing geological information are read from the gINT geotechnical database into Leapfrog, which are then used as the basis for building a 3D geological model. Detailed information on how the geological modelling has been undertaken is provided in the subsequent section titled “About the Geological Model”.
The 3D geological surfaces produced are easily exported to a computer-aided design (CAD) file, ready for incorporation into the BIM environment. This is a manual export process built into Leapfrog’s functionality, as indicated by the dashed line in Figure 2. The export only takes several minutes. Once exported, the CAD file is incorporated into the 3D BIM environment, as described in the sub-section below titled “3D BIM Environment”.
gINT Civil Tools Professional to produce 3D borehole sticks
gINT Civil Tools Professional is the program that was used to create 3D borehole sticks in CAD format. Much like Leapfrog Works, gINT Civil Tools Professional connects to the geotechnical database. The boreholes are 3D cylinders made up of segments, where each segment represents a different lithology. Each segment has attributes which include the geology code and the geological description provided by the logging geologist. This is the same description that would be found in the borehole log. The user can therefore click the depth of borehole they are interested in and the geological description will appear. This approach represents an advancement on the usual method of viewing boreholes on a 2D section where just the main lithology is shown.
3D borehole sticks were generated because it was deemed to be important for the end user of the ground model to have the factual data available to them as well as the interpretation. This enables the user to understand how many boreholes are in their area of interest so that a judgement can be made of the accuracy of the model in that location.
Incorporation of the CAD file containing the 3D borehole sticks into the 3D BIM environment is a manual process, as indicated by the dashed line in Figure 2. This takes less than one minute, and the process is described in more detail in the section below.
3D BIM Environment
The output of these processes is a CAD file (DGN format) containing native CAD objects. Interpreted geological strata are represented by meshes that define the interface surface between strata. Boreholes are represented by a series of simple geometries (cylinder segments) representing the different lithologies, stacked vertically to conform the actual borehole data, topped with an abstract 3D flag representing the position of the borehole.
All the CAD objects (3D borehole sticks and 3D geological surfaces) in the 3D model are categorised into levels (model object containers). These follow the standard naming conventions of the project so that they can be interpreted and utilised easily by anyone within the project team, or the client. Transferring the borehole and surface information into the BIM model is a manual process, as indicated in Figure 2, however this process has been set up to minimise user intervention, making sure that the model outputs are already categorised into their correct levels.
The model is monitored from a performance point of view to ensure the model is usable on a standard PC, without putting a strain on computer resources. This includes keeping the file sizes practical and the response times sensible. As more borehole data becomes available, the performance aspect will be continuously analysed, and the possibility of segregating the models further by area or asset will be considered.
All borehole elements are enriched with non-graphical data through the addition of two custom-made attribute schemas (definition groups). The borehole flag carries a schema called “Borehole” with general information for the borehole, such as its name, northing and easting coordinates, its elevation, depth and its originator. Borehole segments are tagged with a schema called “Lithology” that specifies the borehole name, depth, bottom level, and the geological description provided by the logging geologist. All this non-graphical information is available to any user opening or referencing the file in their CAD software, making sure that they can see and check against the raw data when using the interpreted geometry.
The 3D BIM Environment is updated every time an AGS file is issued that contains new boreholes. This is typically every 2-3 months currently.
About the Geological Model
Coordinate system
The ground model was created using the HS2P1+14 SnakeGrid Coordinate System. SnakeGrid provides near-zero distortion coordinate systems for long infrastructure projects such as roads, railways and pipelines where the curvature of the Earth needs to be corrected for [3].
Model surface resolution and extent
The resolution of the geological surfaces is a trade-off between having a resolution high enough that it captures geological variation when boreholes are spaced closely and having a resolution low enough that data nodes are not created unnecessarily in areas where there are no boreholes. Having a lower resolution model also speeds up computational time and makes the model usable without the need for a high specification computer.
The horizontal resolution of the geological surfaces chosen was 25m. The resolution took account of the fact that the minimum distance between boreholes is often in order of 10s of metres where boreholes are targeting structures such as stations, cross-passages and ventilation shafts, however away from these structures, there are often distances between boreholes of 200m or more. The resolution also took account of the fact that the surfaces are indicative and intended to be used for detailed design.
The resolution of the uppermost geological surface follows the natural topography. The topography used in the model is publicly available LiDAR data [4] that has a horizontal resolution of 1m and a vertical resolution of ±15cm so that subtle features would be captured in the model, and so that the top of the borehole sticks match the upper surface as closely as possible.
The extent of the ground model was set to be a ~200m wide corridor, centred on the tunnel alignment. Although the majority of HS2 boreholes lie within 50m of the alignment, there were some useful historical boreholes provided by the BGS that were often located further from the alignment. The geological model was extended to incorporate these holes as they provided useful information, especially on the depths of deeper stratigraphic units.
Geological units modelled
The geological units that have been modelled are:
- Superficial Deposits (including Made Ground);
- London Clay Formation;
- Harwich Formation;
- Lambeth Group;
- Thanet Sand; and
- Chalk
These units are the parent units of the London Basin. The Ground Investigation (GI) contractors often provide more detailed sub-units for the London Clay Formation and the Lambeth Group. The London Clay Formation classification by King [5] relies on a combination of lithological and palaeontological criteria to distinguish between sub-units and is therefore very difficult to accurately log. Previous attempts at correlating the London Clay sub-units in HS2 boreholes highlighted this difficulty. Some boreholes don’t attempt to differentiate the London Clay, whilst others that did, often had large lateral inconsistencies over short distances.
The Lambeth Group sub-units are more distinguishable and therefore the logging is often more laterally consistent.
For the first iteration of the model, it was decided that both the London Clay and the Lambeth Group would be modelled as single, parent formation. This decision was made because many of the non-geotechnical users of the model would not be interested in the subdivisions, and because of the difficulties correlating the London Clay described above.
Geotechnical designers are expected to reference the Ground Investigation Reports and independently analyse boreholes around the asset they are working on to gain this level of detail. Nevertheless, it is intended that the Lambeth Group will be modelled at sub-unit level in the next iteration of the model. This is discussed in the “Possible Future Developments” section towards the end of this paper.
User-defined rules
The user defines rules that Leapfrog uses to interpolate between borehole sticks and create surfaces of geological strata. These rules are based on geological understanding of the London Basin such as the stratigraphic units, their depositional sequence and the type of boundary that separates units.
The Thanet Sand (TS) has been used as an example here to demonstrate what these rules are:
- Contact points are created in boreholes that represent the top of the TS. The user specifies that the TS a deposit (rather than an intrusion or vein for example) and that contact points above the TS will be with the Lambeth Group. Where the top of the TS was joined to a segment of unspecified lithology, such as in sections of open holed drilling or where no core was recovered, the segment was ignored and no contact point was created. This is because the user cannot be sure if the top of the TS in the borehole is actually the top of the TS or if the section of core loss was also TS. Leapfrog was also instructed to convert enclosed ignored segments. This means that if a section of core loss has TS above and below it, the section of core loss would also be treated as TS.
- The contact points are then put in their correct place in the chronology of the model, i.e. the program is told the top of TS contacts are younger than the top of chalk contacts, but older than the top of Lambeth Group contacts.
- A surface is then fit through the top of TS contact points. The trend of the surface was set to be horizontal, so the program always tries to fit a horizontal surface between contact points. The TS does dip at a very shallow angle with distance away from Euston Station to follow the regional dip of the London Basin, however as the contact points as so closely spaced in comparison to this regional trend, the surface between points can be assumed to be horizontal.
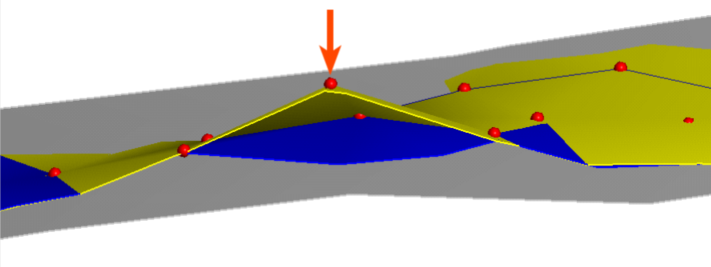
- The surface fit through the top of TS contact points also uses a user defined “maximum snapping distance”. The principle of maximum snapping distance is illustrated in Figure 3. Three surfaces (grey, yellow and blue) have been generated using red contact points. The grey surface has been created when snapping is turned off and shows a very smooth surface. The blue surface has been created when snapping is turned on, but the maximum snapping distance is set to a low value. This has created a smooth surface that has only snapped to the closest red contact points. The yellow surface has been created when snapping is turned on and the maximum snapping distance is set to a high value. This has resulted in the surface snapping to the most distance red contact point (highlighted by the red arrow). A maximum snapping distance of 25m was used in the geological model described in this paper. This was the maximum distance available for a model with surfaces with a resolution of 25m and resulted in the surfaces following the borehole data as closely as possible. This was chosen to prevent Leapfrog smoothing out potentially important small-scale geological features.
Fault blocks can also be included the model if they exist in the area of interest, although no evidence of faulting has been found along the HS2 alignment in Lots S1 and S2.
Quality checking
The geological model was quality checked using the following techniques:
- Comparing a cross-section cut through the model along the tunnel alignment to a previous manually interpreted geological cross-section created along the tunnel alignment. This method highlighted any discrepancies between how a geologist has interpreted the data to how the computer algorithm did the same task. The algorithm could then be adjusted to ensure a close match between the two.
- The upper surfaces of the geological units could be coloured in Leapfrog in a way to highlight steep changes of slope (Figure 3). These changes of slope are often caused by two adjacent boreholes that show the strata at different levels. Areas showing steep changes of slope were then analysed in more detail by checking the borehole log and core photographs to understand if the likely cause was a natural feature, such as a fault or solution feature, or a potential logging error. Occasionally, the core store was visited by Design House geologists and geotechnical engineers if checking the factual report did not clarify the situation.
- Checking the strata to show consistent lateral thicknesses over short distances. There are, of course, regional trends that are to be expected. If thickness change was deemed to be a logging error after investigation, the segment of the borehole causing the change could be ignored.
- The model was also independently checked by another Project Geologist who has been studying the ground conditions along the alignment. The geologist was able to indicate areas that required further refinement.
- Once the geological model and 3D boreholes have been incorporated into the BIM environment, the information is digitally signed by the originator, ensuring it has been checked and verified before it goes to a status that makes it visible to the wider team for coordination purposes, minimising abortive work due to incorrect data.
Usefulness of the Geological Model
Time and cost saving
One of the benefits of using Leapfrog is that once a geological model has been created, the model automatically incorporates new data into the model and updates geological surfaces. This provides a large time saving and allows the user to spend their time checking both the factual data input and the geological model output, rather than manually interpreting the data.
It is estimated this has saved the project 720 hours (or 90 working days) of time if it is assumed Design House receives a new AGS file every two months for three years, and the time taken to update the model is one working day compared to five working days if the interpretation was undertaken by hand. These numbers are based on HS2 Project experience before Leapfrog was used as a geological modelling tool.
Plan future ground investigation
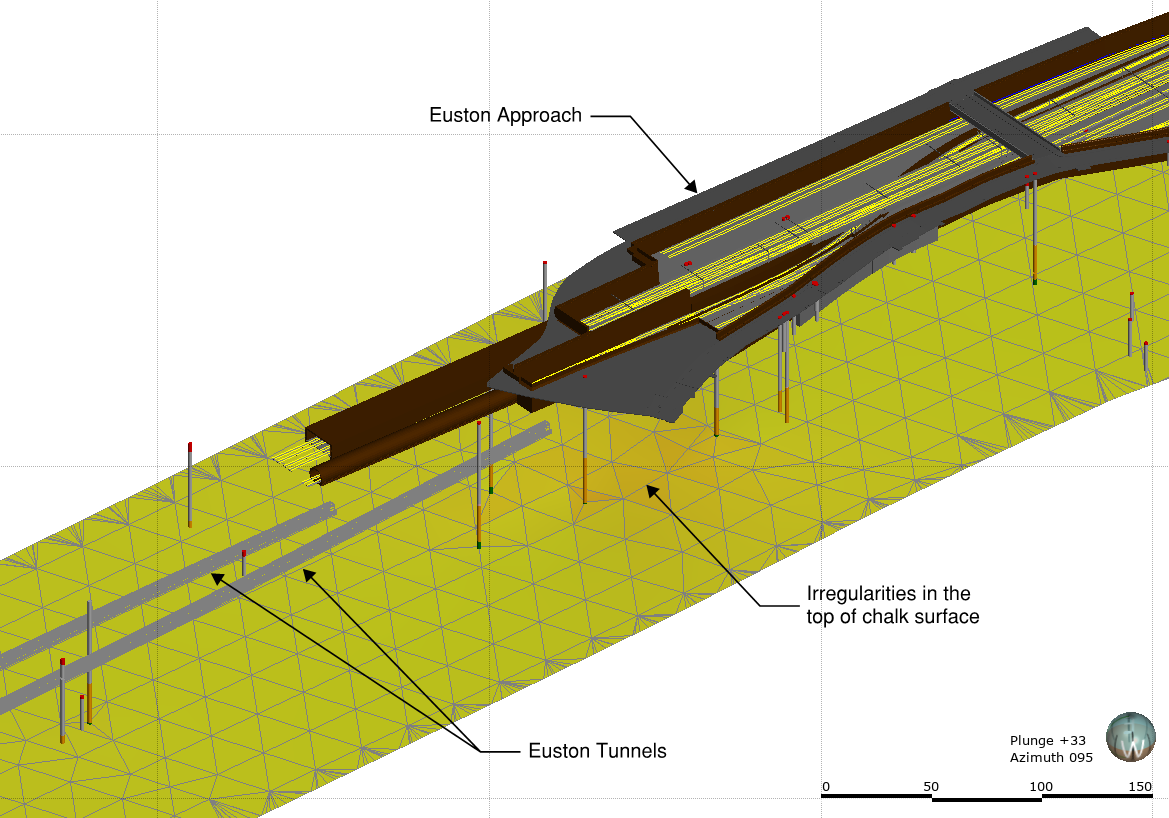
The model was useful for highlighting areas of the alignment that were lacking data. It is easy to understand the spatial distribution of the holes if they are plotted as points in plan view, but it is difficult to visualise how deep each of these holes is. Having the holes plotted as cylinders and plotted in 3D space makes this visualisation much easier. The alternative would be the user plotting 2D cross-sections in a program like gINT to achieve the same result, which takes time and would soon be outdated.
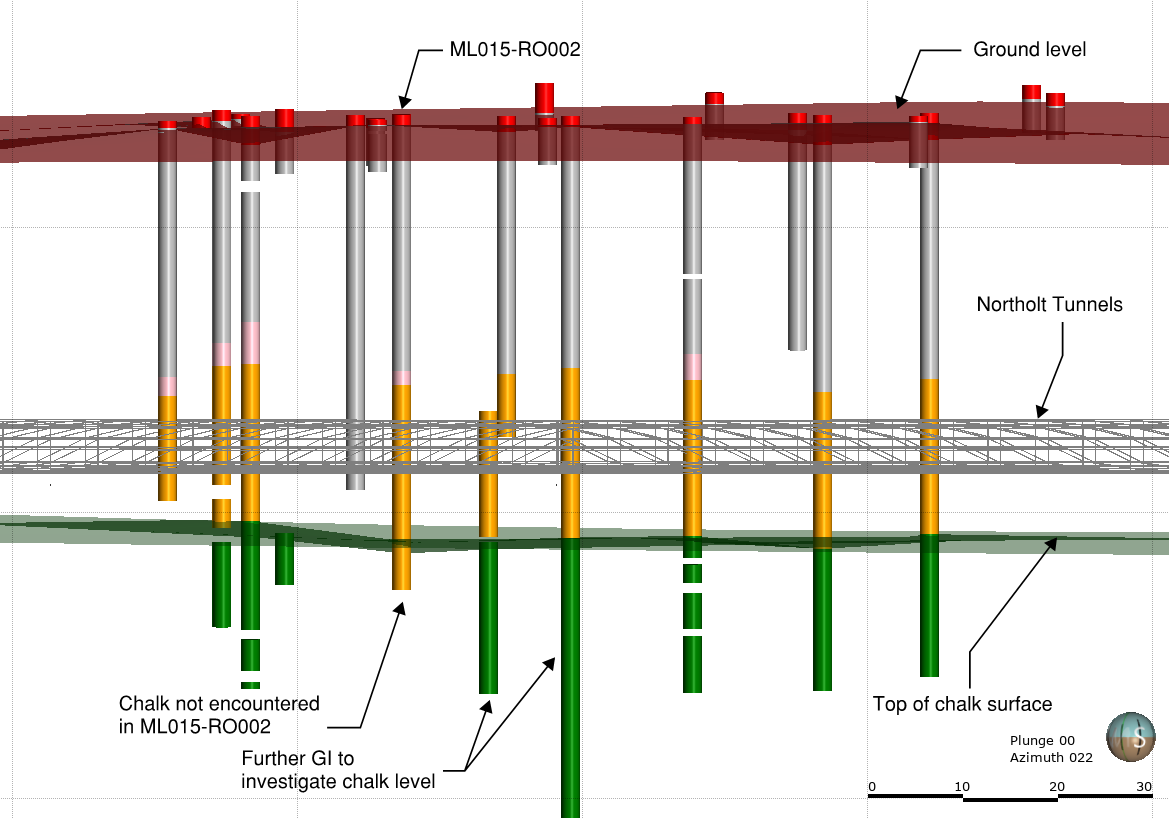
The geological model was also useful for highlighting where existing borehole information was inconsistent across short lateral distances. An example of this is at Greenpark Way Vent Shaft, where the chalk elevation varied by >5m between adjacent boreholes (Figure 4). It was hypothesised that this might be a solution feature in the chalk or a possible fault. Further ground investigation consistently encountered chalk at the higher of the two elevations, suggesting the chalk was either incorrectly logged or that a small solution feature exists.
Centralised source of information
Using ProjectWise as a Common Data Environment allows for digital traceability and internal baselining, with a document having multiple revisions at different times, and keeping a trail of the individuals involved with the authoring and checking of the data. This helps the user understand what geological information (raw and interpreted) was available at the time of making certain design decisions.
The information is made available together with a non-graphical file containing a series of notes on the interpretation of the data, explanations on the nature of the information contained in the BIM models, and a general disclaimer about raw data versus interpreted surfaces, giving all users a better understanding of the purpose of the models and what they can and cannot be used for.
Transfer of geological understanding
Incorporating the geological model into a 3D BIM environment allows geological understanding to be easily transferred between disciplines. Users can cut sections through the model so that geological boundaries can be superimposed on to technical deliverables (such as drawings or models). In addition, their object nature as native CAD elements (meshes and cylinders) allows for them to be quickly published to simple packaged models (in isolation or together with any other models such as design or third-party information). They can be opened and queried using universal model review tools, allowing for everyone on the project team, including people not directly involved with the model and drawing production, to be able to consume the BIM geological data. The following caveat is always provided alongside the model itself to prevent designers using the model for unintended purposes: “The boundaries between geological strata and sub-strata are indicative and for illustrative purposes only. For further information on ground condition, reference should be made to the appropriate Ground Investigation Report and associated factual reports and borehole logs.”
Case study: Modelling a historic clay pit at Atlas Road Logistics Tunnel
The desk study at Atlas Road Logistics Tunnel discovered that a disused and backfilled clay pit exists near the tunnel box. Historical Ordnance Survey maps from 1896 and 1920 indicate the clay from this pit was used to make bricks. The 1920 map shows the clay pit has expanded since 1896 and, whilst the northern extent is clearly shown, the southern extent of the clay pit is unclear. It was also unknown whether the pit continued to expand after 1920 as the next available map no longer shows a clay pit.
Knowing the depth and extent of the Made Ground contained within the clay pit was critical because, at the tunnel box, the ground cover is minimal. Having this cover made of Made Ground rather than London Clay would affect tunnel reinforcement, any excavation and replacement of the Made Ground material, or additional surcharge.
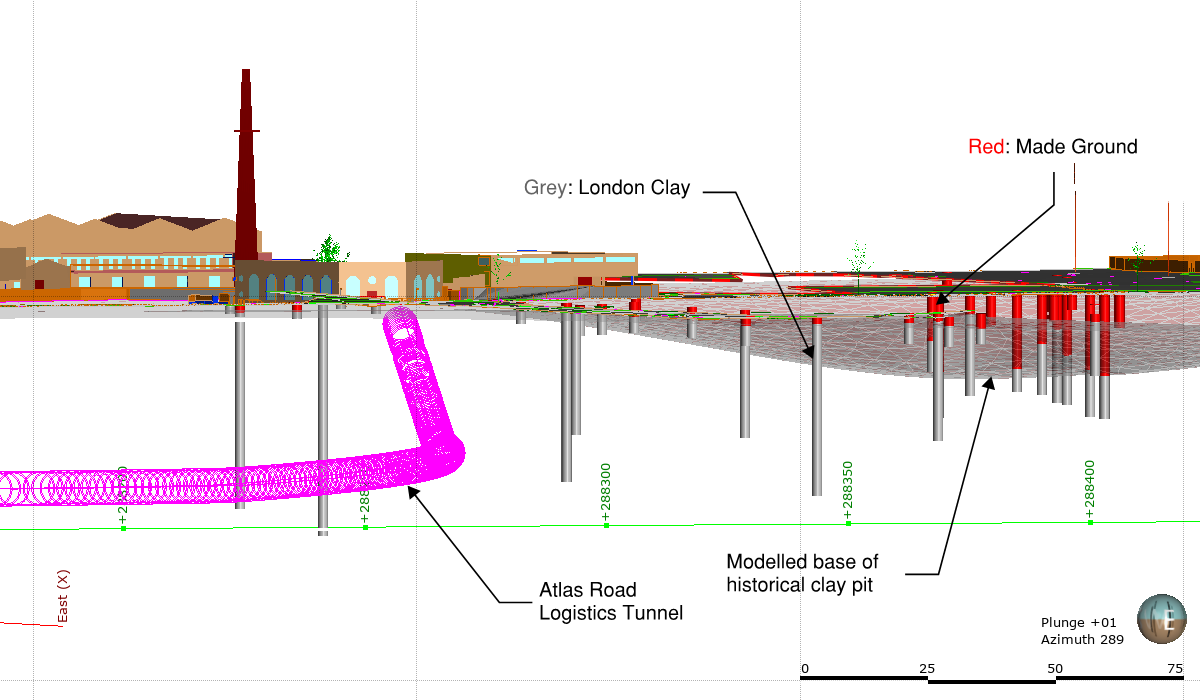
The geological model and 3D BIM elements were combined so that the location of Atlas Road Logistics Tunnel (ARLT) could be seen in relation to the clay pit (Figure 5). On Figure 5, the surface separating the Made Ground (above) and the London Clay (below) is shown, rather than the geological volumes.
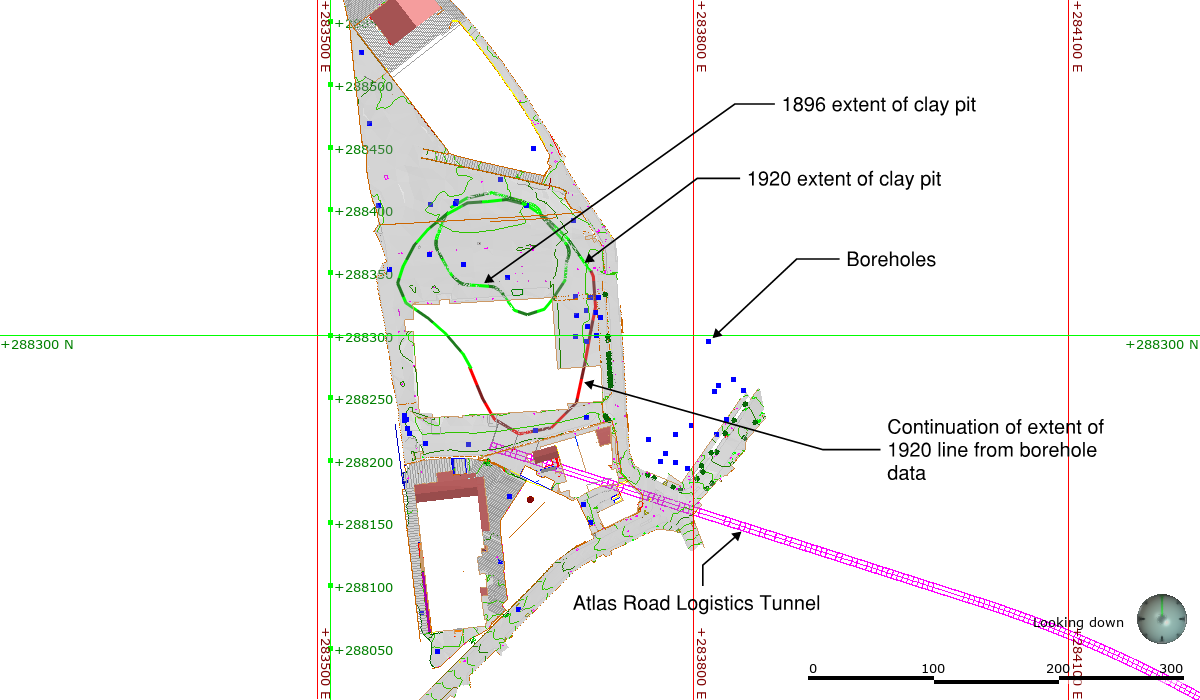
The two historical Ordnance Survey maps from 1896 and 1920 were georeferenced in the model to help delineate the northern extent of the clay pit (Figure 6). Boreholes and trial pits were then used to interpret the pit’s southern extent and provided an indication of its depth from the thickness of Made Ground encountered.
The results of the modelling showed that the ARLT box does not intersect the historical brick pit and the model indicates that less than a metre of London Clay covers the crown of the tunnel. Knowing that the tunnel will be in natural material, for which we have a good understanding of material parameters, allowed the design to be optimised.
Possible future developments
Model the Lambeth Group sub-units
As discussed in the “Geological units modelled” section, currently the Lambeth Group is modelled as a single formation. Another possible future development would be to model each of the sub-units of the Lambeth Group individually. The Lambeth Group contains a wide range of particle sizes from clays to gravels creating both drained and undrained conditions, so having sub-units will provide the designer with a better understanding of the material they are designing in.
Include groundwater levels
It would be useful to include the groundwater levels or contours of porewater pressure in future model revisions as this information plays a vital role in geotechnical design. One difficulty foreseen is that groundwater levels vary seasonally so some thought would need to go into whether we produce either: 1) an annual average, 2) average winter levels and average summer levels, or 3) just the worst case design scenario.
Create higher resolution models specific to assets
One of the compromises made when creating the geological model was the 25m lateral resolution of the geological surfaces. Some assets, particularly around Euston Station, have boreholes that are spaced <25m apart, meaning borehole data may be averaged out by the model and important details missed. A possible future development for detailed design would be to create asset specific models at a resolution appropriate to that asset, and then combine these smaller models in the BIM environment.
3D GIS and geological BIM model synergies
A geological BIM model can be used to link into the 3D GIS project system, where it can be overlaid with the vast catalogue of GIS information (3D and 2D) to enable fast access and easy analysis. Keeping both systems dynamically connected would ensure the 3D GIS platform could be used as part of the Common Data Environment to easily access the geological information without even needing any software installed.
Calculate volumes of each strata to be excavated during tunnel construction
One possible CAD output from the process is obtaining solid models representing each of the geological strata instead of interface mesh surfaces. These can then be intersected with HS2 asset excavation models produced as part of the design process, to evaluate the approximate quantities of excavation from different strata. This may be useful if material from certain lithologies is to be repurposed. Some materials may need to be conditioned with foam to prevent clogging during excavation or lime may need to be added to make the material useable once excavated. This information can then be fed into the 4D (programme) and 5D+ (cost and carbon) processes to calculate any significant impact.
A Summarised Earthworks Quantities Schedule (SEQS) is currently used to do this task. It is time consuming to create a SEQS, and if geometries change, the spreadsheet quickly becomes outdated. The model could either be used to replace the SEQS system entirely or could be used as a quick check to ensure the volumes produced are consistent.
Automate obstruction detection
A great deal of time has been spent by geotechnical engineers gathering information about potential obstructions along the alignment. As Ting and Gilson [7] demonstrated, the geological model could be used to automatically detect clashes between building foundations and the tunnels at an early stage of the project. The age and height of the building could be combined with geological information to automatically predict whether a building is piled, and how deep the piles might be. The geological model allows for identification of strata, such as sand units in the Lambeth Group, where piling technology at the time of building construction could mean these strata could not be penetrated, and therefore making the presence of piles unlikely.
Buildings deemed to have a high risk of causing an obstruction from the initial assessment could be targeted for further study to identify the actual foundation geometry, similar to the phased approach taken for Ground Movement Assessments. As Ting and Gilson point out, this has the potential to save time and money if obstructions are understood as early as possible because alignments may be adjusted accordingly.
Updating the model during construction
As the HS2 tunnels are excavated the actual ground conditions are exposed. This presents an opportunity for the model to be further refined because it is not often such a large amount of sub-terranean London is exposed, not only through tunnelling but also in areas of cutting. At the construction phase of the project, there may be limited benefit to HS2, however this information should be documented for the benefit of other future projects as part of the learning legacy of HS2.
Sharing the model publicly via the British Geological Survey
The geological model through north-west London could be made available publicly available through an organisation such as the British Geological Survey (BGS). The BGS has already developed a 3D geological model of the London Basin [8] that could also be updated to contain information from boreholes drilled for HS2. The boreholes could also be added to the BGS database which is available to access online. These steps would ensure the data collected for HS2 would benefit society and leave a legacy.
Conclusions
A workflow has been developed that starts with AGS data input files and finishes with a 3D BIM environment containing geological surfaces and borehole information. The workflow requires minimal manual input at each stage because both the geological model (created in Leapfrog) and the 3D boreholes (created in gINT Civil Tools Professional) are directly linked to the gINT geotechnical database. The geological model is updated automatically when new data becomes available by a set of user-defined rules that save time and allow more time for quality checking by the engineer/geologist.
The output of the workflow is a CAD file stored in a Common Data Environment (ProjectWise) that allows for digital traceability and internal baselining. The CAD file contains geological surfaces represented by meshes that define the interface surface between strata. Boreholes are represented by a series of vertically stacked cylinder segments representing the different lithologies. Each borehole carries general information such as its name, northing and easting coordinates, its elevation, depth and its originator. The borehole segments are tagged with the borehole name, depth, bottom level, and geological description provided by the logging geologist. The
Several uses of the model have been described. These uses include:
- time (estimated to be 90 working days on this project) and therefore cost savings;
- the ability to easily highlight areas that require future ground investigation to resolve geological and geotechnical uncertainties;
- having a centralised source of information that is a ‘single source of truth’ and available to anyone working on the project with version control, easy access and notes describing the limitations of the model; and
- the more efficient transfer of geological understanding between disciplines.
There are many ways that the workflow and output could be developed in future. Additional detail could be added to the model by modelling the Lambeth Group sub-units individually, or by adding groundwater levels. Other possible developments include, using the model for automatic obstruction detection or for calculating volumes of each strata to be excavated during construction. The authors’ final suggestions for future development focus on the sharing of ground investigation data and ground models publicly to maximise the learning legacy of HS2.
Acknowledgements
The authors would like to thank Stuart Hardy (Project Geotechnical Manager) and Thomas Beales-Ferguson (Project Geotechnical Engineer) for their encouragement to begin to tackle the challenge of creating a 3D BIM Environment containing geological interpretation and for foreseeing it’s many uses.
The authors would also like to acknowledge Lourds Anthonypillai (Project Geologist) for her assistance quality checking the model.
References
| Reference Title | |
|---|---|
|
[1] |
“Government Construction Strategy,” HM Government Cabinet Office, May 2011. |
|
[2] | AGS, “AGS Data Format,” [Online]. [Accessed 02 07 2020]. |
|
[3] | SnakeGrid, “The SnakeGrid Solution,” UCL, [Online]. [Accessed 02 07 2020]. |
|
[4] | Environment Agency, “LIDAR Composite DTM 2019 – 1m,” Environment Agency, 20 May 2020. [Online]. [Accessed 18 10 2020]. |
|
[5] |
C. King, The stratigraphy of the London Clay and associated deposits., 1981. |
|
[6] |
Seequent, “User Manual for Leapfrog Geo version 4.5,” 2019. |
|
[7] |
C. Ting, B. Gilson and M. Black, “Developing the 3D geological model for Crossrail 2, London,” Quarterly Journal of Engineering Geology, 2020. |
|
[8] |
H. Burke, S. Williamson, S. Thorpe, J. Ford and R. Terrington, “The London Basin superficial and bedrock LithoFrame 50 Model,” British Geological Survey Open Report, OR/14/029, 2014. |
Peer review
- Sarah TrinderLead Geotechnical Engineer, HS2 Ltd (EDP Jacobs)
- Alex HulstonCAD Specification Manager, HS2 Ltd