Innovative approach to CDM coordination
With High Speed Two (HS2) construction works and all the associated enabling and utility works requiring many organisations to coordinate their work activity teams at hundreds of locations, the HS2 project gave the perfect opportunity to improve collaboration and planning of works with a web based Geographic Information Systems (GIS) linked to a work activity database.
A bold step was taken by the Enabling Works Contractor responsible for the northern section of the Phase One route to “ban and bin” the spread sheets used by many to plan and coordinate works and move to “real time” single data source for work activity planning aided by clear visuals showing in calendars and GIS mapping for current and future works.
The initial benefits of connecting the HS2 land database information directly into the same data base platform for works planning with a user-friendly set of preconfigured map view options in GIS immediately halved the time the planning and coordination meetings took.
Unresolved activity clashes, by set dates reduced by over 75% with unresolved clashed assigned clear action leaders. Furthermore, any work team in any location, had access on their phones or handheld devices to see the same, real time information and contact details for work teams and the land status details to confirm authority to access land was in place.
Using web-based systems enabled all the interfacing organisations to directly input and view works, plan to avoid clashes and join coordination meetings via Microsoft TEAMS.
As COVID-19 lockdown restrictions came in, all CDM meetings were held online without any disruption to the effectiveness of the meetings due to proven systems and protocols.

Background and industry context
With the extensive scope and scale involved in the construction of High Speed Two (HS2) over many kilometres, the challenge of effectively and efficiently coordinating the hundreds of work activities, thousands of surveys and many major construction and utility diversions was the ideal opportunity to go beyond what has previously been done and make best use of technology to provide robust and effective planning, management, monitoring and assurance for the work sites.
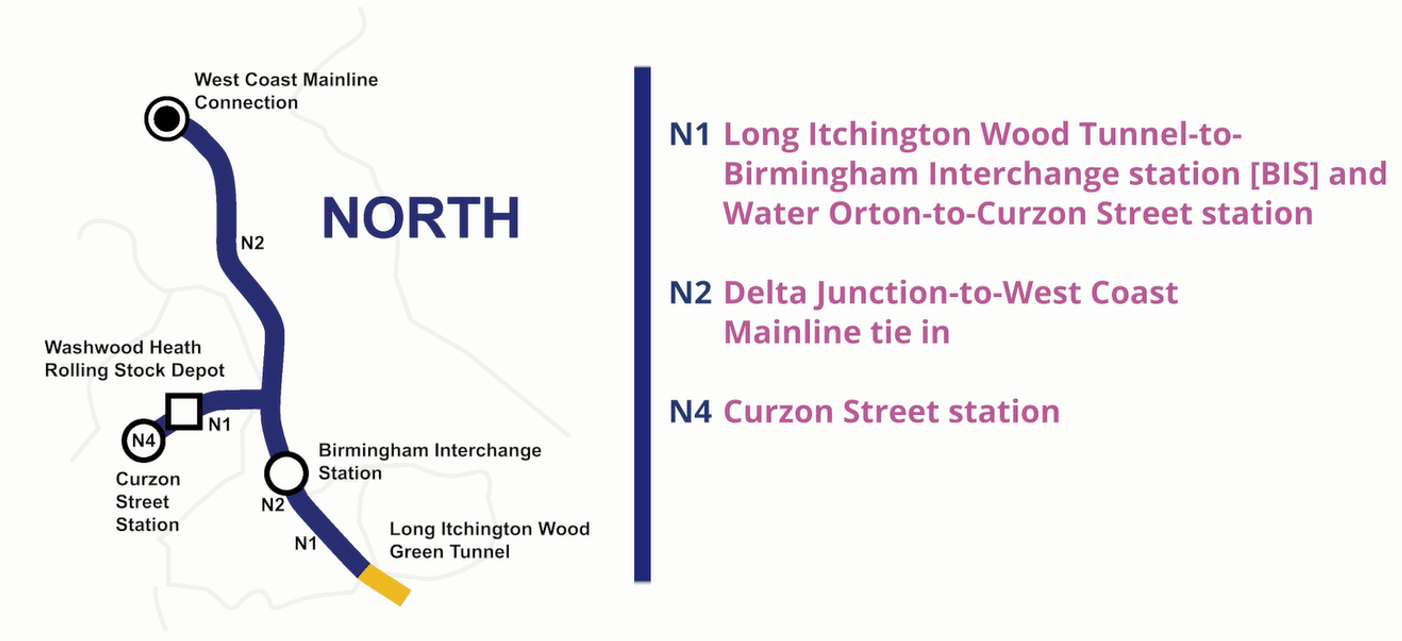
The Enabling Works Contract (EWC) on the northern section of High Speed Two (HS2) Phase One (also known as Area North) is delivered by the Laing O’Rourke Murphy joint venture (LMJV). LMJV was the first HS2 enabling works contractor on site, covering over 80Km of route, on over 2500 land parcels with many hundreds of work locations where works interfaced with multiple clients including HS2, Utilities, Highways, and Network Rail.
HS2 instructed LMJV to take the role of CDM principal coordinator for area north, develop further the LM Spatial GIS system and CDM coordination meetings to enable all the duty holders in area north to use and provide transferable knowledge for HS2 works to maintain and develop the use of GIS for effective and efficient coordination and collaboration as required by the Construction (Design and Management) Regulations 2015 (CDM) [1].
The Construction (Design and Management) Regulations 2015 requires “duty holders” as defined by the regulations, to cooperate and communicate with each other and to coordinating their work[1]. With HS2 being client and principal designer for the HS2 project works, appointing principal contractors for CDM notifiable work and appointing other organisations and contractors to undertake non CDM work associated with the HS2 works, to assist HS2 and other duty holders to coordinate works, HS2 established a land acquisition and boundaries process and supporting database and Geographical Information System (GIS), as used on other major linear projects.
The land database information and a GIS viewer system used on HS2 are in formats familiar to many who have worked on major projects based in offices, however the opportunities to format the database inputs and functionality of GIS viewers for front-line and site based operation teams and CDM work activity coordination was identified as an area to build upon and supported by HS2 for the current works and for knowledge share across industry.
Approach
The HS2 Supply Chain Health and Safety Approach states we are here to:
- Build a new high speed railway to better connect people across Britain.
- Achieve new standards in infrastructure delivery
- Finding innovative solutions to key health and safety risks
- Building on our experiences, learning lessons and continually making improvements
- Together, develop new standards in health and safety that will create a lasting legacy for the rail and construction industry and future infrastructure projects.
As the enabling works commenced on the ground in 2017 and the number of live sites and survey activity locations increased, so did the finalising of locations of utility diversions and other permanent work locations.
It became apparent that the established industry norm of huge planning meetings with the use of “smart boards” for sketch ups of potential clashes raised by all the participants (Figure 2) and the meeting outputs of rows of spread sheets updated with thousands of columns and rows was very soon going to be overwhelmed by the sheer volume of data and speed needed to identify, review, accept or avoid clashed of work activities.
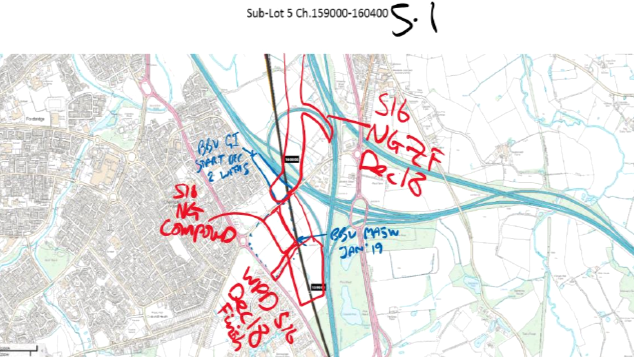
Although smart boards were a step forward in capturing images of sketches, they were not interactive and required many cross references to land data and work activities listed on multiple spread sheets, many of which did not line up in time and boundary locations, leading to further ambiguity as to who was in control of any location or who could be contacted if a work activity was to overlap with another.
The aim of keeping as many work teams separated in time and / or place to remove and reduce work hazards and enable the most efficient ways of working would be lost if a new and more efficient way was not found.
To give further a sense of scale, for area north alone, the HS2 works covered;
- over 80Km of work sites on over 2500 Land Acquisition Parcels LAPs
- each LAP where works or a survey was to take place needed to be approved
- not all works fall under the construction regulations / CDM
- many works in close proximity by multiple clients – HS2, Utilities, Highways……
- multiple principal contractors
- emerging scope
- constant change as designs develop
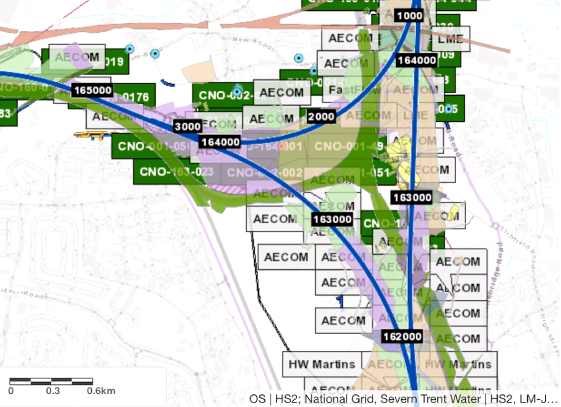
As various layers of information relating to work areas became available and entered in the GIS viewer it became apparent just how many stakeholders and communities would be interacting with each other. Figure 3 shows a screenshot of the GIS Viewer. Each text box or coloured shape details an organisation with intended work in the location. The closer the GIS viewer was zoomed, the more intense the work activities appeared.
Mid 2018 the EWC North project director called a multifunctional team together in a “discovery session” to look at how works were being planned and managed currently and define the next steps to improve. Although a land database and GIS viewer system was in use, it had limited uptake and many people relied on spread sheets as “their version of the truth” for works planning. In reality, there was a mass of the spread sheets, version control was difficult with multiple versions and many did not line up with each other and gave many huge headaches. Late 2018 the project director laid down the challenge, “within six months ban the use of spread sheets for any work activity planning and coordination”.
This was the catalyst to developing the land database and GIS systems and within six months, a time enabled GIS viewer system was up and running to view work activities logged into a single database and in use at the area north CDM clash resolution meetings.
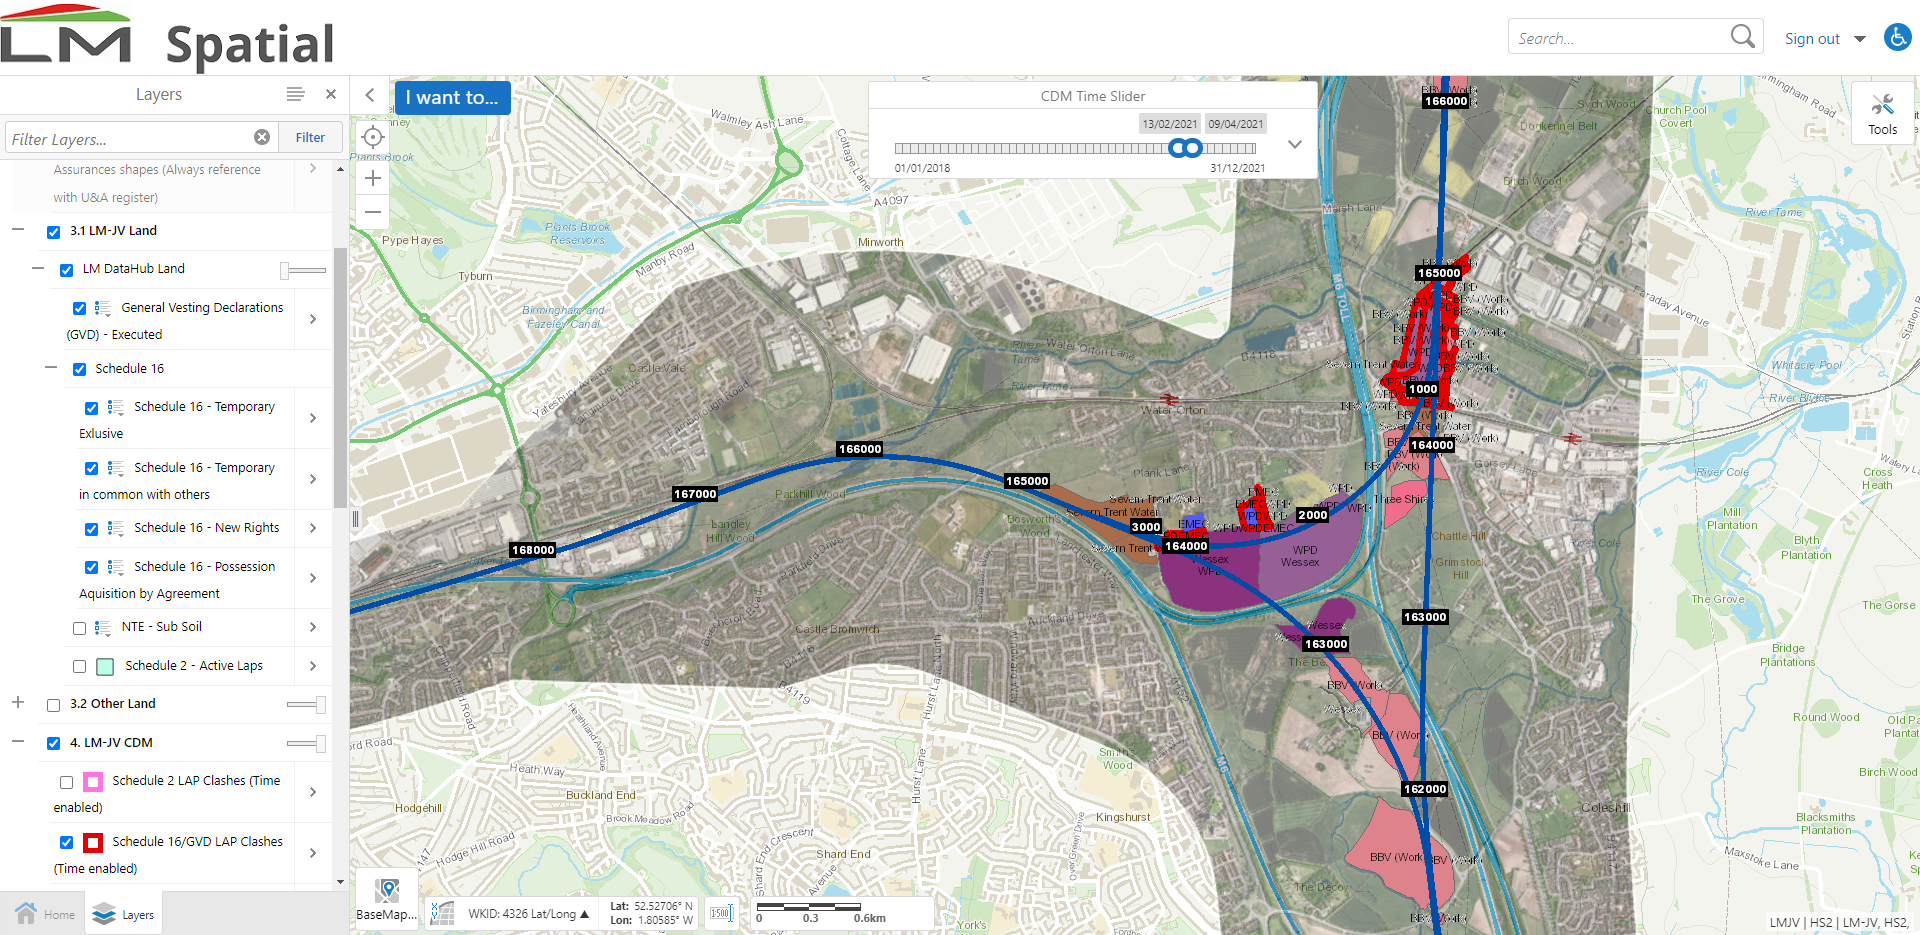
Figure 4 shows the Spatial GIS Viewer. User selectable layers shown on the left include clear and simple pre-configured layers for; land details, CDM clashes (red), contractor names and contact details, multiple map formats all sitting below HS2 line of route in blue. Topping the screen is the CDM time slider – setting a start and end date will show only activities and clashes that occur within that window. This is one of the most significant tools provided by the system.
Lessons learned and successes
Systems alone do not give success. Engagement and appreciation of all who design, develop and use the systems must be noted and communicated regularly, with support to new users to enable them to gain access and benefit from the functionality of the system.
To do this a number of levels and steps were identified to develop systems and meeting protocols rapidly.
Ensure there are champions and deputies for maintaining the systems and chairing meetings, so that in the event of IT glitches or the chair of the meeting not being available there is always a contingency plan.
In taking a six month leap from spread sheets to on line / web / cloud based systems the following levels and steps were laid out and achieved.
Levels -the goals (All to be in operation within 6 months. This set the “burning deck”)
Strategy – in this case area wide coordination
Tactical – linking the existing people and data
Operational – the benefit for those who plan, do and view,
Steps – the enablers
Define a few champions to keep the pulse and pace
This is just the starting team, who can call on the subject matter experts for systems, IT, legal, delivery and commercial. This team drafted the outline strategic, tactical and operational goals.
Learning point: This team do not have all the answers. They are the “fire starters” that have a level of authority to call in resources. Attendance at very short weekly update meetings must be mandatory. Make and deliver on commitments, be brief, bright and get on with it. Some may join the development team of subject matter experts, but are accountable for the weekly update, progress and deliverables.
Form, explain and explore meeting
When the subject matter experts are identified, draw a launch meeting with them and the champions and explain the reasons why this development is so important. Not just a nice to have but a legal duty under CDM plan / manage / monitor / coordinate. In short; Who, What, When, Where… Today, tomorrow and way ahead.
Learning point: Not everyone will agree with a scope of what needs to be included. Some managers will be solely focused on “the contract” and not see their statutory duties under CDM. The next step of “explore” is where additional training or information can be presented to give collective insights. This meeting needs time and facilitators to enable discovery in the view of the collective team. Look at what is working well, what is missing and what is needed to achieve or support the goals for coordination.
Discovery meeting
This came the week after the form, explain and explore meeting and was when the subject matter experts presented what was currently best practice and more detailed steps to go beyond what was previously thought possible.
- Learning point: at this point there has to be courage by the leadership and commercial team for calling in additional resources to plant the seed to get growth and return. An example being the director made a commitment to asking for another GIS expert… it was not fully known exactly what that specialist could do but it was recognised that this extra capacity and potential innovator was needed for speed of development and resilience. This was a huge step forward, was approved very quickly and proved to be a great enabler.
- Learning point: note the way different people have different data preferences and needs. Some like lists, tables and reports, Others interact with more visual methods. Develop the systems to support as wide a group of functional needs as possible and explain why some requests cannot be accommodated. This might be due to base system configuration limits. Some early report outputs crashed the databases due to the huge volume of land data that could be selected over a large time scale. Users became frustrated until the parameters were refined and locked down to what was really needed, then the systems became fast again.
Launch the new way of CDM coordination
Supported by the leadership and their line managers, two colleagues committed a set proportion of their time away from their other duties to deliver the initial introduction sessions and training on procedures, guide notes and then to hold “open surgery” Q&A and further training sessions after every CDM clash resolution meeting held every 2 weeks and to be the point of contact in the periods between. Outputs of the meetings in GIS map snapshots with short notes and defined action leaders enabled local teams to focus on areas where follow up action is required to avoid being carried over to the next meeting.
Learning point: For these two colleagues setting this time aside and being the visible points of contact ensured new users or existing users who had questions or ideas could raise them directly and have consistent support or feedback as needed. One of the early commitments was to always hold the meeting at the same time and whatever the challenges or holiday impacts, always have deputies to chair the meetings and deliver the coaching and support service. This continuity and support enabled a rapid uptake of the systems and made savings in other meetings or people not sure who to contact with a query. Some organisations have limitations on downloading apps or programmes, but these web-based systems did not present blockers and enabled them to interact directly.
Keep refining the inputs and outputs based on delivery requirements
Make the system data input as simple as possible and more reliable than a spread sheet, make life easier for the many doing the work before designing reports for the few who assure the works.
Learning point: The aim of the data entry database must be simple, accessible, reliable and recoverable for those inputting data. Make sure this new way of capturing the records is easier and gives access to more benefits than the previous methods.
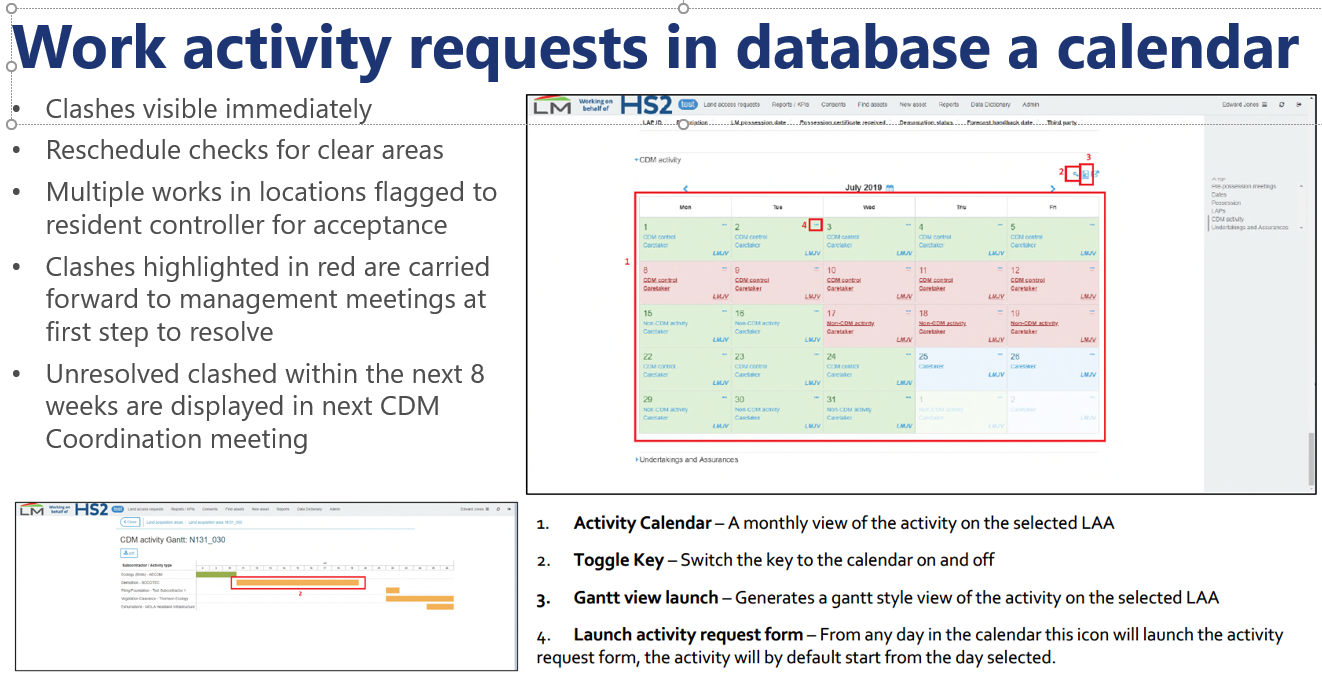
For CDM activity coordination, the ability to enter planned works against a trusted database of land records which then displayed in a calendar with potential activity clashes immediately visible enabled inputters to select other dates immediately to avoid work clashes. This made work planning and clash avoidance at the earliest opportunity possible, without having to attend meetings. Only where a clash could not be avoided, does it have to be raised at existing management meetings, and if still unresolved within the two week window between the CDM coordination meetings it then is visible on the GIS map as a “red clash” to be allocated action leaders at a higher level. Figure 6 shows the Land Access Request and Management System – a database of land status, work activity logs, accepted work overlaps (clashes) and contact details for work teams. The development and introduction of this “clash calendar” has been one of the most significant functions to enable over 500 work activities and surveys to be scheduled each week and reduced the unresolved clashes brought to a higher level every two weeks by 75% and more than halved the administration and time taken to log works.
Recommendations
Where there is a need for extensive collaboration for coordination for CDM or non CDM activities, the use of master database or data hub is the foundation stone. This provides the consistency and data portal to feed into with the people, place and activity details.
It is in this platform where clash avoidance, standard activity reports and contact lists can be built to make it so valuable for the data inputters, that they would not want to go anywhere else to enter or check works or contacts. From this the database / data hub, the GIS mapping links can be made in formats clear and simple for use on hand held devices.
When starting to develop an approach like this, remember it is a bit like the space race to the moon. A commitment was made, no one knew at that point all the steps needed, but with engaged and passionate people working together and recognising the value that each and every one can bring to the process, it is possible to achieve beyond what was previously thought possible.
The following points helped this team achieve our moon mission;
- Work out the number, duration and intensity of interfaces. Visual hot spots on a map or plan helps this evaluation
- In developing the database and GIS viewer, take time for discovery –
Look for what works well for the delivery teams first, then for the assurance and reporting - Pair the GIS specialist with a delivery leader
- Create a regular time and place to reflect upon discovery, suggestions and actions
- Identify the duplications or overlaps and remove or thin them
- Set up your activity coordination meetings to a regular pulse
- Do NOT cancel any meetings
- Build in resilience in coordination meeting team, with multiple deputies
- Roll out the strategy with visuals to act as “anchor points” for when refresher briefings are made
- Measure and show the savings (e.g. saving in time and clashes)
- Keep partners involved and dedicate clear points of contact and systems champions
- Recognise and thank all involved on a regular basis and let them know how their contribution or ideas are developing
- Recognise that relentless refinement is needed and have resilience to face the unknown unknowns when they do become apparent.
- Be bold in commitment to resources at the start and to also explain when system limitations make some requests for development currently not possible…but keep seeking solutions.
- And finally, again, thank all involved on a regular basis and let them know how their contribution to data input, systems development and use of the systems helps the project achieve great outputs and safe and well coordinated works.
Acknowledgements
This was a team achievement, from development to deployment. It involves multiple organisations, who through their participation in development and use of the systems have each helped to define and refine the systems and processes. Every user of LARMS and the LM Spatial is worthy of acknowledgement.
References
[1] The Construction (Design and Management) Regulations 2015