Innovative ground data management
Engineering geologists and geotechnical engineers need the right tools to efficiently investigate, analyse, model and share their geological understanding of expected ground conditions with the wider project team as and when new data becomes available. National large-scale infrastructure projects like High Speed Two (HS2) provide significant technical ground and engineering design challenges but they are complicated by the large multi-disciplinary teams working across many offices, companies, time zones, with a variety of stakeholders. On such projects keeping an auditable and detailed record of all the data and models becomes difficult and at times, incredibly protracted and cumbersome particularly where there are numerous ongoing ground investigations producing constantly evolving datasets. This highlights the challenge and need for teams to effectively communicate changes in ground investigation (GI) data and other outputs with key stakeholders in near “real-time”, allowing risks and opportunities to be characterised and value engineering exercises to be undertaken.
This paper describes the innovative application of several software packages to systematically manage GI data and ground models through successive design stages. It will showcase the use of 4D ground modelling complemented by in-house Python coding and bespoke apps to support the wider GI data management vision on the project. These digital innovations enabled the team to produce higher quality ‘BIM’ deliverables, communicate more clearly and expediently with stakeholders and deliver controlled and robust ground models in 4D. The innovations also enabled the onsite GI team to adapt the GI on site to the best advantage of the project according to the ground conditions encountered. The ability to integrate, dynamically link, share, manage, track, and audit models in one eco-system has brought many benefits including time and cost savings, and risk reduction. These digital innovations have benefited HS2 Phase One in scheme design and will continue to provide that into detailed design, construction and operation of the railway. The benefits will also be felt beyond HS2 to any future infrastructure project where the collection, processing and interpretation of ground data is undertaken.
- Written by
-
Jonny Neville (Mott MacDonald/BBV)

-
Peter Fair (Mott MacDonald/BBV)

-
Luke Belton (Mott MacDonald/BBV)

-
Christopher Brook (Mott MacDonald/BBV)

- Resource type
- Resource type: Technical Paper
- Tags
- 4D ground modelling posts
- dashboard posts
- Data Management posts
- digital posts
- geological digital twin posts
- geotechnical lifecycle posts
- ground investigation posts
Introduction
This paper is presented as part of the works to deliver the northern section of High Speed Two (HS2) Phase One – Lots N1 and N2 (Area North) including Long Itchington Wood Green Tunnel to Delta Junction and Birmingham Spur and the Delta Junction to the West Coast Main Line (WCML) tie-in, being delivered by the BBV Integrated Project Team (IPT).
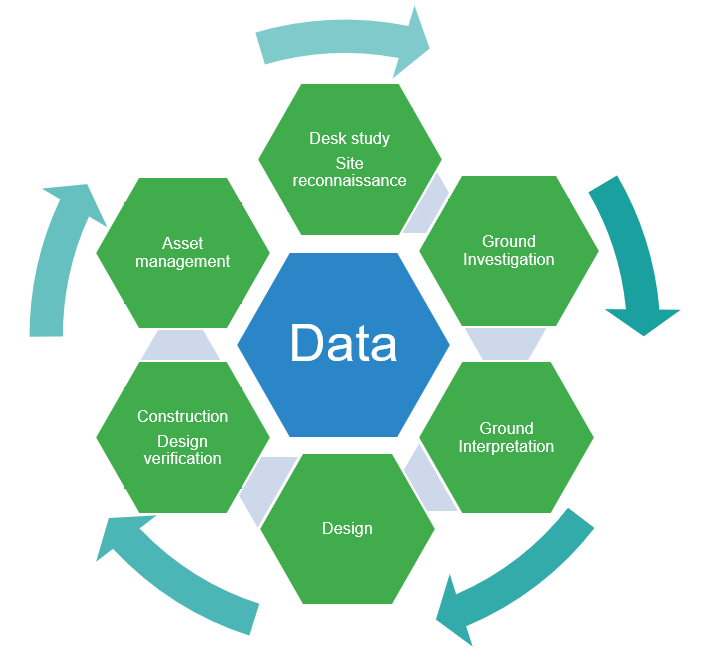
Ensuring ground data is appropriately captured, checked, processed and seamlessly transferred through each stage of the geotechnical life cycle (Figure 1) is a challenge for any infrastructure project. HS2 is no different.
The key additional challenges faced on N1N2 have been:
- The scale of the project (over 100 mainline assets across the 90km N1N2 route with over 5,500 exploratory holes drilled to date, and a further 2000 proposed in the next ~18 months);
- Large multi-disciplinary teams working across many offices, companies and time zones;
- Multiple phases of Ground Investigation (GI) undertaken by different contractors (24 separate contracts for HS2 Phase One Framework GI for N1N2 in addition to BBV, the Early Works Contractor (EWC) and third-party GI);
- Simultaneous ground investigation and design with assets split across different design phases (i.e. scheme and detailed design).
To meet these challenges, a series of geotechnical information management processes, in‑house applications and third-party software have been developed and utilised on N1N2. This includes:
- an integrated ground investigation team across the IPT;
- a defined data management strategy for ground data;
- development of a ground investigation reporting dashboard; and
- 4D ground data modelling and geological modelling.
These have enabled the N1N2 BBV IPT team to maximise the value of ground data during ground investigation and design phases and beyond into construction and asset management. A key benefit is that it has also facilitated better communication of ground risks and opportunities to stakeholders and particularly non-technical specialists.
Integrated Ground Investigation Team
The IPT approach adopted for N1N2 has supported the creation of an integrated ground investigation team formed of members from across BBV IPT including the BBV Main Works Civils Contractor (MWCC) and the Design Joint Venture (DJV).
This has enabled the team to:
- draw upon the skills and expertise across both BBV MWCC and DJV while avoiding unnecessary duplication of roles;
- develop an IPT-aligned GI delivery strategy (including data management) and tools to support validation, processing and visualisation of GI data across BBV IPT;
- provide a better connection between the ground investigation and design removing barriers to the flow of data.
Data management
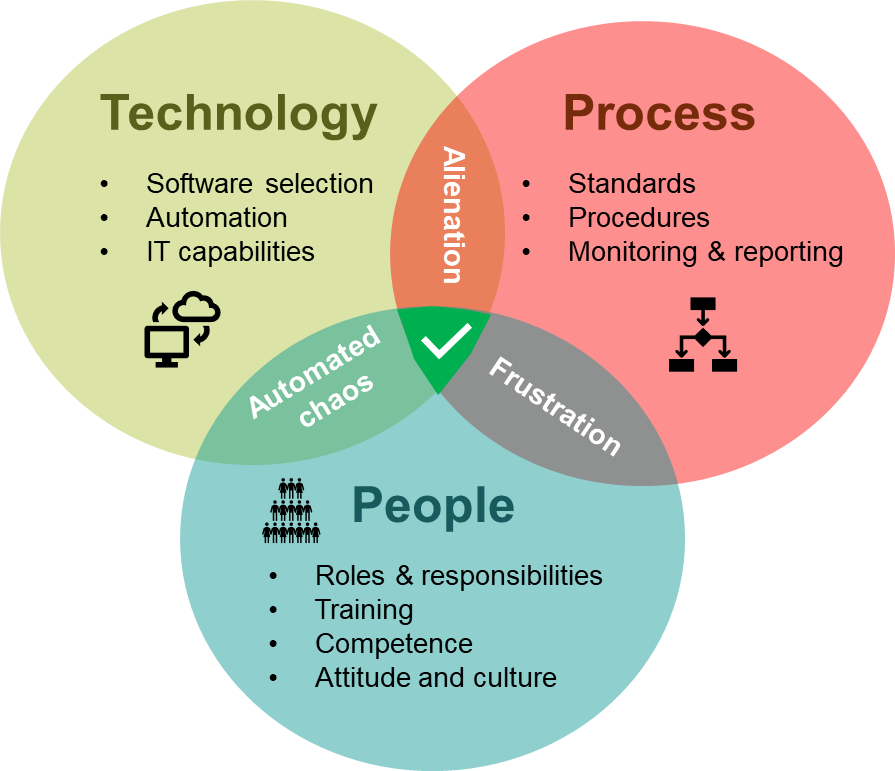
The data management strategy for ground data on N1N2 is centred around people, processes and technology (Figure 2). Crucially, none of these components have been considered in isolation, to avoid potential alienation, frustration or ‘automated chaos’ and get the right balance.
A project-specific ground investigation data management plan was created from the outset to map out how ground investigation data is obtained, reviewed, validated, processed, analysed and transferred between each stage of the geotechnical lifecycle, and the responsible parties involved at each step.
This approach has enabled:
- consistency in the validation, processing and analysis of ground data across multi-disciplinary teams working across multiple offices across the world;
- clear definition of roles and responsibilities for ground data;
- identification of industry software, applications and tools suitable to undertake defined tasks (e.g. HoleBASE SI, GiGi and Leapfrog);
- development of in-house tools where industry products are not available or suitable (e.g. the N1N2 Ground Investigation Dashboard);
- roll out of appropriate training and documentation across the IPT.
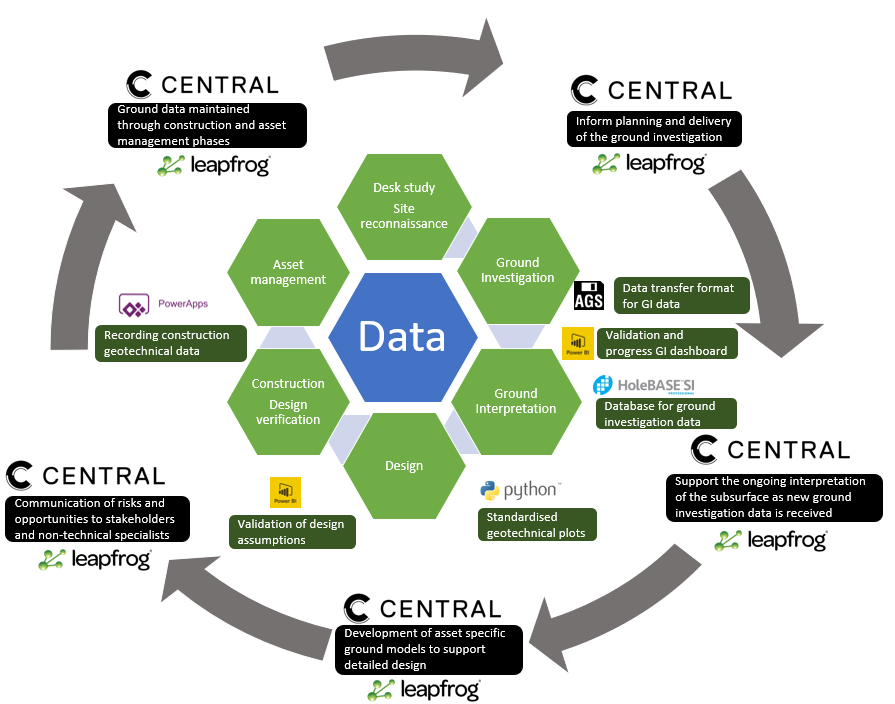
A summary of the software and tools identified and how they fit into the geotechnical lifecycle is presented in Figure 3.
Data structure
It is crucial that ground investigation data is appropriately structured to obtain the ‘maximum’ value of the data across the full geotechnical lifecycle. This is particularly important for HS2 where ‘time is of the essence’ and there is overlap between the ‘just in time’ ground investigation and staggered design phases.
The HS2 Technical Standard – Geotechnical Data Management[1] and the industry standard AGS format[2] have provided a useful baseline for consistency in preparation, assurance and reporting of ground investigation data across all HS2 GI packages. However, these do not fully account for all variations in the interpretation of AGS reporting between contractors particularly non-AGS reported testing (e.g. advanced lab and geophysics). There must also be consideration of the end use of the data and the data structure requirements for software that the data may feed into (Figure 3).
To overcome these challenges the integrated GI team have championed transparency and open communication between BBV, DJV and GI contractors. This includes setting up GI data management meetings prior to mobilisation to ensure parties are aligned, understanding the challenges of the end user and any data management requirements are clearly defined and agreed (e.g. AGS field naming, conversions and units).
The AGS standard data format is prescriptive about data structure and provides suggested default values for ‘standard’ data groups and headings. This goes a long way towards smooth transfer of data between, for example, contractor and consultant provided that the format is properly adhered to. However, there is provision within the AGS format to adapt it to suit specific project requirements, including supplementing the format with additional data groups and headings. On a large-scale infrastructure project like HS2, this is crucial in order to capture the additional complexity and level of detail demanded.
Examples of AGS format modifications made by the DJV include:
- The addition of a ‘Preliminary Status’ AGS field in the LOCA group to allow each hole to be assigned an individual status to differentiate between various statuses prior to the AGS being assigned ‘draft’ status. This permits GI data to be shared with designers at the earliest opportunity, whilst capturing the limitations of the data and sharing this with all data users.
- The addition of a ‘Geology Code 3’ field to the GEOL group, to capture geological interpretations made by designers (e.g. refinement of ground model to formation level) and differentiate this from factual information provided by GI contractors in Geology Codes 1 and 2.
Ground investigation dashboard
Business Intelligence (BI) dashboard reporting in software such as Power BI and Tableau has seen considerable growth in recent years, traditionally applied to visually present business data in a highly interactive manner. There is a heavy emphasis on self-service data and empowering users to make data-informed decisions.
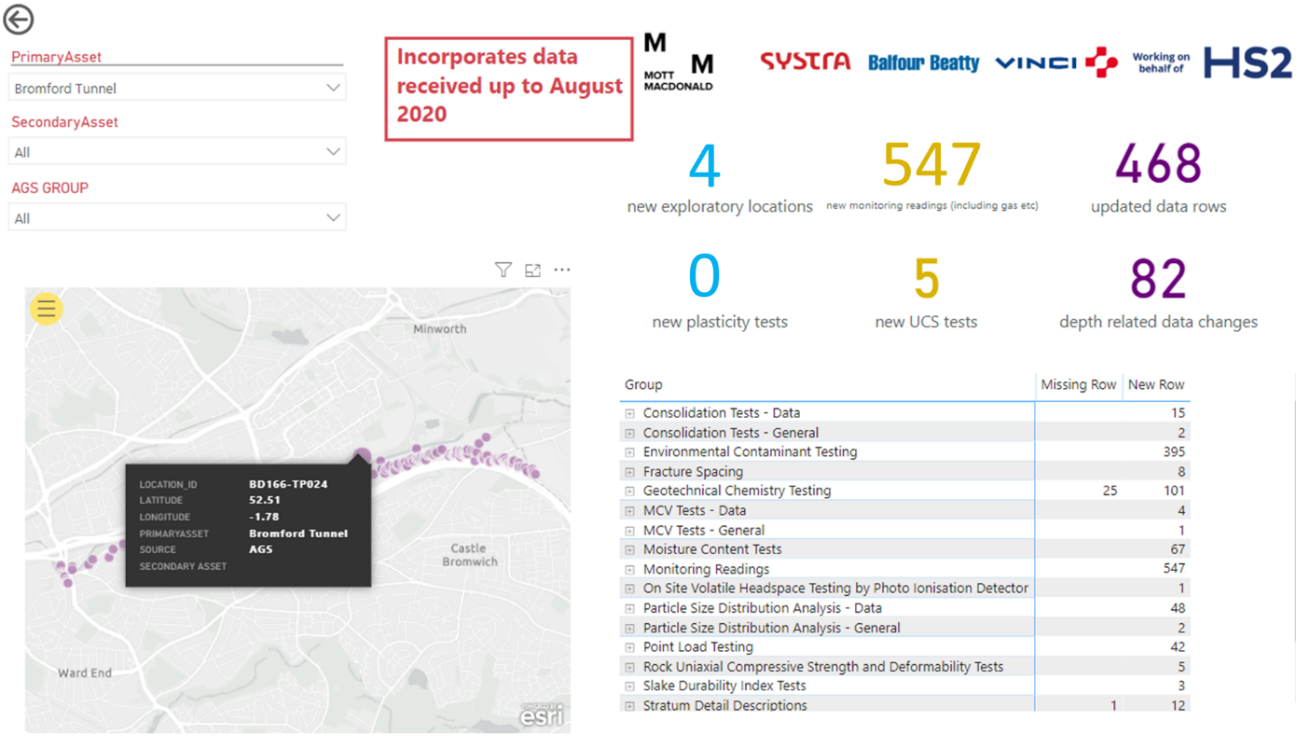
On N1N2 BI software has been used to great effect to provide engineering geologists, designers and managers with dashboard reporting of ground investigation data. Each month the dashboard has been updated to provide designers with an up-to-date view of the most recently received GI data from the multiple GI contracts across N1N2 (Figure 4). A combined approach to develop the dashboard included in house bespoke Python programs to read and compare the new AGS files with previous revisions and dashboard reporting of the output results in Power BI. The comparisons have been completed following a top-down approach, which is closely aligned to the AGS data format. By doing so, the output results provided the most granular view possible of the differences to the data each month. The approach and reported outputs are illustrated in Figure 5. Reported changes included differences between rows with shared key fields (e.g. a change to a geology description, or an alteration to a laboratory testing result) and ‘interval’ rows where two depth fields identify an interval (e.g. where a single interval in the GEOL Group has been split into two or more geologies or vice versa).
Using this approach, the dashboard provides GI data managers with all the tools that they need to critically evaluate the newly received data each month and allow them to make informed decisions to validate that data for project use. The comparison is fully automated and negates the need for manual comparison of the data between databases in existing industry software. This has decreased the margin for error by an estimated order of magnitude (when compared with manual comparison undertaken on previous projects), and substantially reduced the required time investment. The comparisons have critically, enabled designers to judge whether any of the newly received or edited data could have a significant impact on the design and in a fraction of the time, for example by changing the ground model or interpretation of the engineering behaviour of the ground, in which case further assessment would be required.

To enable the evaluations described above, the dashboard reports the data in a graphical and spatial manner, linking each borehole to a primary asset (i.e. mainline railway earthworks, tunnels, etc) and, where relevant, a secondary asset (such as a highway overbridge, culvert, etc). The dashboard has built in functionality to drilldown to specific assets and filter to AGS groups of interest. For example, a piled structure (e.g. a viaduct) may be particularly sensitive to rockhead level and therefore users could choose to filter to strength testing and geology description AGS groups to provide the required insight.
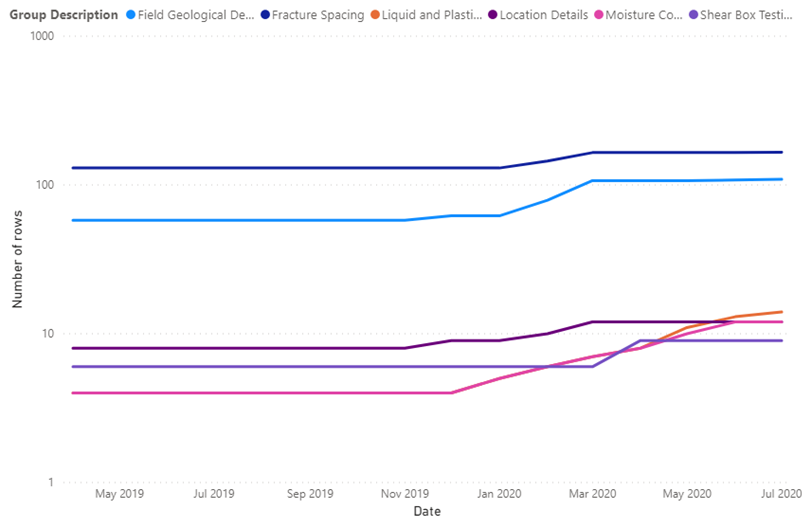
In addition, the Ground Investigation Dashboard shows the cumulative GI data received for each construction asset as it is added to each month (Figure 6), allowing designers to assess the information received between various data freezes for different phases of design. Using this approach has enabled much more rapid evaluation of whether significant reinterpretation of ground conditions would be required to account for newly received data with each design iteration. Not only has this decreased interpretation time, but it has also prevented manual data manipulation which may ultimately prove to be abortive when it was later discovered that little or no new data has been received. This process is ongoing and continues to deliver time savings on the project improving the ability to manage geotechnical risk and opportunity. Additionally, the dashboard is linked to the ground investigation schedule to allow tracking of exploratory holes that are still to be undertaken for each asset.
The focus described above places a heavy emphasis on self-service data (i.e.no specialist skills or resource required), automated data manipulation and reporting, and much more rapid delivery of data to end-users. This approach delivers the following benefits:
- minimises error-prone manual data manipulation;
- allows GI data managers, engineering geologists and designers to make informed decisions much more rapidly and more frequently;
- prevents unnecessary or abortive work exploring new data;
- enables designers to spend less time reviewing and manipulating data and more time interpreting ground conditions and refining designs. Ultimately this should lead to a better understanding of the ground and more design optimisation, which by extension should improve safety and deliver better value for stakeholders.
4D ground modelling
Creating 3D ground models has always been a fundamental part of engineering geology and was appropriately the topic of the first Glossop Lecture presented by Professor Peter Fookes[3]. With recent advances in computer power and analysis / modelling software it has never been easier to create a 3D ground model. However, in many cases this has resulted in a ‘rush’ to create 3D ground models without prior thought about the ‘added value’ that it is providing and a misconception that they carry ‘a higher degree of accuracy’ than traditional cross/long sections. (Note: the generic term ‘ground model’ and derivatives thereof includes factual data only models, geological models, geotechnical engineering models etc).
To avoid this on N1N2, a targeted ground modelling approach has been undertaken to achieve the following principal objectives:
- help inform the delivery of the ground investigation;
- support the ongoing interpretation of the subsurface as new ground investigation data is obtained (i.e. 4D);
- development of asset specific ground models to support detailed design, where deemed beneficial depending on the complexity and variation in the ground conditions;
- communication of risks and opportunities to stakeholders and non-technical specialists.
Central to accomplishing these objectives on N1N2 has been to develop a model management strategy with process, technology and people at the heart of it.
Model management strategy
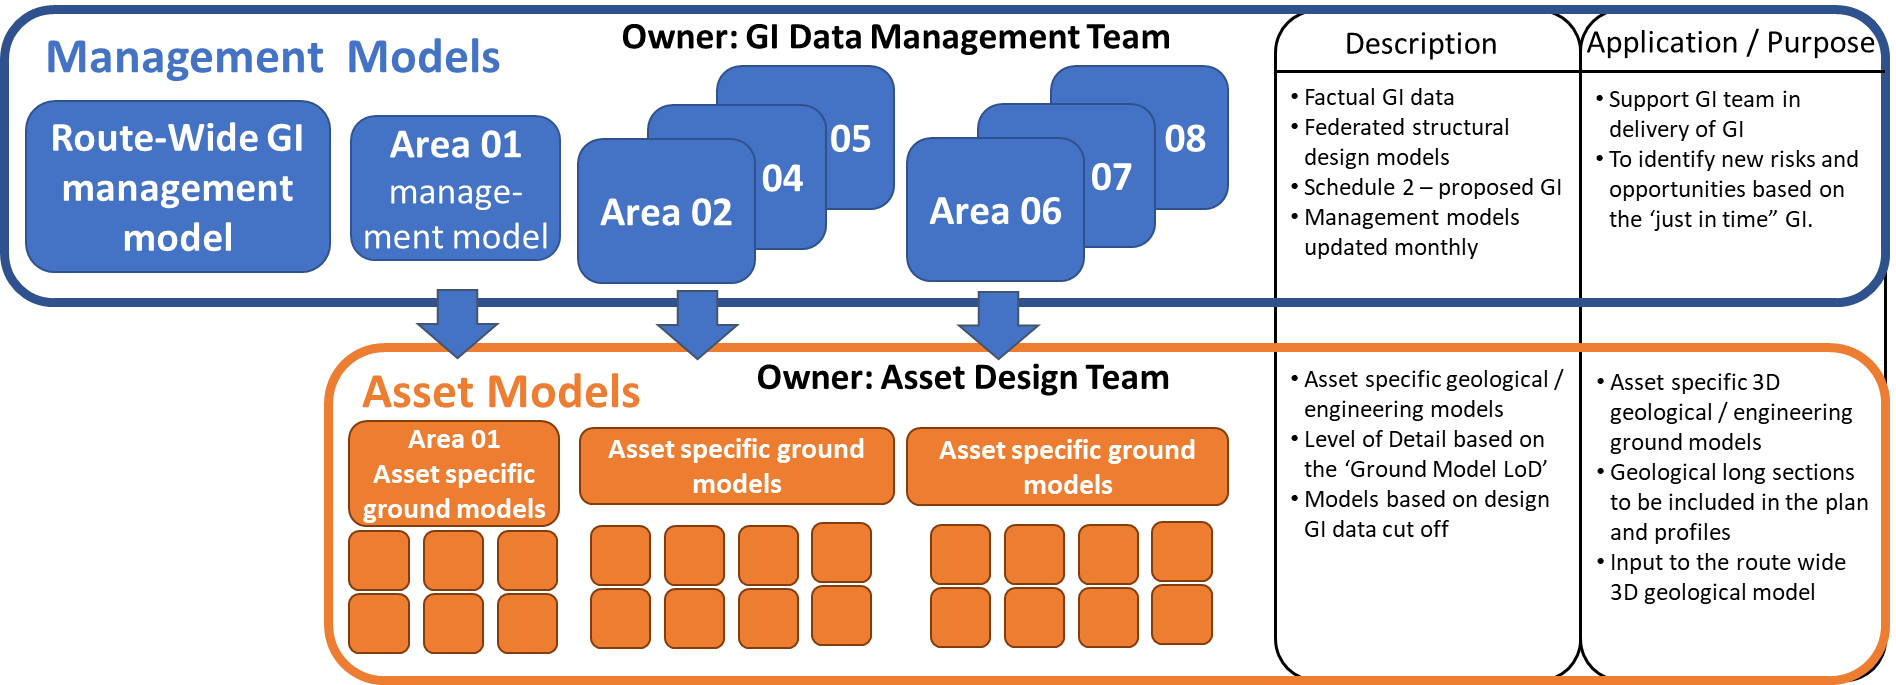
Engineering and geological complexity varies asset by asset, and with it the requirement for a detailed 3D ground model. For example, a ground model for a simple cutting in consistent geology requires a different approach to a deep excavation in highly variable and complex ground conditions. In recognition of this, the tiered ground modelling strategy outlined in Figure 7 has been adopted across N1N2.
The management models allow designers, site GI team and other key stakeholders the ability to visualise factual ground investigation data in 3D data alongside the design model for any of the ~350 mainline and secondary assets. The management models are produced and maintained by the DJV Ground Investigation Data Management Team and form part of the monthly ground investigation workflow. Validation of the incoming data into the models is an important step of this with the 3D environment adding an additional level of checking to compliment the traditional tools such as AGS checker. The management models sit alongside the more traditional tools for viewing data such as HOLEBASE SI.
Having just the GI and other base information, as provided by the management models, is enough for some assets, but many others will benefit from a detailed ground model (i.e. asset specific ground models). The management models act as the starting point of the asset specific ground models to ensure that there is consistency in the data that is used to create the detailed interpretative ground model. To determine whether an asset will benefit from an asset specific ground model, a ground modelling level of detail proforma has been produced. The level of detail score is based on the complexity of the engineering and ground conditions. Each asset is given a ‘Ground Model LoD’ score ranging from 5 to 0 (5 – highly complex ground model, to 0 – no 3D ground model required). This ensures that 3D ground modelling is only carried out to the required level of detail and only where it will add value.
The key challenges associated with the creation of asset specific ground models on N1N2 have been:
- keeping an audit trail of multiple ground model revisions and engineering/geological decisions that have informed the interpretation;
- ensuring models undergo appropriate checking and approval;
- preventing the unnecessary creation and duplication of ground models by multi-disciplinary design teams;
- awareness of interpretations made for adjacent assets.
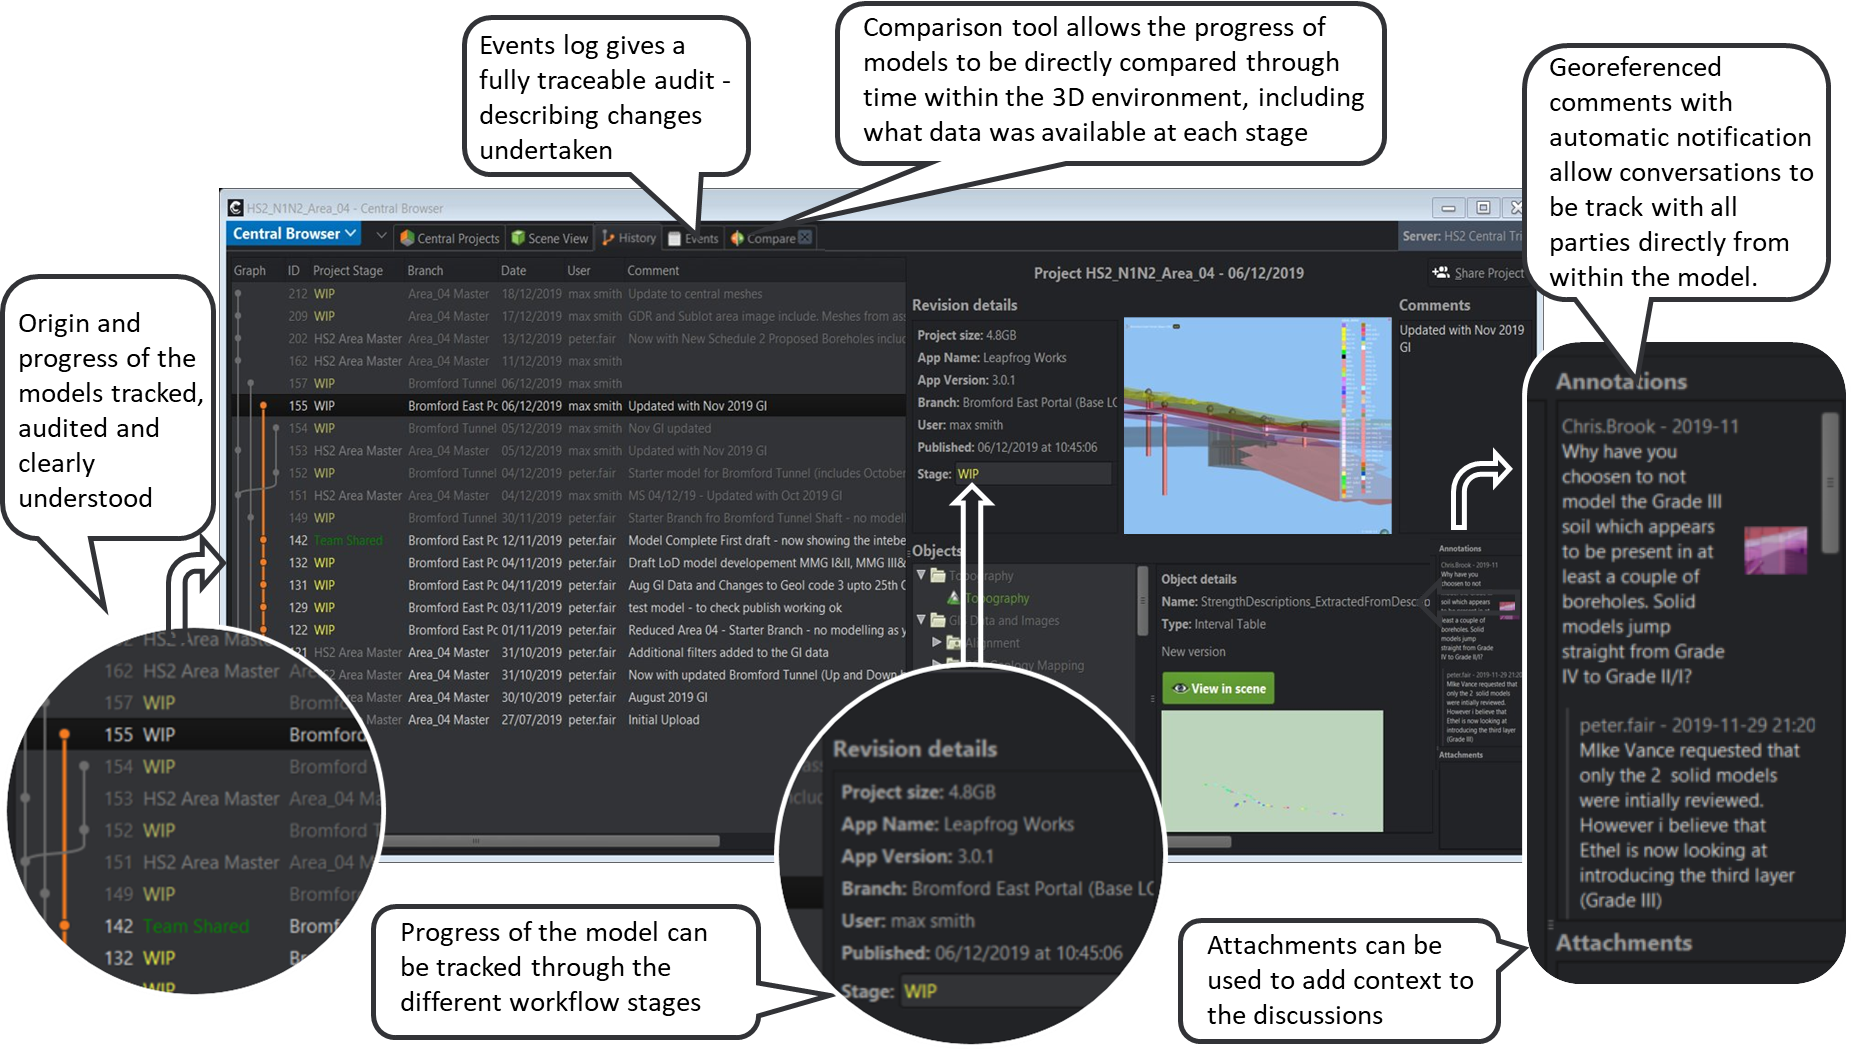
To help overcome these challenges Seequent’s cloud-based data and model management solution Central has been adopted. A screenshot of the Central interface and key functionality is presented in Figure 8. N1N2 is the first major infrastructure project in the UK to use a dedicated geological model management system that is intrinsically linked to the models.
In addition to addressing the above challenges, Central also provides the following key additional features to support model management strategy:
- annotation/comments functions to support the checking/approval process and wider communication between the IPT in the model environment;
- notification system to inform stakeholders of modelling activities within project;
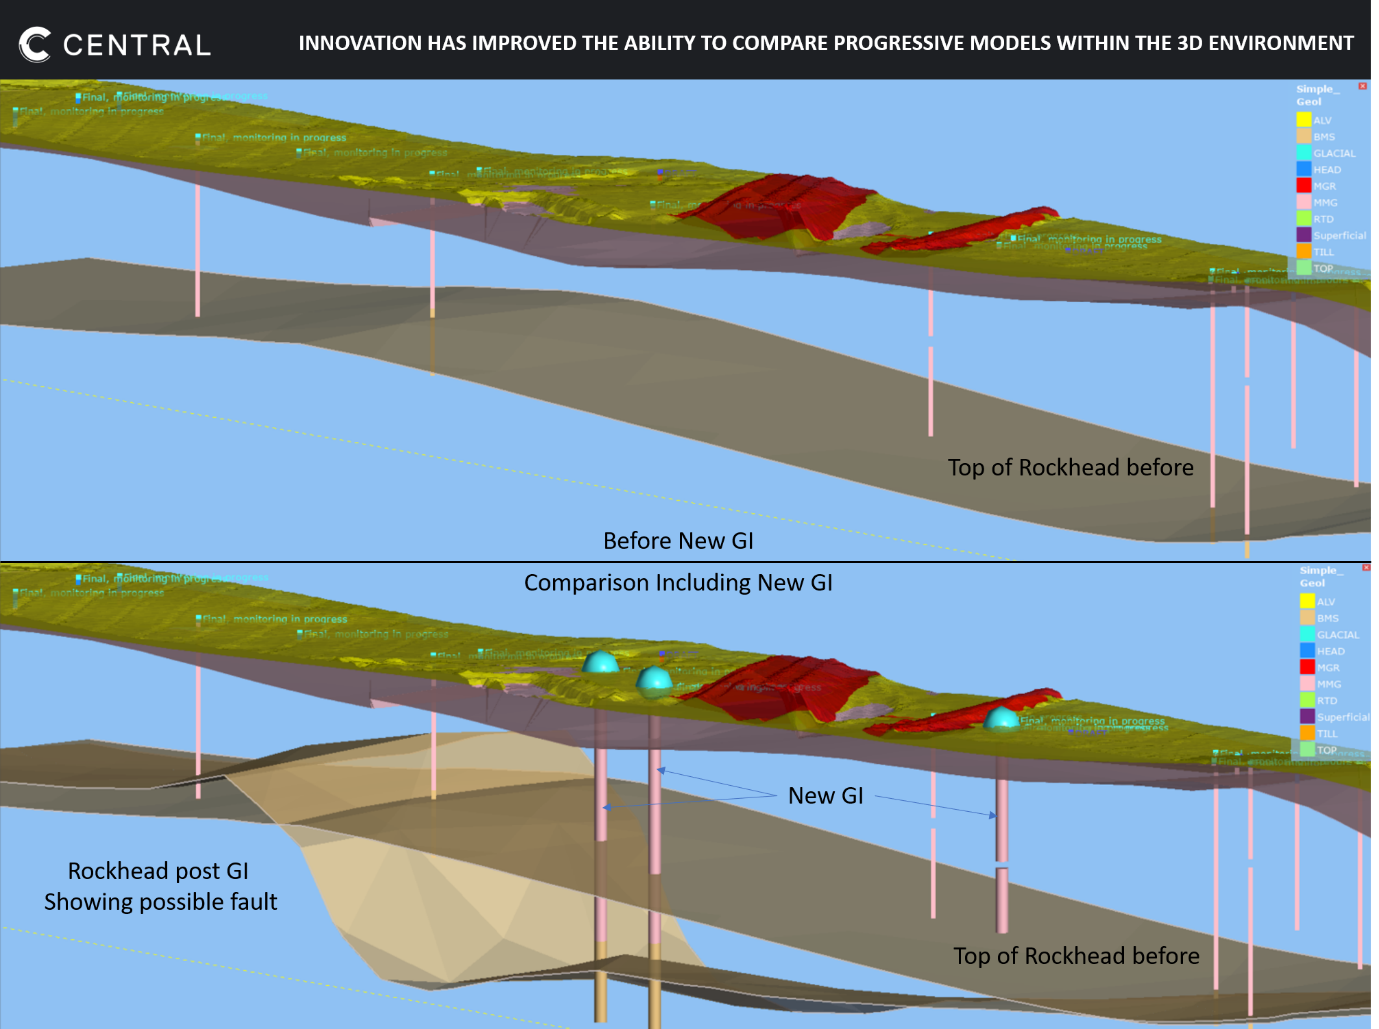
- compare tool to visualise changes between models (e.g. quickly identify new ground investigation data each month that can then be compared to the existing interpretation);
- linking the ‘Model Stage’ to the HS2 recognised ‘State’ in ProjectWise (the document control system used by the DJV) so that all users can understand the model state as it progresses from work in progress through checking and approval to team shared.
A 3D ground modelling guidance document (including general principles) has been produced to ensure consistency in the production of ground models across N1N2. A modelling report is also created for each asset specific ground model that outlines the inputs, interpretative decisions and outputs.
Supporting GI delivery
The best ground investigations are informed directly by design requirements and adapt as the design and understanding of ground conditions evolve. This is particularly important for HS2, where the ground investigation is occurring in parallel with design and the ground investigation must quickly adapt to changes in the design.
The monthly Route Wide Management Model, which sits aside the monthly BI dashboard and HOLEBASE SI database has enabled this on N1N2 by bringing together the latest BIM designs, existing and proposed exploratory holes and interpreted ground conditions in one place. Additionally, the user is signposted to the factual reports, borehole logs and core photos for existing data should they need to access it. This has better equipped the BBV GI team to make more informed ‘live’ decisions on site without trawling through design models, long sections and factual reports or contacting the designers.
Examples of where this has directly benefited the N1N2 ground investigation include:
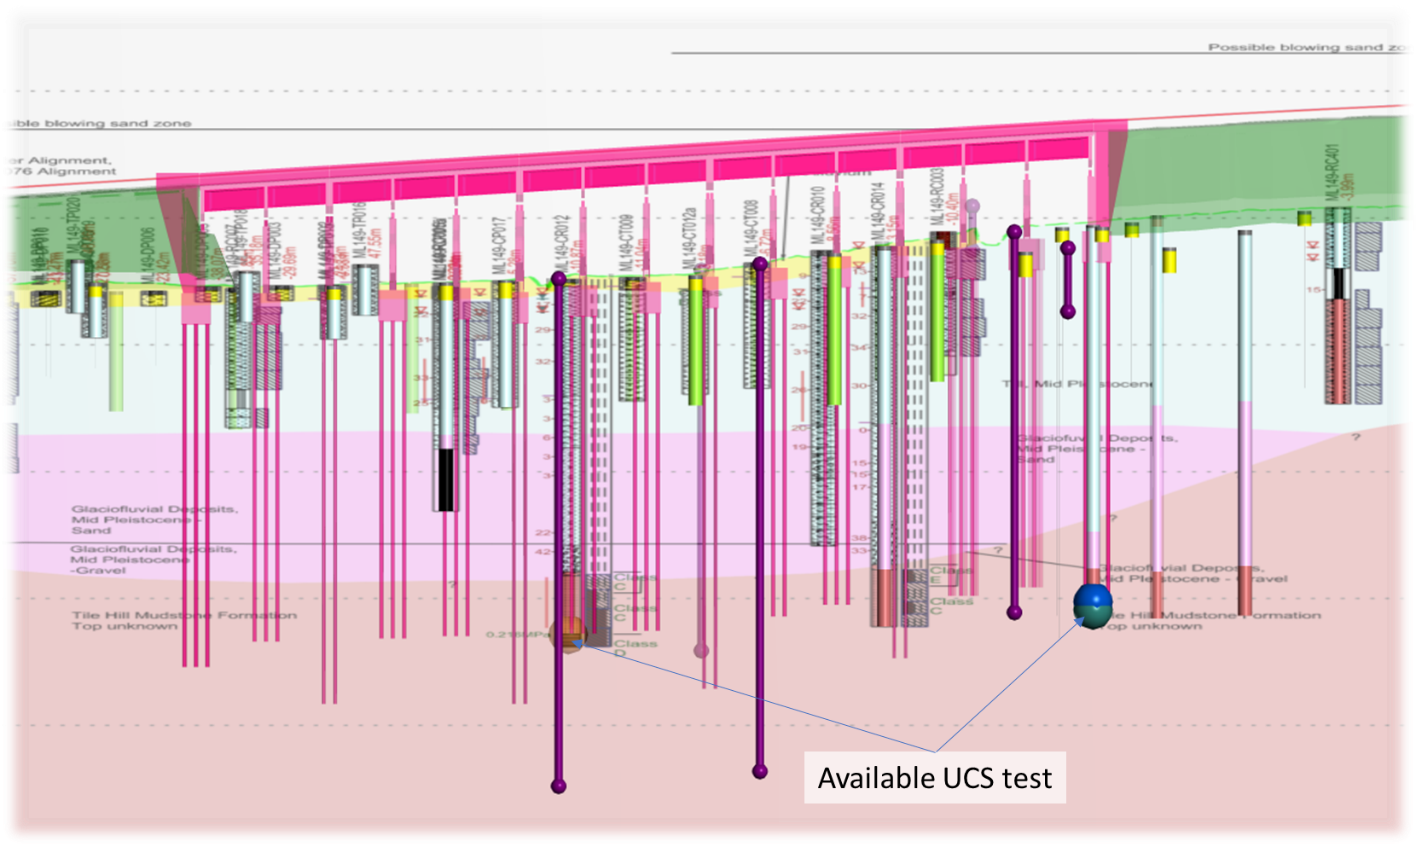
- targeted sampling and lab testing at proposed base depths of piles for deep foundations/rigid inclusions;
- reviewing field and lab data from existing locations to identify current data gaps or anomalies that the additional GI can target;
- understanding limitations in spatial distribution of certain types of data sets needed to support the design e.g. gaps in sulphate, compaction testing in cuttings;
- clash detection of casing lost during the ground investigation with proposed foundations and tunnel alignment at Beechwood Embankment and Long Itchington Wood Tunnel.
- Extending the termination depth of exploratory holes at Beechwood Embankment when a deeper glacial channel than anticipated was encountered avoiding potential need for re-drill. This ensured the depth to rockhead was proved and appropriate lab testing was undertaken to help inform the rigid inclusion ground improvement design.
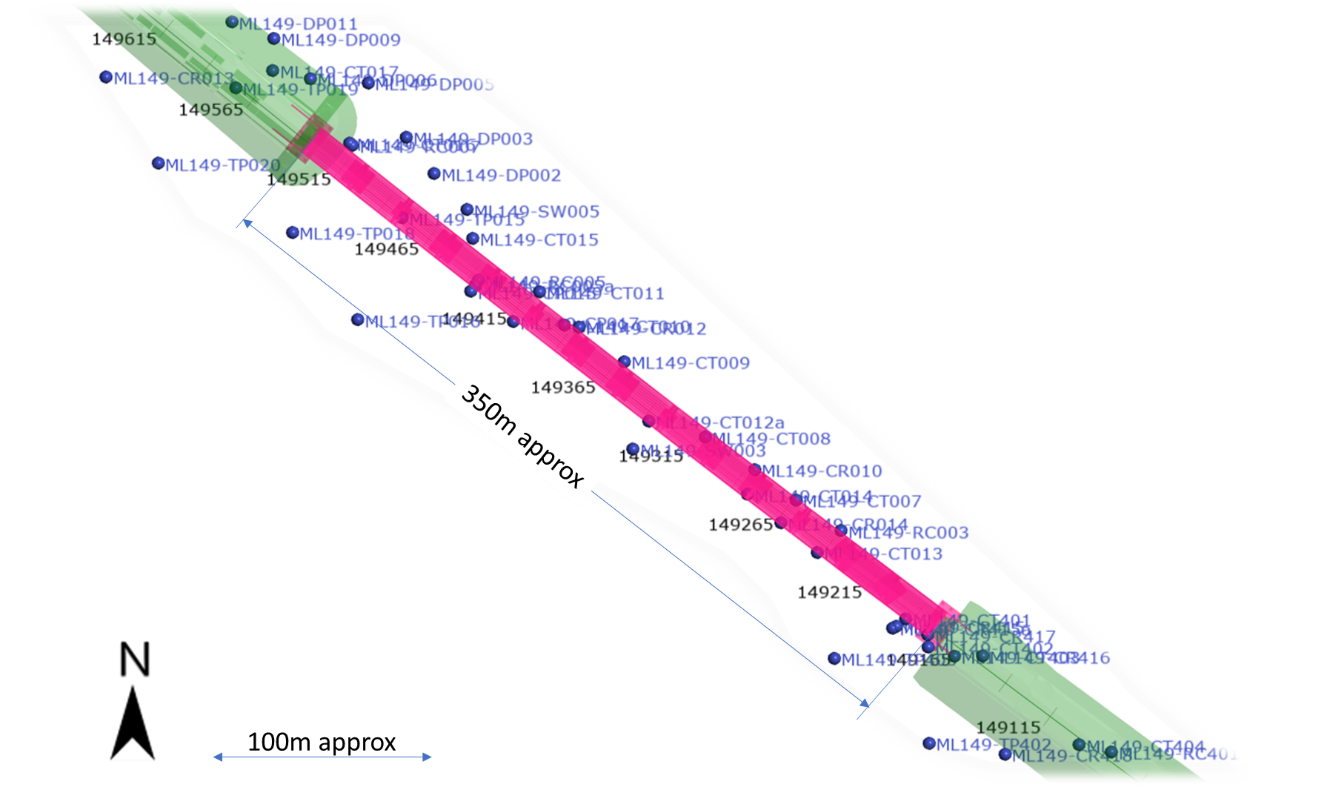
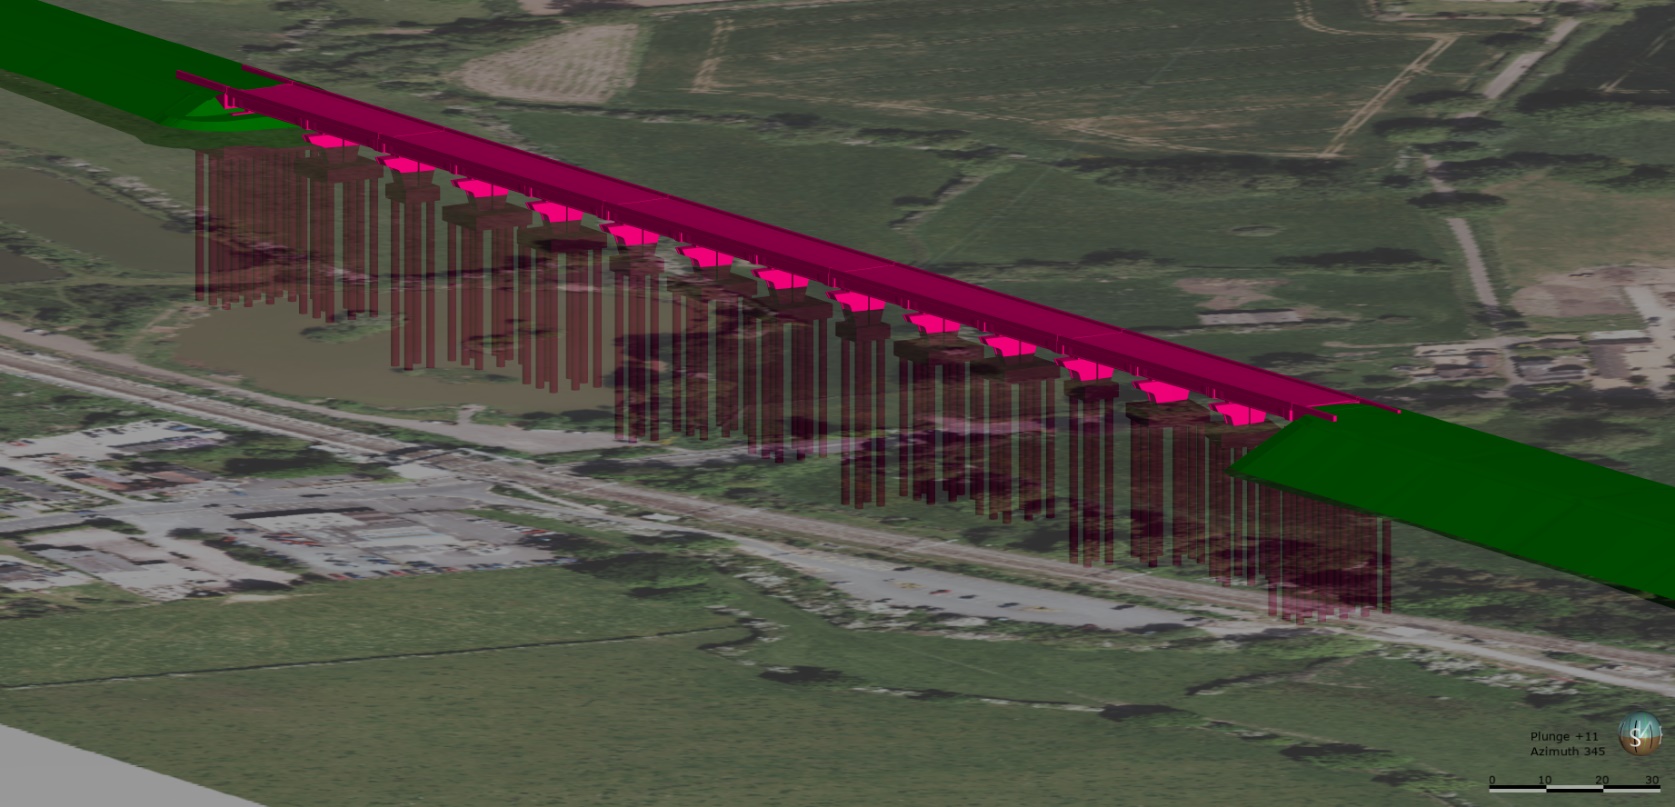
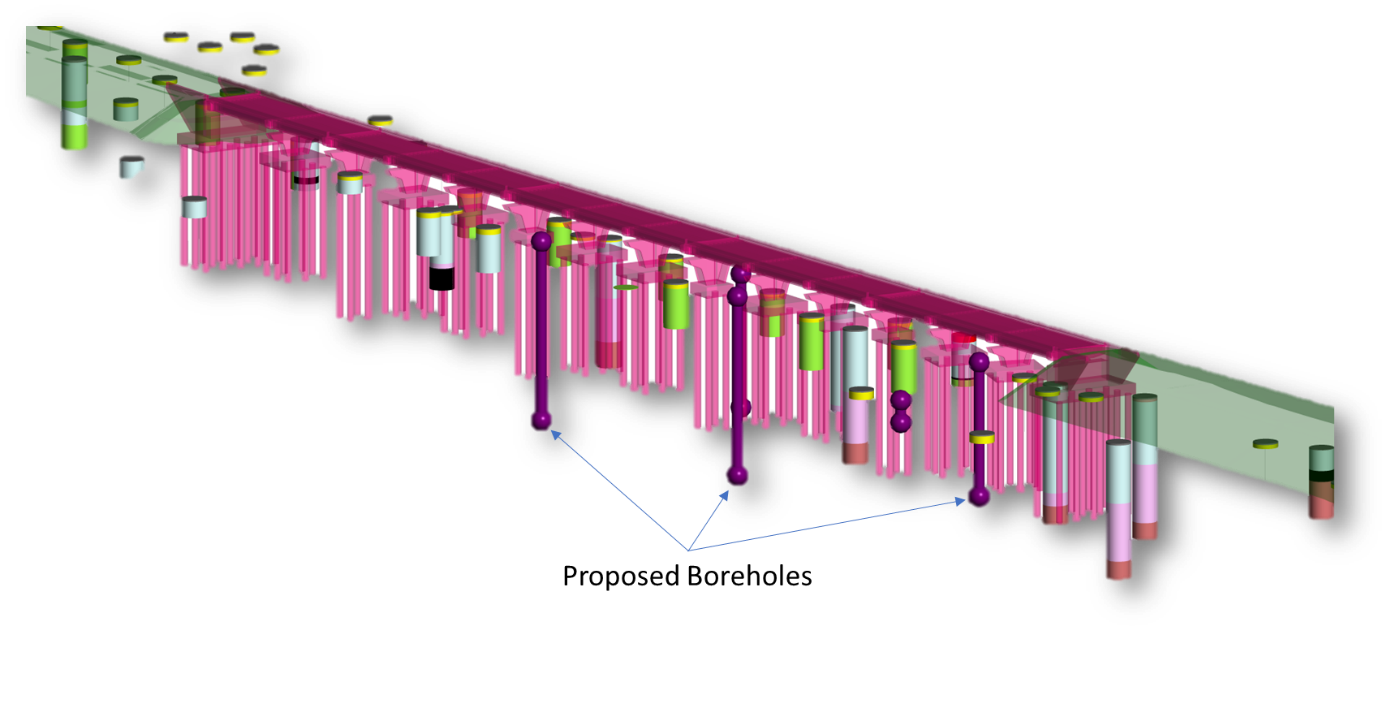
Figure 9 presents an example of how the Route Wide Management Models can be used to plan and manage the ground investigation – Balsall Common Viaduct using the Route Wide Management Model
Empowering multidisciplinary design teams with GI data
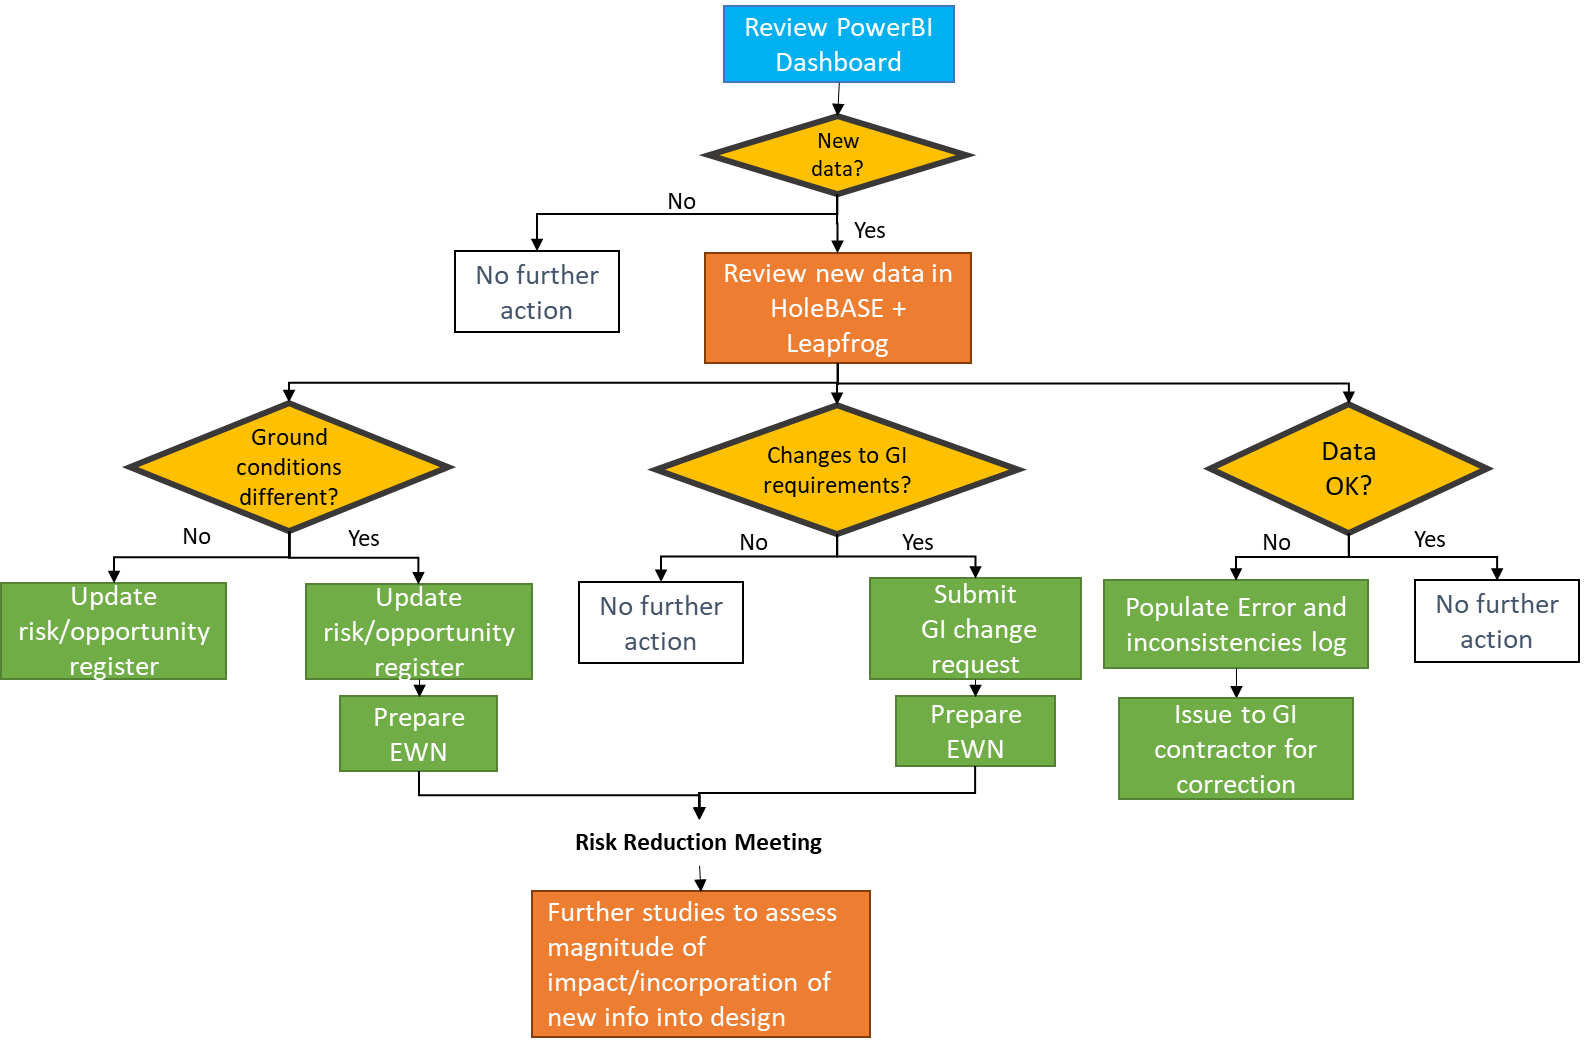
Due to the ‘just in time’ nature of the GI new data must be communicated to designers in near ‘real time’. This is particularly important for detailed design where new data acts as validation for the design and the realisation of risks and opportunities need to be identified and acted upon quickly to avoid significant cost and programme delays. Visualising the new ground investigation data in a 3D environment via the route wide/area management models and comparing it to existing data/interpretation based on the design data freeze dates is a key part of the detailed design ground investigation monthly review workflow (Figure 10).
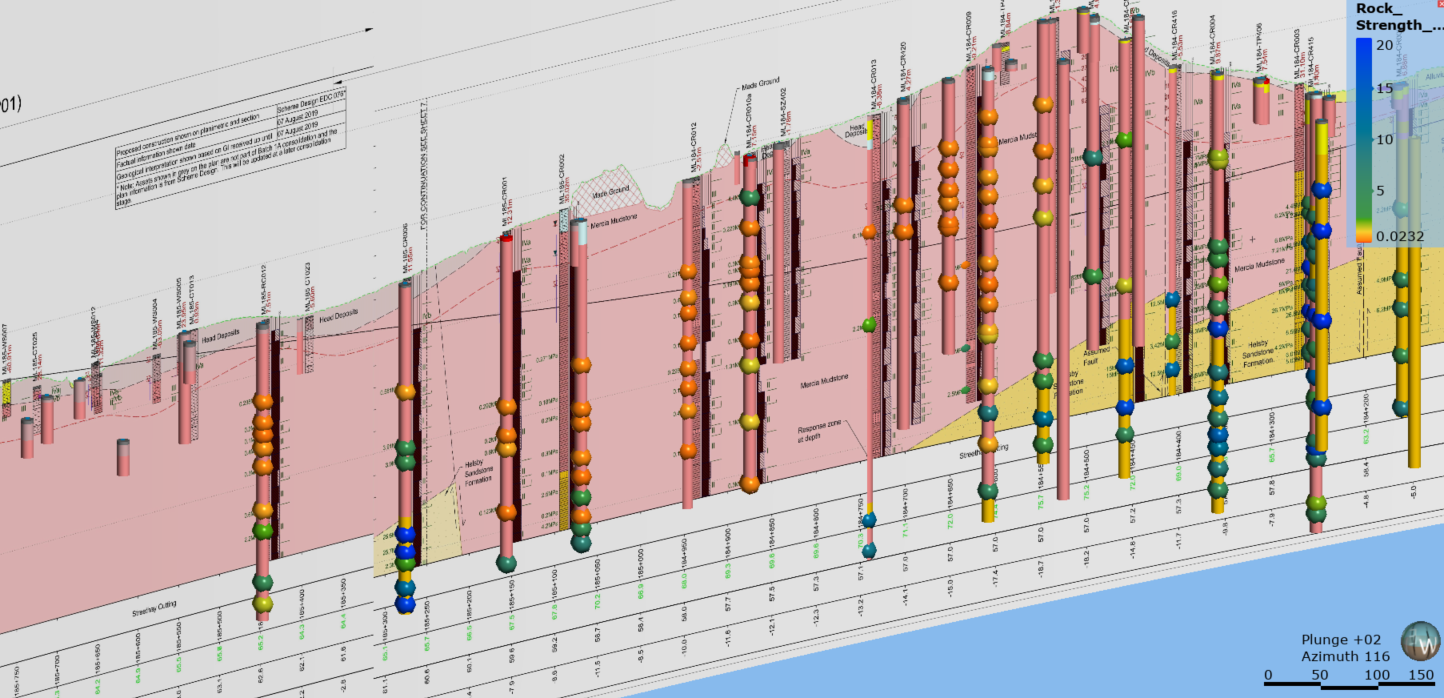
Examples of how new ground investigation data is visualised in the Route Wide/Area Management models and compared to existing data/interpretation are presented in Figures 11 and 12. This increases the robustness of the geotechnical risk management such that geotechnical risk registers could be tracked throughout the lifecycle and updated to reflect change.
Where there is value, design teams have created asset specific ground models to aid interpretation and design. The Washwood Heath Retaining Structure and Depot area is an example of a complex, multidisciplinary design where an asset specific geological digital twin model has been created.
This has created the following benefits to the design team:
- interpreted ground model could be directly imported into MODFLOW to help inform groundwater control measures during and post construction;
- ground model facilitated coordination between the geotechnical, geo-environmental and EWC teams on earthworks/foundation design and contamination strategy;
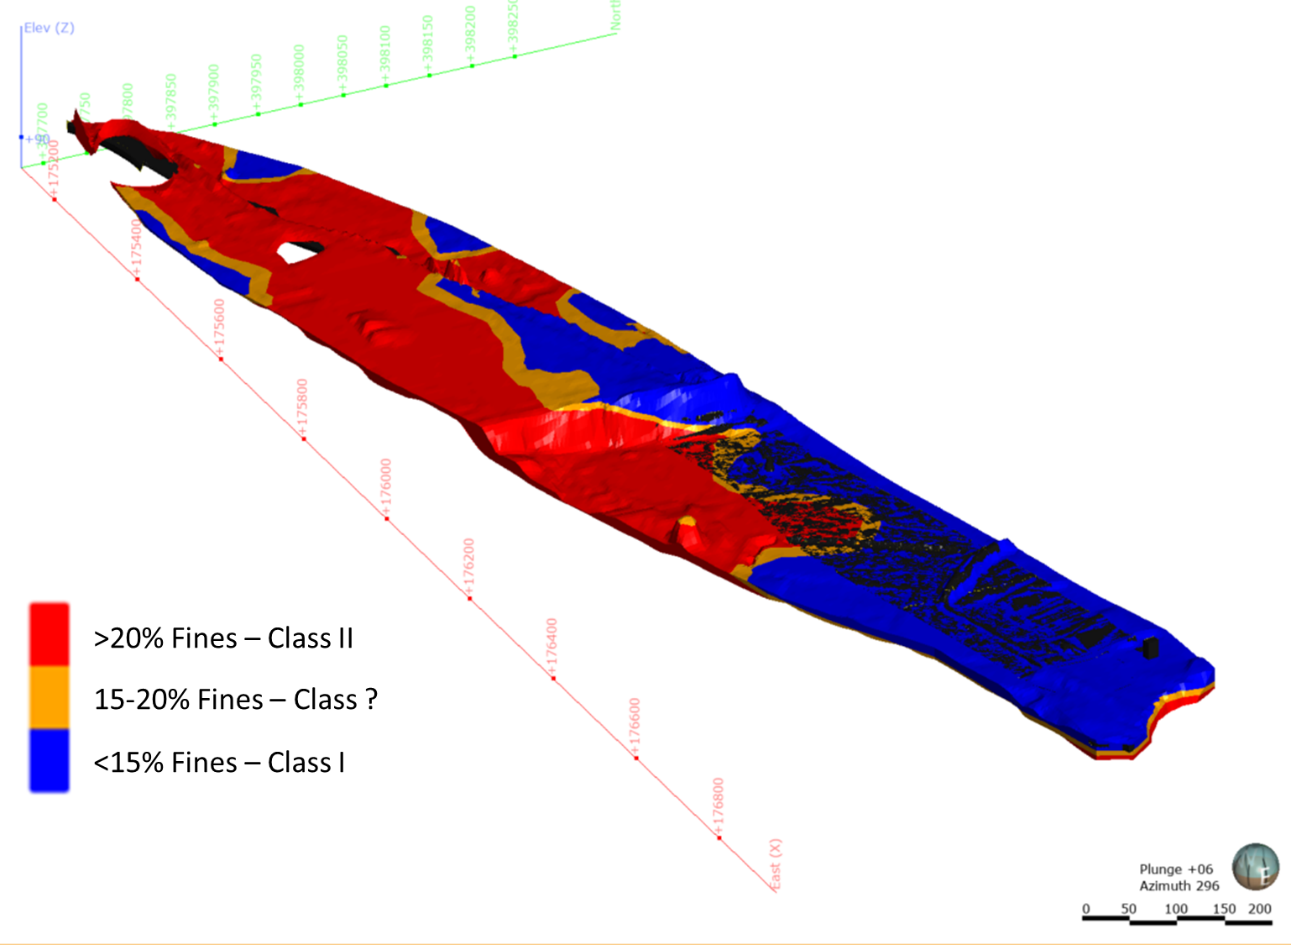
- helped inform spatial characterisation of the intrinsic and state properties of material to help inform the material re-use and remediation strategy (Figure 13).
Stakeholder engagement/communication
Engineering geologists and geotechnical engineers are trained to think of geology in three dimensions but there are challenges in communicating this knowledge and understanding to stakeholders. Utilising the full package of the Central ecosystem is allowing this historical barrier to be broken down. Using a 3D model in a highly visual and interactive way in the heart of meetings across teams and with stakeholders has significantly aided the discussions ensuring there is common understanding of the ground conditions and their variations.
The BBV geotechnical team have found geotechnical BIM systems implemented on the project, such as those discussed throughout this paper, have enable efficient management of geotechnical information and present a significant leap forward for ground data/information visualisation. Such processes provide near real-time access to quality assured information for BBV, HS2, the supply chain and other stakeholders. Development and integration of Leapfrog and Central software, along with the Ground Investigation Dashboard Power BI app, within the IPT has brought about a step change, providing a more detailed, dynamic and integrated communication of the ground model to the non-geotechnical specialist. The ability to view and refine vast datasets, including geological descriptions and test results, in a rich 3D environment alongside federated models, topographical setting and desk study information significantly simplifies comprehension of the substrata.
“The benefits at Scheme and Detailed Design Stage have been obvious, we look forward to building on the wealth of information captured within our ground models and exploit further opportunities throughout construction, operation and maintenance.” – BBV Geotechnical Manager
Wider application and future developments
The digital innovations presented in this paper have been implemented during scheme design and on a number of early detailed design assets and will continue to provide benefits into detailed design and construction and potentially into the operation of the railway.
The scale and nature of N1N2 and more broadly HS2 has demanded the innovative approach to ground data management presented in this paper, but is it relevant to other projects or only restricted to the large-scale infrastructure projects? The simple answer is any project that is collecting data, validating incoming data and analysing ground related data stands to benefit from a more streamlined approach to handling such data and thus allowing it to efficiently pass through the geotechnical lifecycle. An integrated People, Process and Technology data management approach is recommended.
Secondly, humans by their nature are visual creatures, which is why 3D ground modelling is such a powerful communication tool, particularly when communicating with non-technical specialists. It brings together the ground investigation and design in one place to enable more informed on-site decisions to achieve ‘maximum benefit’ from the ground investigation phase. It also enables better coordination between multidisciplinary design teams and a more efficient workflow during the design phase through connecting the ground model directly to analytical software (e.g. SlopeW) and BIM deliverables (currently being trailed on selected assets for detailed design). It is important to remember that not every project or asset will benefit from a detailed ground model, which is why the level of detail of a model must carefully be considered prior to creating a ground model.
What are the next steps? And what challenges remain?
Starting with the early stages of the geotechnical lifecycle:
- How does GI go truly digital? For many years now factual reporting has, between AGS and the pdf factual report, straddled this with still some significant data sets /information sitting in the pdf alone (e.g. core photos, advanced testing etc).
- How do we make better use of advanced testing that currently doesn’t fit into the AGS format? (e.g. In-situ Pressure meter testing interpretative plots, advanced lab testing results);
- How can we make better use of core photos and site sketches?
- Is tagging a file reference in the AGS file enough?
- If photos/sketches were appropriately geo-referenced could they be brought into the 3D modelling environment (e.g. Core logging shed functionality in Leapfrog)?
- A trial has begun on N1N2 to see if Feature Manipulation Engine (FME) can pull out core photos and logs from factual reports.
- Is the AGS format suited to a world of increasingly connected and nested data?
- Would AGS be more suitable in a standard format such as JSON that doesn’t require bespoke software to read?
- How can we accurately track the ground investigation progress and deliver the ground investigation in an order that is to ‘the best advantage of the project’? The GI dashboard is a start, but the next step is to incorporate a prioritisation logic to determine the order that the exploratory holes are drilled based on defined factors (e.g. design timeframes, construction start dates, type of asset, environmental consenting requirements and land access).
Moving onto the design stage:
- How can we better connect ground modelling with the wider project Common Data Environments?
- Can we fully integrate ground models into the design analysis process, including consideration of geological uncertainty and design approach (e.g. best estimate, characteristic or worst credible)?
- What else could benefit from detailed 3D ground models? Could we use the models to help estimate material volumes to help inform the mass haul strategy?
- A volume extraction trial from the Washwood Heath asset specific ground model is currently ongoing.
The construction phase is still very much in its infancy across HS2, providing the opportunity to develop and implement a coordinated route wide approach for recording construction ground data. A trial is currently ongoing at Long Itchington Wood North Portal to capture key geotechnical data (e.g. discontinuities, face photos) during construction in a structured format via an app. By capturing the data in a structured and georeferenced format asset specific ground models can be further developed during construction to create a truly 4D ground modelling approach. Such an approach would act as a powerful design verification tool that could be maintained into asset management phase. To realise the full benefits such an approach must be applied across all contracts with a centralised strategy adopted.
Turning more broadly to the sharing of ground data across the geotechnical lifecycle – how can we ensure data is efficiently passed between phases and companies across HS2 (and future projects) without loss of data or knowledge? Is it possible to build a common data approach/structure across all contracts and supply chains for not just ground investigation data but all ground data (e.g. piling, earthworks and construction logging)? This will be key to ensuring a ground data legacy is retained into the asset management phase and the benefits are felt through the full 120-year design life and beyond. It could also act as the ‘tipping point’ to creating a truly connected, data centred geotechnical lifecycle that future projects can benefit from.
Acknowledgements
The authors wish to acknowledge Seequent for their development of Central and their ongoing support to the project. Thanks to the BBV and DJV management teams for their support to the developments presented in this paper. Recognition also goes to the BBV GI team for their feedback on the application of the management ground models to support the delivery of the ground investigation.
References
[1] HS2, 2019. Technical Standard – Geotechnical Data Management (Doc no. HS2-HS2-CT-STD-000-000008) – P02, 99pp.
[2] Association of Geotechnical and Geoenvironmental Specialists. 2011. Electronic Transfer of Geotechnical and Geoenvironmental Data – AGS 4. Edition 4.0.3 – October 2011 Addendum (Ref 4.0.3.02), Kent, 150pp.
[3] Fookes, P.G. 1997. Geology for Engineers: the Geological Model, Prediction and Performance. Quarterly Journal of Engineering Geology and Hydrogeology, 30, 293-424, 1.
Peer review
- Sarah TrinderLead Geotechnical Engineer, HS2 Ltd
- Sonia ZahiroddinyHead of Digital Engineering, HS2 Ltd