Investigating differences between life cycle assessment tools on major infrastructure schemes
An essential part of managing whole life carbon impacts of High Speed Two (HS2) Euston Station is quantifying, monitoring and reporting whole life carbon emissions through a Life Cycle Assessment (LCA) process. The LCA process initially provides a baseline which identifies carbon hotspots and allows for the monitoring of progress towards the contractual 50% whole life carbon reduction target. It also informs the Euston Station aspiration to reach net zero carbon, set within the wider context of the UK’s legal obligation to net zero carbon transition by 2050. Furthermore, whole life carbon management aligns with the vision that ‘HS2’s stations will be amongst the most sustainable stations in the world’.
Whole-life carbon for Euston Station is managed and quantified in line with Royal Institute of Chartered Surveyors (RICS) [6], HS2 Technical Standard – Carbon footprinting and life cycle assessment[5], EN-15978[7], PAS2080[8], BS EN ISO14040[9] and BS EN ISO14044[10]
standards and guidance on a bi-annual basis.
Several life cycle inventory and LCA tools are available for carbon quantification, providing a basis to focus on key carbon reductions in ‘hotspot’ areas. However, recent academic studies highlight the lack of transparency in these tools and difficulties comparing reported impacts between differing software platforms.
Similar issues were explored while performing the LCA for Euston Station. Two web-based LCA tools were used, and the outputs compared. This paper presents the findings and explores the difference and lack of transparency in Lifecycle Inventory (LCI) data sources, emissions factors (materials and transport), inconsistency in the scope of life cycle modules found across LCA tools, comparability and reproducibility of results within and across these tools.
This paper aims to improve understanding of the limitations across LCA tools to inform robust and transparent reporting of whole life carbon impacts across the industry. This understanding can be developed and adapted for other HS2 contracts along the route, as well as other infrastructure projects.
Introduction
National (UK) Budgets/Targets
In 2019, the UK became the first major economy to pass legislation mandating net-zero Greenhouse Gas (GHG) emissions by 2050[1]. This means that all sectors in the UK need to decarbonise to zero emissions, or as close to zero residual emissions as possible. To achieve net-zero GHG emissions by 2050[2] , any residual emissions across all UK sectors are expected to be offset via both nature-based removals (i.e., land-use change, increased forestation, peatland restoration), and engineered greenhouse gas removals (i.e., bioenergy with carbon capture and storage, Direct Air Capture of carbon dioxide with storage).
Infrastructure is associated with over half of the UK’s GHG emissions. Of infrastructure emissions, 30% are directly attributed to the construction, operation, and maintenance of infrastructure assets; and 70% of which are attributed to the users of infrastructure[3].
Therefore, it is crucial that whole life carbon emissions for the built environment are managed, monitored and reduced for the UK to achieve its legally binding target by 2050.
HS2 Programme Target(s)
HS2 has stated that ‘HS2 is being designed and built to be the most sustainable high-speed rail network in the world’[4] – a network, of which, its stations are a key component.
Euston Station is part of High Speed Two (HS2) Phase One delivered by an Integrated Project Team of Mace Dragados Joint Venture (JV) and the Station Design Services Contract (SDSC) team. Arup and WSP are working collaboratively to lead the SDSC team alongside a number of partners working on the design providing multidisciplinary specialist input.
HS2 is committed to a whole life carbon reduction target of 50% against the project baseline and hence has set this target for the Euston Station project. By setting this target, HS2 Ltd empowers and challenges its supply chain to reduce carbon.
Lifecycle Assessment Process
Life Cycle Assessments (LCA) are a framework for assessing environmental impacts of infrastructure and buildings over their lifetime. For the HS2 Euston project, these are conducted on a bi-annual basis. Whole life carbon is monitored against the 50% reduction target, and other environmental indicators are also reported (see Table 1).
Table 1. Lifecycle Indicators to be assessed as part of HS2 LCA (adapted from the HS2 Technical Standard[5])
| Whole lifecycle carbon emissions | Global Warming Potential (kg CO₂e) |
|---|---|
|
Embedded environmental impacts | Ozone Depletion Potential; ODP (kg CFC 11e)Acidification Potential for Soil and Water; AP (kgSO₂-e) Eutrophication Potential; EP (kg (PO4)3-e) Photochemical Ozone Creation; POCP (kg C2H4e) Abiotic Depletion Potential – Elements; ADPE (kg Sbe) Abiotic Depletion Potential – Fossil Fuels; ADPF (MJe) Net use of fresh water; FW (m3)Hazardous waste disposed; HWD (kg)Non-hazardous waste disposed; NHWD (kg)Radioactive waste disposed (high-level nuclear waste); RWDHL (kg) |
The bi-annual LCAs are completed in line with Royal Institute of Chartered Surveyors (RICS)[6], HS2 Technical Standard – Carbon footprinting and life cycle assessment[5], EN-15978[7], PAS2080[8], BS EN ISO14040[9] and BS EN ISO14044[10] standards and guidance.
Whole-life carbon assessment requires a consideration of the following lifecycle stages, which are presented in Figure 1. These consist of; product stage, construction stage, use stage and end of life stage.
![Diagram of modular approach showing the life cycle stages and individual modules for infrastructure GHG emissions quantification (sourced from PAS2080[8])](http://learninglegacy.hs2.org.uk/wp-content/uploads/2023/02/word-image-8409-1.jpeg)
LCA software tools facilitate LCA quantification and provide a range of benefits compared to a traditional manual calculation, such as:
- Bulk upload of data functionality and evolving data analysis and visualisation, which is faster than a traditional LCA calculation method. This is particularly important for programmes on the scale of Euston Station;
- Integration with Building Information Models (BIM), from where most raw data (material types and quantities) can be sourced. This allows for digitisation and efficiency;
- Efficient methods for adding data and continuously improving the calculation; and
- Independent verification service of the emissions factors used for the calculation.
This assists the design and delivery team, by identifying carbon ‘hotspot’ areas, where effort and innovation should be focussed to reduce carbon across the project’s lifecycle. Among a variety of considerations such as compliance with industry standards (as outlined above), the LCA software used for HS2 buildings also must be recognised by BREEAM[11]. The two tools used on the project are OneClickLCA[12] and eToolLCD[13] (referred to as OneClick and eTool respectively in this paper).
Overview of LCA software tools
With a range of LCA software tools in the market, the process for LCA has become more accessible and less time-consuming. Ideally, the outcome of the assessment would not be a function of the software chosen.
A study by De Wolf et al (2017)[14] highlighted that though the method for calculating the whole life embodied CO2e of buildings has been standardised and mutually agreed upon, implementation in practice differs. These findings are also echoed in the RICS guidance[6], which discusses how aspects of the EN-15978[7] methodology have been subject to varying interpretations by practitioners and clients resulting in discrepancies in results of assessments. Discrepancies also arise in the assumptions made, and the limitations, uncertainties, and sensitivities of methodologies.
The choice of LCA software tool influences the choice of lifecycle impact assessment method and data source availability, as this is embedded in the software. Studies have found that even when inputs are matched as closely as possible, implementations of an expected common methodology in different LCA software tools lead to differing results. Speck et al. (2015)[15] reviewed 1 kilogram of aluminium, corrugated board, glass and polyethylene terephthalate in two different LCA tools (SimaPro and Gabi). Findings indicated that the differences in impacts reported between the tools was of greater than 20% for at least one of the four materials in 9 of the 15 Lifecycle Indicator categories. In some cases, these differences resulted in changes in the relative environmental rankings of the four materials. The study also highlighted a ‘major difference’ in global warming potential whereby for obtaining and disposing of 1 kg of corrugated board, the two software programs differed by a factor of 7.20 in terms of kgCO₂e[15].
Similarly, Moncaster et al. (2018)[16], when comparing a cross-laminated timber (CLT) structure with a concrete frame, steel frame and load-bearing masonry, found that even though CLT was confirmed as the lowest impact material, the variation in methodological choices changed the results by a factor of 10 or more.
As well as LCA methodologies and data sources embedded in the software, another key factor impacting on the reliability and comparability of LCA results amongst software is the management and communication of uncertainty. There is a general shortage of sensitivity and uncertainty analysis in the industry[15] [76] [18], which impacts the user’s ability to understand the software package calculations to accurately interpret the results. Sources of uncertainty can stem from: data quality (both input and within the tool), and methodological choices such as spatial or temporal characteristics and model uncertainty (mathematical relationships built into the software). The latter point often relates to the ‘black box’ of modelling, where the user is unable to transparently see how the data and methodologies interact to produce the results.
Therefore, as Gradin and Bjorklund (2020)[19] argue, when an LCA is used to inform decision making, it is crucial that methodologies, data quality and other limitations are transparently communicated.
This study has been undertaken to further understand and interrogate the two LCA software tools used on the HS2 Euston project.
Purpose of Paper
The aim of this paper is to provide a better understanding of the limitations across two specific LCA software tools, with the aim of increasing transparency and improving robustness of LCA reporting. The paper reviews the software tools currently used in HS2 LCA reporting: OneClick and eTool.
The paper is based on the findings in relation to LCA from Euston Station. Euston Station construction project is part of the High Speed Two (HS2) Phase One works, being delivered by the Euston Integrated Project Team (IPT) including Mace Dragados joint venture (MDJV) and Arup (SDSC).
Methodology
Scope
The Euston Station baseline and subsequent LCAs were developed using OneClick. In July 2021 an LCA of Euston Station was attempted in eTool. The aim was to provide comparison with other HS2 contracts which have adopted the use of eTool. A sensitivity test was performed between the two tools to understand whether any differences could result in a significant change from previous OneClick LCA results. For example, it is important to differentiate whether any whole life carbon reductions reported in updated LCA’s are a result of changes in the design or material specification or because the emissions factors in eTool were lower/higher than the same material emissions factors in OneClick.
It was determined that lifecycle stage A1-3 impacts/ emissions factors would be the focus of the sensitivity test due to its higher overall impact of whole lifecycle emissions for this project, as shown in Figure 2 below.
![Diagrams showing approximate percentage distribution of A1-C4 life cycle stages (IStructE[20] adapted from LETI[21])](http://learninglegacy.hs2.org.uk/wp-content/uploads/2023/02/word-image-8409-2.jpeg)
Gap analysis
The sensitivity test took the form of a ‘gap analysis’ to help answer the following questions:
- Are all the materials expected to be assessed as part of the LCA available in both tools?
- If materials, are not available in eTool, can Environmental Product Declarations (EPDs) used in OneClick be added to eTool?
- For the remaining materials, what are the equivalent emissions factors and how do they compare across the two LCA tools?
For the first step, the eTool library was searched to find emissions factors that matched (in terms of scope and description) the emissions factors previously used in OneClick.
Where EPDs were identified from OneClick and not found in eTool, they were uploaded to the eTool software platform. For the remaining materials with no specific EPDs, the
emissions factors for the materials of similar or exact description found in eTool were extracted and compared to those already identified and used in OneClick.
The eTool software provider was consulted to ensure that the interpretation of the data was correct, to enable a like-for-like comparison with the OneClick emissions factors.
Limitations
The gap analysis conducted was a high-level review. Due to time constraints, a ‘deep dive’ into the emissions factors and methodologies that underpin the two tools was not undertaken.
In addition, the focus of this analysis is on A1-3 impacts and (Global Warming Potential GWP), also referred to as ‘carbon’. There are other Lifecycle Inventory data points also analysed by the tools which have not been reviewed.
The gap analysis focused where it had been identified that equivalent A1-3 emissions factors soured from eTool were different to those in OneClick, and more specifically on those materials most common in the Euston Station design and which are also typical A1-3 carbon hotspots: concrete and steel.
Results
The results of the gap analysis are presented in Table 2.
Table 2. Results of gap analysis
| Question | Outcome of Gap Analysis |
|---|---|
| Are all the materials expected to be assessed as part of the LCA available in both tools? | No, not all the materials expected to be assessed as part of the LCA were available in both tools. |
| If materials, are not available in eTool, can EPDs used in OneClick be added to eTool? |
Yes, EPDs used in OneClick were added to eTool. |
|
For the remaining materials, what are the equivalent emissions factors and how do they compare across the two LCA tools? | The A1-3 emissions factors (GWP) were extracted for each material identified across both tools. For the key materials (as discussed below) a percentage difference between the two emissions factors was identified – see Figures 3 and 4. |
Figure 3 shows the results of the comparison between the concrete emissions factors previously used in OneClick to the equivalent materials and emissions factors sourced from eTool. Figure 4 below shows similar results for steel materials. It can be seen that there are large differences between the two tools in the emissions factors for these common construction materials.
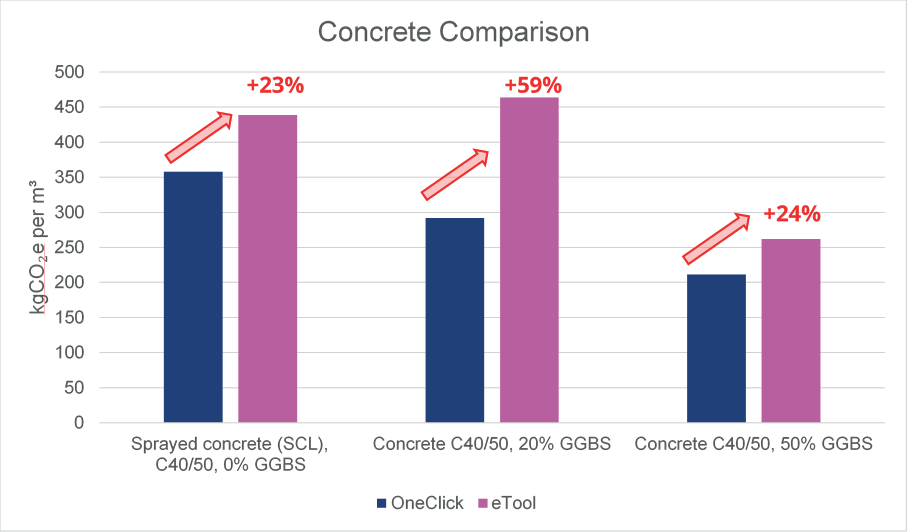
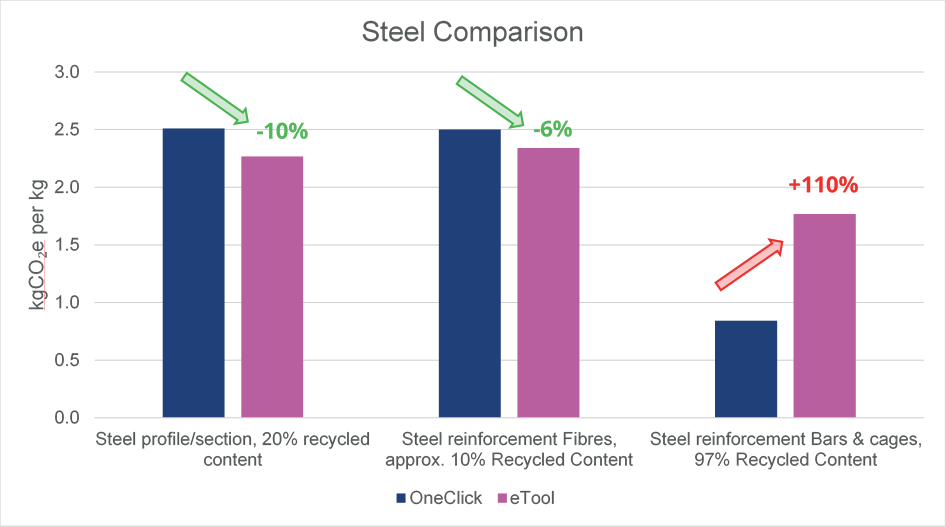
The main concern raised by the comparison exercise was the difference in the A1-3 emissions factors for concrete and steel reinforcement. Thus, simply by switching LCA software tool from OneClick to eTool, the LCA result for carbon would likely substantially change even with no change to the actual design. Furthermore, comparisons to previous LCAs, including the baseline, would not be robust.
Discussion
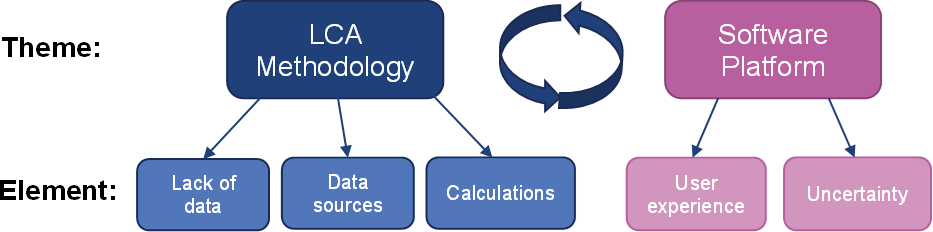
Following the outcome of the gap analysis and in keeping with findings in academic literature, two overarching themes emerged regarding difference in the results between the LCA tools.
- difference in LCA methodologies; and
- limitations of the software platforms.
These themes and their key elements are outlined in Figure 5. The themes are not independent but feed into each other, as explained below.
LCA methodology
The LCA tool methodology is likely to account for the differences in results seen in Figures 4 and 5.
Data sources
With the range of LCA software tools available, each tool will be nuanced in its combination of interfaces. These include data input requirements, built-in assumptions, Life Cycle Indicator (LCI) databases, LCA methodologies, and output information. Aggregated, this will likely lead to varying results depending on the LCA tool used for a particular assessment[14] [22].
In the case of this study, OneClick, among other data sources, integrates data from a range of global EPD platforms[23] whereas eTool favours the use of the LCI database Ecoinvent[24] (both valid methodologies), so the sources of emissions data that the user can choose from is different, resulting in different outcomes. In addition, the geographic origin of the LCA software tool is likely to have an impact on the range and availability of locationally specific emissions data. This can cause variations in results due to the differences in product/material manufacturing practices in various locations as well as electricity grid compositions.
Data availability
There is a recognition across the industry that despite various databases being available, at a range of spatial scales, more effort in data collection is still required[14].
During the gap analysis it was found that there were some materials that existed in OneClick but not in eTool and it is possible that the reverse may also be true.
It was also found that the eTool database did not have emissions factors for steel reinforcement to account for the Electric Arc Furnace (EAF) method of steel production,
compared to the basic oxygen furnace (BOF) method. This may contribute to the differences observed in the A1-3 emissions factor for steel reinforcement between the two tools.
Calculations
LCA software tools automate the LCA calculation process. This is beneficial when dealing with large volumes of data, but also can result in a ‘black box’ whereby the calculations being undertaken are not always transparent and visible. This makes it challenging for users to understand the causes of variations between different products, buildings LCA software tool results [25]. This was experienced during the Euston Station gap analysis between OneClick and eTool.
This is probably because, as discussed earlier, even though LCA software tools are compliant with prescribed industry methodologies (EN15978[7], ISO14040[9]), their implementation can differ giving a variance of results between tools (RICS)[6].
Software platforms
This section explores some of the more general limitations of LCA software tools.
Uncertainty
There are inherent uncertainties relating to the results of a lifecycle inventory analysis due to the cumulative effects of model assumptions, input uncertainty, and data variability. Despite software tools being able to present the uncertainty surrounding a particular emissions factor or EPD, the compounded impact of all the uncertainties in data points used within the model is lacking.
Across the industry and LCA software tools, there is a need for more transparency, data quality assessment and sensitivity analyses. Reducing uncertainty would aid a better understanding of differences in emissions factor sources and provide more confidence in results[14] [17].
In relation to this study, as the impact of the ranges and sources of uncertainty relating to the emissions factor or EPDs selected in OneClick and eTool was unclear, it reduced confidence in the ability to understand the difference in results across software tools.
Communication of uncertainty could be better integrated into the outputs provided by LCA software tools, such as the inclusion of an error bar in graphs of total emissions to better enable the user to interpret the results.
User experience
The ability of the user to be able to interact and use an LCA tool as it was intended and in line with technical guidance, helps to increase reliability and confidence in the results.
For example, if the user can understand how the selection of emissions factors impacts the results, as well as understanding the data sources and methodologies applied; they can make a more informed judgement on the appropriateness and comparability of emissions factors[26]. It also helps to better understand uncertainty in the assessment as outlined above.
Though the experience with eTool and OneClick in terms of user accessibility was that the tools are intuitive, it is recognised across the industry that more can be done to improve the accessibility of LCA tools. This can allow for greater uptake of LCA beyond the role of an LCA practitioner and ensure that the interpretation of the LCA results is consistent across a range of users.
Conclusion
After conducting a high-level review of two LCA software tools and reviewing academic studies, it became apparent that when choosing an LCA tool the following need to be considered:
- Reasons for doing the LCA: is it to compare against the baseline, compare against different contracts, to facilitate and identify carbon hotspots; and/or to help implement carbon reduction?
- Can the tool deliver results required for the situation: for example, does it meet the required standards for assessment, does the tool provide the results required?
- Quality / reproducibility: is the tool transparent and traceable enough to be reviewed, does the tool have its own quality assurance protocols, is the tool user friendly?
The selection of an LCA software is a culmination of a range of factors. It is important to identify whether the results of the LCAs will be compared across tools because, as identified in this study, the results will likely differ. If results are going to be compared across LCA tools, as a mitigation measure, a gap analysis and sensitivity test should be undertaken to allow for a better understanding and reasoning as to why the results and relative rankings of material carbon intensity/ hotspots may differ.
If the purpose of the LCA software is to identify carbon hotspots and facilitate carbon reductions against targets, the choice of tool is not so significant. However, it would be beneficial to understand the range of uncertainty expected in the results, as a function of the choices made in selecting emissions factor/EPD’s and the methodology embedded in the software tool. This allows for further transparency and robustness of the results.
To better recognise these differences, a deeper understanding of the emission factor build- ups (data sources and methodologies) for the EPDs or material emission factors selected in each tool is required. This would be aided by a more transparent understanding of the range and sources of uncertainty in the results as well as an industry wide improvement of data availability in within LCA software tools.
Currently, and as seen in this study, the task of identifying differences in assessment methods/emissions factors between software and promoting consistency in results falls on the users [14]. Whilst users may identify areas for improvement in LCA software tools, software providers also need to contribute to improving both the transparency and consistency of LCA results.
As LCA becomes more prominent in the built environment, especially in light of the UK’s legal obligation to achieve net zero emissions by 2050, the expectation is that LCA software tools will continue to evolve to address the problems such as transparency, data availability and uncertainty.
Industry awareness of these LCA software tool shortcomings, should help them to be addressed. This would provide further confidence in the robustness of LCA results, to ensure commitments to reduce whole life carbon can be met, for Euston Station and in the wider industry.
Acknowledgments
- James Richardson (Climate Change Specialist (Carbon) at HS2 Ltd)
References
- Committee on Climate Change (CCC) (2019) Reducing UK emissions: 2019 Progress Report to Parliament. London
- UK Green Building Council (2019) Net Zero Whole Life Carbon Roadmap – Technical Report.
- HM Treasury (2013) Infrastructure Carbon Review.
- High Speed Two Ltd (2022) Net Zero Carbon Plan.
- HS2 Technical Standard – Carbon footprinting and life cycle assessment (2017)
- Royal Institute of Chartered Surveyors (RICS) (2017) Whole life carbon assessment for the built environment.
- British Standard EN 15978:2011 Sustainability of construction works — Assessment of environmental performance of buildings — Calculation method.
- Publicly Available Standard (PAS) 2080
- BS EN ISO 14040:2006+A1:2020 Environmental management. Life cycle assessment. Principles and framework
- BS EN ISO 14044:2006+A2:2020 Environmental management. Life cycle assessment. Requirements and guidelines
- Building Research Establishment Environmental Assessment Method (BREEAM)
- OneClick LCA Ltd.
- eToolLCD.
- De Wolf, C., Pomponit, F. and Moncaster, A. (2017) Measuring embodied carbon dioxide equivalent of buildings: A review and critique of current industry practice.Energy and Buildings. 140, pp. 68-80
- Speck, R., Selke, S., Auras, R. and Fitzsimmons, J. (2015) Life Cycle Assessment Software: Selection Can Impact Results. Journal of Industrial Ecology 20, pp.18-28
- Moncaster, A. M.; Pomponi, F.; Symons, K. E. and Guthrie, P. M. (2018). Why method matters: temporal, spatial and physical variations in LCA and their impact on choice of structural system. Energy and Buildings, 173 pp. 389–398.
- Gui, M. and Murphy, R.J. (2012) LCA data quality: Sensitivity and uncertainty analysis. Science of the Total Environment. 435-436. pp, 230-243
- Bamber, N., Turner, I., Arulnathan, V., Li, Yang., Ershadi, S. V., Smart, A. and Pelletier, N. (2019) Comparing sources and analysis of uncertainty in consequential and attributional life cycle assessment: review of current practice and recommendations. The International Journal of Life Cycle Assessment. 25. pp, 168- 180
- Gradin, K.J. and Björklund, A. (2020) The common understanding of simplification approaches in published LCA studies—a review and mapping. The International Journal of Life Cycle Assessment. 26. pp, 50-63
- IStructE (2020) A brief guide to calculating embodied carbon.
- London Energy Transformation Initiative (LETI) (2020) LETI Embodied Carbon Primer.
- The University of British Colombia (2020) Policy review of carbon-focused Lifecycle Assessment in Green Building Design and Performance at the University of British Colombia.
- OneClickLCA. What data is available in One Click LCA?
- eToolLCD. What LCI Data Sources Does eToolLCD Use.
- Hollberg, A., Kiss, B., Röck, M., Soust-Verdaguer, B., Houlihan Wiberg, A., Lasvaux, S., Galimshina, A and Habert, G. (2021) Review of visualising LCA results in the design process of buildings. Building and Environment. 190
- Lasvaux, S., Gantner, J., Schiopu, N. and Nibel, S. (2013) Towards a new generation of building LCA tools adapted to the building design process and to the user needs? Conference: Proceedings of the International Conference on Sustainable Buildings, Construction products and Technologies
Peer review
- Mike WhiteHS2 Ltd
- Mark Fenton HS2 Ltd
- Mike deSilvaHS2 Ltd