Investigation of the behaviour and the design for piles subject to ground heave
The High Speed Two (HS2) mainline crosses deep cuttings in Charmouth Mudstone. Deep excavations cause significant stress changes in the ground which inevitably result in ground heave. However, there is a dearth of research and design guidance currently available for piles subject to ground heave induced by deep excavation in Charmouth Mudstone.
In this paper, the geology and properties of Charmouth Mudstone, as revealed in in-situ and laboratory tests, are discussed. Preliminary pile load tests with bi-directional load cells, strain gauge and extensometer measurements were carried out to investigate the pile behaviour in Charmouth Mudstone. The t-z method in conjunction with interpretation of preliminary pile load test data have been used to analyse the displacement and the induced stress in the pile subject to excavation-induced heave. The parameters of the t-z curves were derived from the pile load test results. The analyses show that the pile behaviour is dependent on slippage along the pile-soil interface and the specific t-z curve for Charmouth Mudstone.
Finite Element analysis is carried out to demonstrate that a simplified t-z analysis with an appropriate chosen t-z curve for Charmouth Mudstone can capture the vertical heave response reasonably well for the purpose of engineering design. The study and the conclusions made in this paper provide a viable method about pile heave design which are applicable to the wider industry.
- Written by
-
Richard Yuan (Arcadis Consulting (UK) Ltd/EKFB/ASC)

-
Tom Storr (Arcadis Consulting (UK) Ltd/EKFB/ASC)

- Resource type
- Resource type: Technical Paper
- Intended audience
- Consultants
Notation
γ – unit weight at natural moisture content;
LL – average Liquid Limit;
PI – average Plasticity Index;
cu – undrained cohesion;
UCS – Uniaxial Compressive Strength;
c’ – cohesion intercept in terms of effective stress;
φ’ – angle of shearing resistance in terms of effective stress;
φ’dil – angle of dilation;
E50ref – hardening soil model reference stiffness modulus corresponding to the reference confining pressure of 100 kPa;
Eoedref – hardening soil model reference primary compression reference stiffness modulus corresponding to the reference confining pressure of 100 kPa;
Eurref – hardening soil model unloading/reloading reference stiffness modulus corresponding to the reference pressure of 100 kPa;
m – hardening soil model parameter stress dependent stiffness according to a power law;
ν0.7 – small -strain hardening soil model shear strain level at which the secant shear modulus is reduced to about 70% of the initial secant shear modulus.
G0ref– small-strain hardening soil model secant shear modulus at very small strain at a reference minor principal stress of 100 kPa;
kx(ky) – coefficient of lateral permeability;
kz – coefficient of vertical permeability;
K0– at-rest lateral stress coefficient;
qi – maximum unit shaft frictional resistance at the top level of the soil layer;
dqi – Increase of qi over the thickness of the soil layer;
zc – yield displacement for full shaft frictional resistance;
E – Young’s modulus at the top level of the soil layer;
dE – Increase of E over the thickness of the soil layer;
ν – Poisson’s ratio of the soil layer;
rm – maximum radius of influence of pile.
Introduction
This paper is presented as part of the works to deliver the Main Works Civils Contract (MWCC) for the central section of High Speed Two (HS2) Phase One which includes the North Portal Chiltern Tunnels to Brackley and Brackley to South Portal of Long Itchington Wood Green Tunnel, being delivered by the EKFB Integrated Project Team.
HS2 Phase One under construction covers a 230 km route from London to Lichfield. Slab track is used in HS2 Phase One. Area Central Contract C3 of HS2 Phase One has 10 m to 14 m deep cuttings in the Charmouth Mudstone geological formation (CHAM) at Boddington, Warwickshire.
Deep excavations cause significant stress changes in the ground which inevitably result in ground heave. Ground heave affects the behaviours of slab tracks and overbridges in deep cuttings. The ground heave shall be considered in the pile design for slab tracks and overbridges.
McNamara and Taylor (2002)[1] carried out centrifuge model tests with heave reducing piles and the research demonstrated that piles were effective in stiffening the soil and reducing displacements. The ground heave induces tension forces in piles and causes pile upward movement. The research by O’Reilly and Al-Tabbaa (1990)[2] and Lee et al (2001)[3] on piles in swelling ground showed that pile behaviour was heavily dependent on slippage along the pile-soil interface. No detailed pile heave design guidelines have been found in the current design standards.
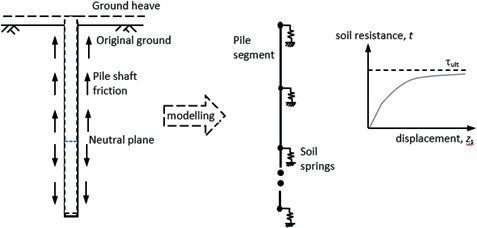
The load transfer method, also known as the t-z curve method (Seed and Reese, 1957[4]; Coyle and Reese, 1966[5]) is commonly used for analysis of axially loaded piles. The principle of this method is to discretise the soil continuum into a series of independent non- linear springs at different elevation levels, with the load transfer at a certain pile section being independent of the pile displacement elsewhere. Empirical and semi-empirical t-z models are employed in practice to describe the evolution of both the stiffness and strength of these soil springs during axial loading, as shown in Figure 1.
Alternative approaches for formulating t-z curves have been proposed for piles bored in sand or clay, including the elastic-perfect plastic (Randolph & Wroth, 1978)[6], hyperbolic (Chin & Poulus, 1991)[7], logarithmic (Puzrin & Burland, 1996)[8], parabolic (Vijayvergiya, 1977)[9] and bilinear (Frank, 1985)[10] models. However, there are currently no t-z curves in the literature that are specifically for Charmouth Mudstone. The application of existing t-z curves to piles in Charmouth Mudstone is uncertain because of the differences in soil behaviour.
This study presents t-z curves developed from analysis of pile load test data in Charmouth Mudstone at Boddington, Warwickshire, UK. Strain gauge measurements were used to calculate the load distributions down the pile. The t-z data were calculated directly from the pile load distributions and normalized to compare them to t-z curves for clays from the literature. A pile in a typical representative cutting was analysed using the t-z curves chosen from the literature. The input parameters for the chosen t-z curves were derived based on the pile test results. A Finite Element (FE) analysis with single pile in the cutting was carried out and the comparison of results between FE calculation and the t-z curve method analysis for Charmouth Mudstone are presented.
Soil conditions
The Charmouth Mudstone (CHAM) Formation (formerly ‘Blue Marl/Lower Lias Clay’) is generally composed of grey mudstone with sporadic thin bands and nodules of limestone, some of which are markedly shelly. The geotechnical properties of the mudstone are heavily influenced by the degree of weathering. Hobbs et al (2012)[11] suggested a fourfold weathering classification method which comprises unweathered (Class A) to fully weathered Charmouth Mudstone (Class D).
A ground investigation for the preliminary pile load test site at Boddington cutting was completed in January 2020 and the ground conditions encountered in the exploratory holes comprised 7.0 m thickness of firm to very stiff silty Clay (weathering Class D and Class C CHAM) underlain by 17.0 m thickness of extremely weak Mudstone (weathering Class B). Below is very weak and medium strong Mudstone (weathering Class A). Figure 2 shows the test results of undrained shear strength. A correlation factor of 4.5 was used to derive the undrained shear strength value from the in-situ SPT-N value.
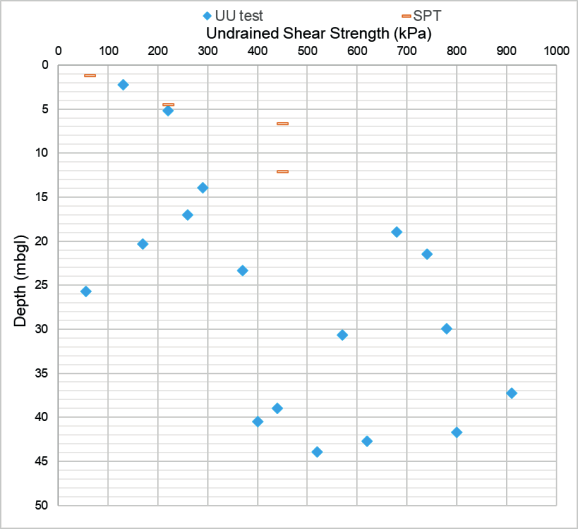
The Unconsolidated Undrained cu test value at 25.7 m depth was 56.0 kPa. This test value is lower compared with other test values of the samples around that depth. This low cu test value is likely due to sample disturbance.
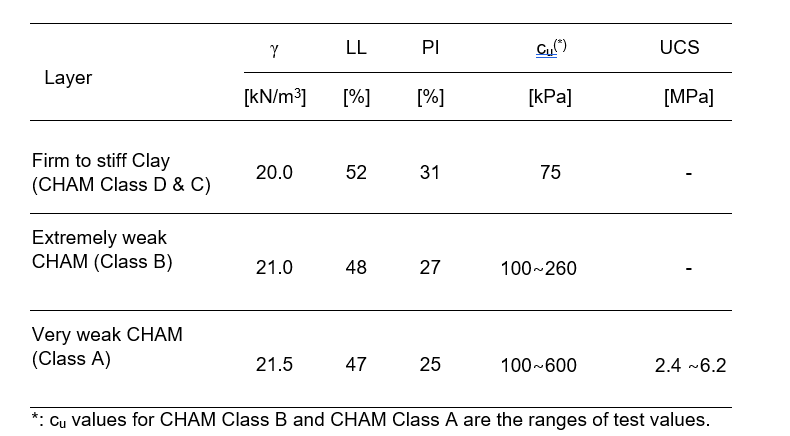
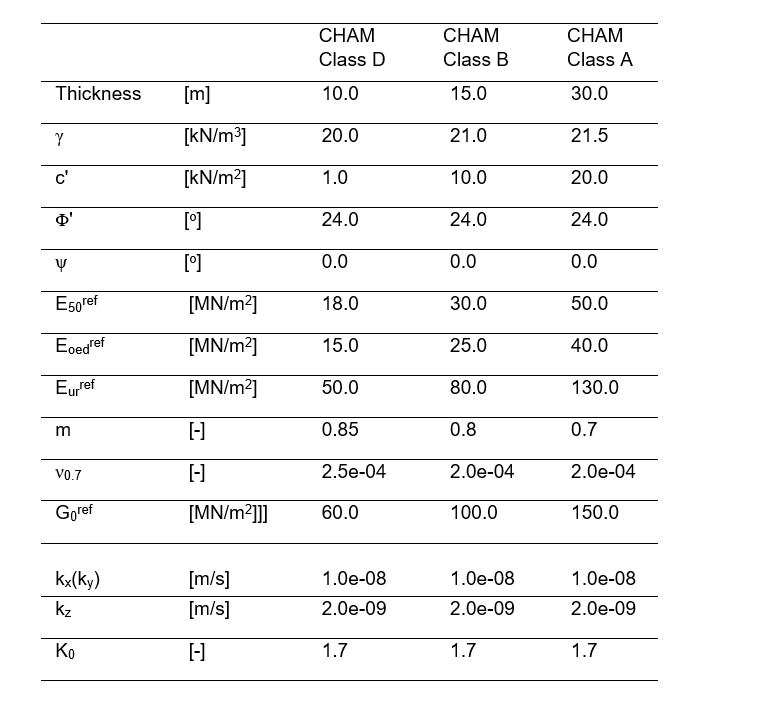
Table 1 presents the characteristic values of the main geotechnical parameters of the CHAM obtained from the ground investigation.
No groundwater was encountered in the boreholes during the fieldworks at the pile test site. 32 piezometer sensors were installed at the site of Boddington Cutting Heave Trial[12] which is located 1 km away from the preliminary pile load test site. The pore pressures measurements in the piezometers in 2019[12] showed that the groundwater head varied from a level of 130 mAOD to 120 mAOD which are at depths from 10 m to 20 m below the ground surface of the pile test site. Groundwater was observed to ingress into the pile bores from a limestone interbed at 30 m depth during the construction of the test pile.
Preliminary Pile Load Test
Test Pile Construction and Testing Setup
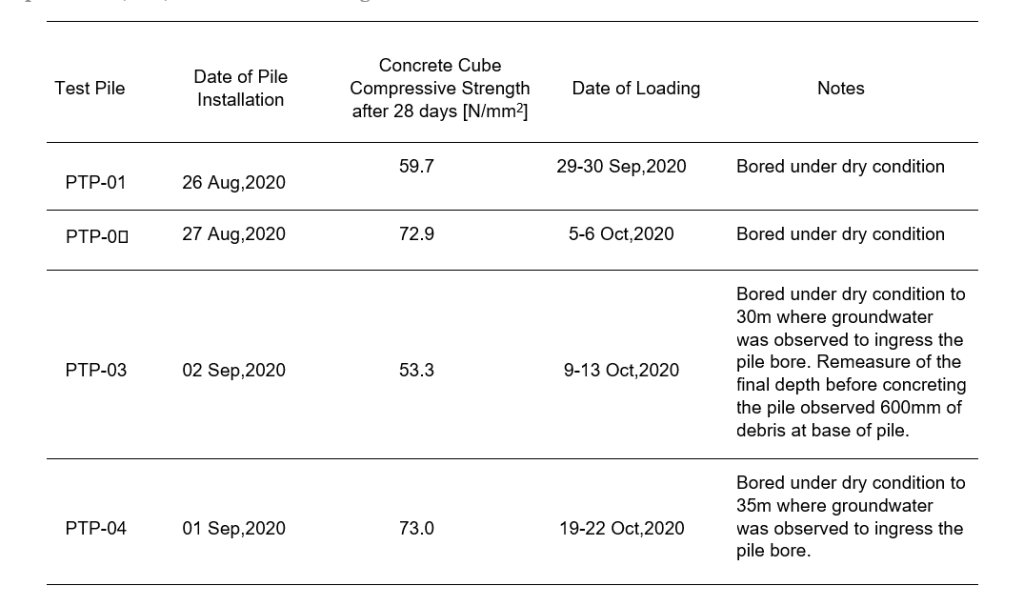
The preliminary load test piles included two 1500 mm diameter 20.8 m long bored piles (PTP-01 and PTP-02), and two 900 mm diameter 50.0 m long bored piles (PTP-03 and PTP- 04). A 26.0 m long bitumen-coated steel casing was inserted in the top sections of PTP-03 and PTP-04. The bitumen coated steel casings were proposed to reduce heave impacts.
The shaft frictional resistance along the bitumen-coated casing is not discussed in this paper.
The construction and the loadings for the test piles were carried out in 2020. Table 2 presents the information of pile construction.
Bi-directional static load tests were performed on all four test piles. A single layer of Osterberg cells were installed for piles PTP-01 and PTP-02, and two layers of bi-directional O-cells were installed for piles PTP-03 and PTP-04.
The load tests for PTP-03 and PTP-04 were carried out in two stages – Stage 1 and Stage 2. In Stage 1 the upper O-cells were pressurised and completed when the maximum working pressure could not maintain the load due to excessive displacement. The upper O-cells were then unloaded and the hydraulic circuit for the upper O-cells left open to drain in Stage 2.
Stage 2 load test commenced immediately after Stage 1. The lower O-cells were pressurised and the loading was halted when the maximum working pressure could not maintain the load due to excessive displacement. The lower O-cells were then unloaded and the whole test concluded.
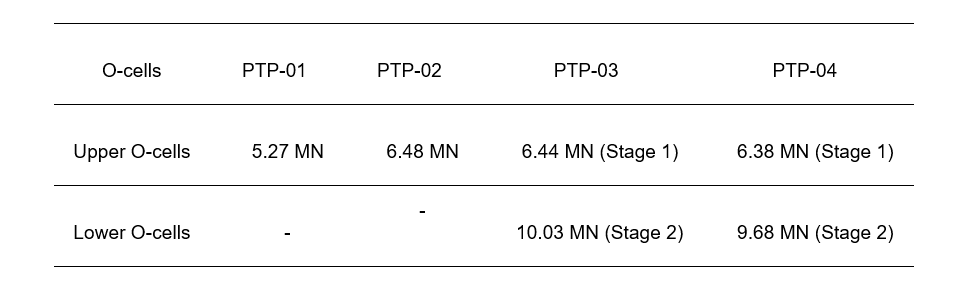
The O-cells maximum loadings in the tests are shown in Table 3. The test loads for PTP-01 and PTP-02 were applied at ten equal increments to maximum test loads. Stage 1 test loads for PTP-03 and PTP-04 were applied at sixteen equal increments to maximum test loads.
Stage 2 test loads for PTP-03 and PTP-04 were applied at fourteen equal increments to maximum test loads.
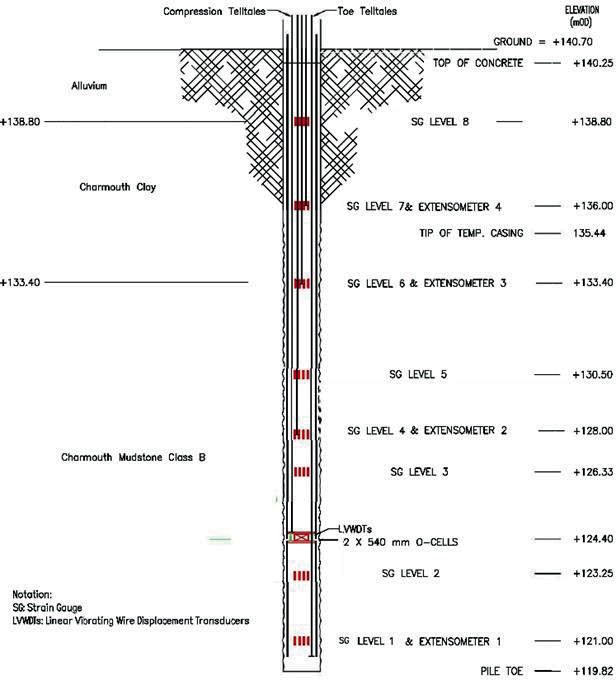
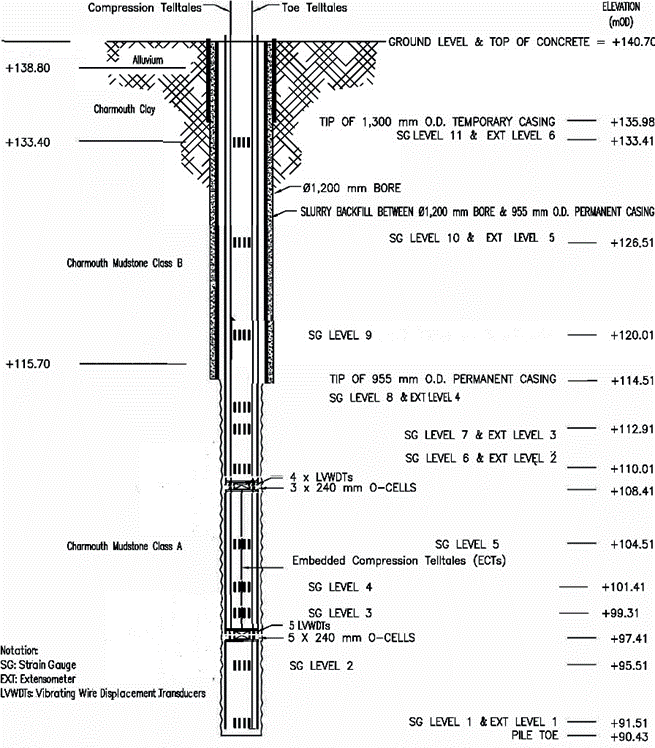
The piles were heavily instrumented with strain gauges (SG) and extensometers and monitored during testing as depicted in Figure 3. Displacements at the top of piles were monitored using displacement transducers attached to a reference beam.
Test results and discussion
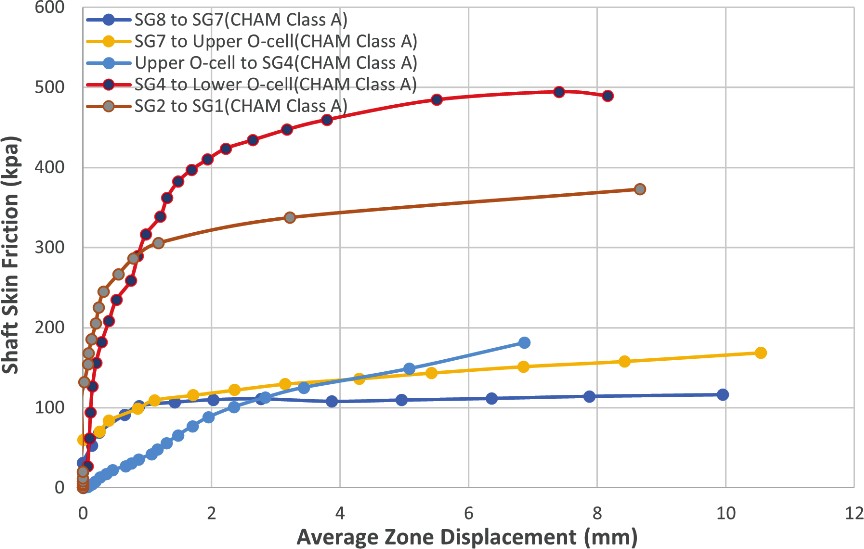
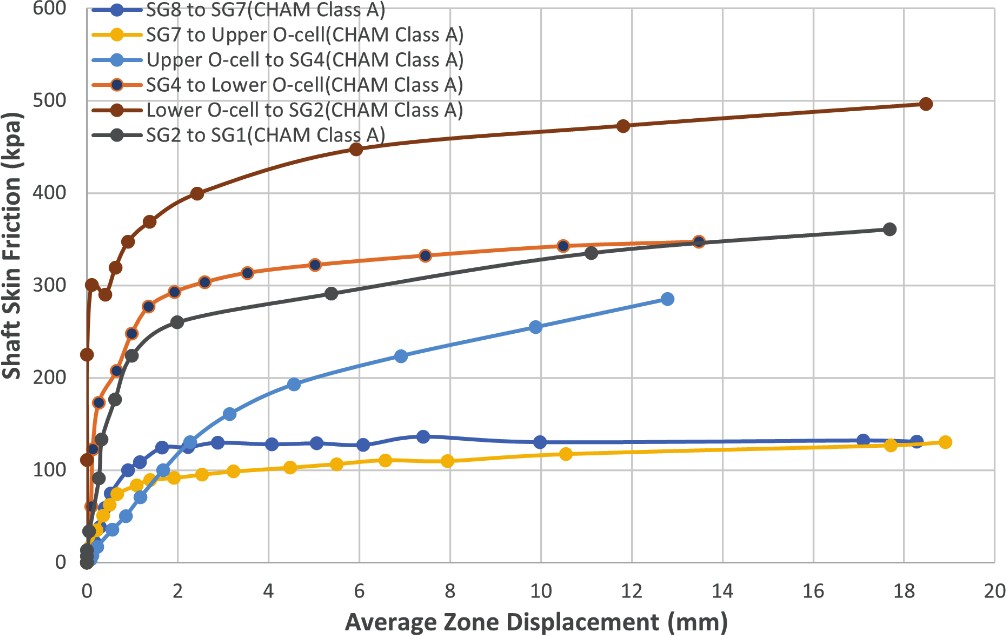
The t-z curves for the soil layers at various elevations in test piles PTP-01 to PTP-04 are given in Figures 4-7, respectively.
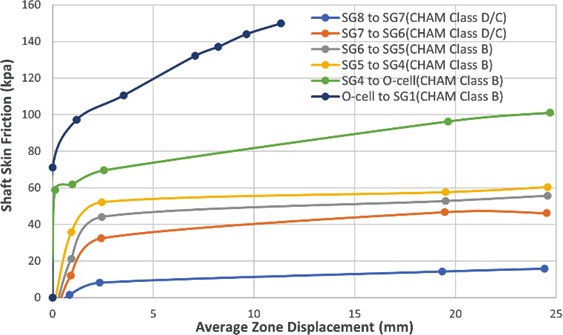
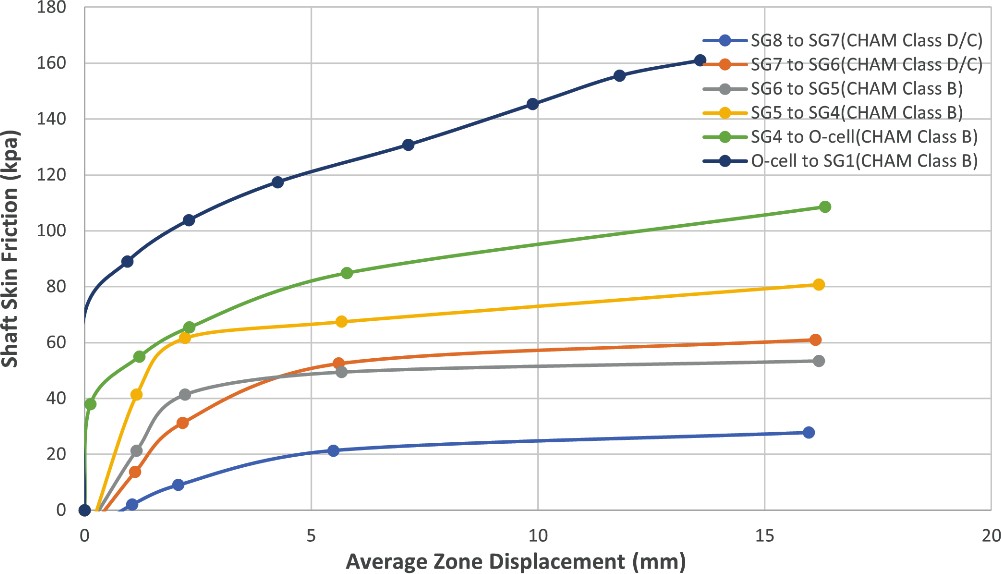
The test results in piles PTP-01 and PTP-02 show that the unit shaft frictional resistance for the CHAM Class D firm and stiff clay layer varied from 40 kPa to 60 kPa. The measured unit shaft frictional resistances for the top zone between SG8 and SG7 was around 20 kPa.
These low test values may be ascribed to existence of weak Alluvium, shown to overlie CHAM at the test site, and the positions of SG8 and SG7 which are close to the ground surface.
The test results show that the unit shaft frictional resistance for the CHAM Class B layer increased with depth. The unit shaft frictional resistance of the CHAM Class B reached between 100 kPa and 150 kPa.
The test results in piles PTP-03 and PTP-04 show that the shaft frictional resistance for the CHAM Class A layer increased from 100 kPa at a depth of 30 m to 500 kPa at a depth of 50 m, which reflects the increase of Uniaxial Compressive Strength (UCS) of CHAM Class A with depth.
The test t-z curves show that the shaft frictional resistance and the displacement relationships for CHAM layers could be represented with a bilinear model. The corresponding displacement for full mobilization of shaft resistance was typically 2 to 3 mm for the CHAM, and it reached 5 to 6 mm for the CHAM Class A below 40 m depth. The test t- z curves for CHAM do not exhibit softening behaviour after mobilisation of the peak skin friction.
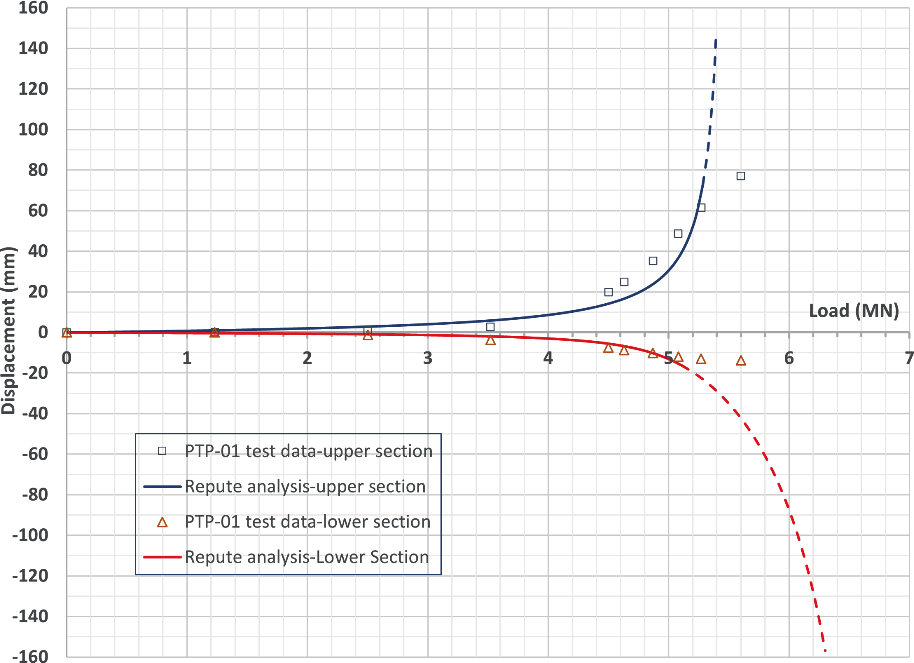
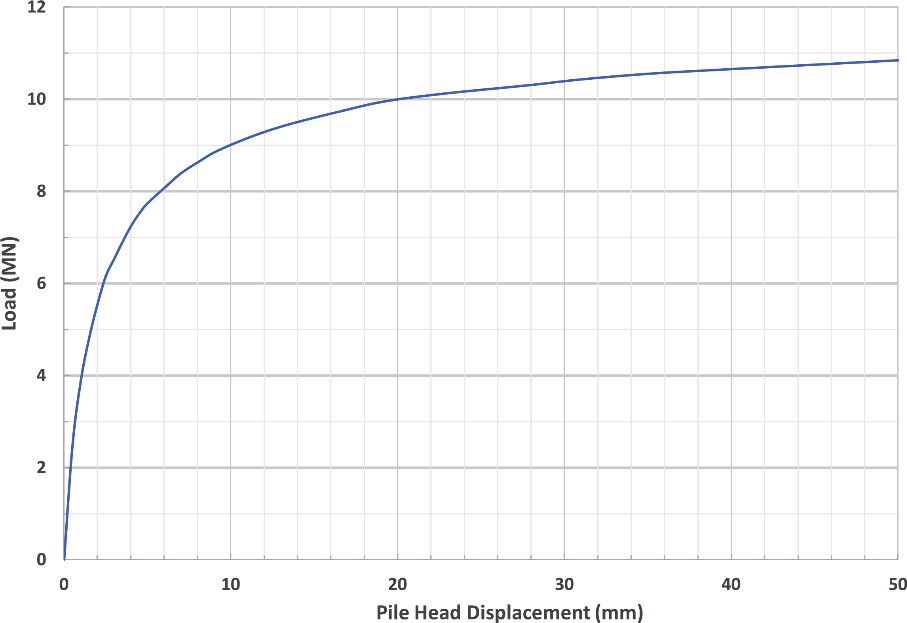
Equivalent top-loaded load-settlement curves were constructed from the results of the O-cell tests using hyperbolic functions to describe shaft and base performance in the method developed by Fleming, 1992[13]. Fleming’s analysis in Repute 2.5 Release 11[14] was used to simulate the pile behaviour and load-displacement curves for the pile sections above and below the O-cells were determined. Figure 8 shows the load-displacement curves from Fleming’s analysis and the pile test data for PTP-01.
The components of Fleming’s analysis have been combined to estimate the behaviour of the full length of the pile under a load applied at the pile head. The load-displacement curves for the pile sections above and below the O-cells in Figure 8 were combined to generate the equivalent top load versus pile head displacement curve for the whole pile section using the
method as described by Fleming et al.[15]. The equivalent top-loaded load-settlement curve for Pile PTP-01 is shown in Figure 9.
Schmertmann and Hayes, 1997[16] compared O-Cell tests to bored pile testing and suggested that the compression of a pile is generally between 1 and 3mm and can be considered negligible when determining an equivalent top load-settlement curve. The difference in elastic compression between the top-loaded test and the O-cell test was not included in the equivalent top-loaded load-settlement curve in Figure 9.
Analysis of pile behaviour under heave
The preliminary pile load tests provided the pile unit shaft frictional resistances in CHAM and the yield displacements for full mobilization of shaft resistance. These are the basic input parameters used in the t-z curve method.
Ground heave movements resulting from the excavation are also required as inputs in the t- z curve method analysis but ground heave could not be simulated in the preliminary pile load tests. Finite Element (FE) analysis, therefore, has been used to simulate the excavation and estimate the ground heave due to excavation in HS2 project.
The t-z curve method is relatively simple for pile heave analysis compared with the FE analysis. The use of the t-z curve method speeds up the pile design process and saves time and design cost. To ensure that the t-z curve method provides a safe design, the pile movements and pile tensile forces obtained from the t-z curve method analysis are compared with those obtained from a 3D FE model with a single pile in a deep cutting in CHAM.
The three-dimension FE program Plaxis 3D was used for the single pile analysis in the deep cutting. The Hardening Soil Model with small-strain stiffness (HSsmall) in Plaxis was used to model CHAM. The Undrained (A) approach available in Plaxis analysis was adopted to model the undrained behaviour of the CHAM. The Undrained (A) approach uses effective stress parameters for stiffness and strength in the analysis.
Laboratory soil test data for the preliminary pile test site is limited. The parameters for the HSsmall model of CHAM were determined based on ground investigation and laboratory tests carried out across the Boddington area of the HS2 route. The ranges of soil strength and stiffness parameters for CHAM were presented in the analysis for Boddington Cutting Heave Trial[12] based on route-wide ground investigation data.
In order to verify and optimise the soil parameters of CHAM in the Plaxis analysis, back- analysis of the preliminary test piles was carried out in Plaxis 3D. The load-displacement curve obtained from Plaxis 3D analysis was compared to the obtained equivalent top loaded load-displacement curve in the preliminary pile load tests.
Figure 10 shows the comparison of load-displacement curves which were obtained from the test data and analysed from the Plaxis 3D analysis for Pile PTP-01.
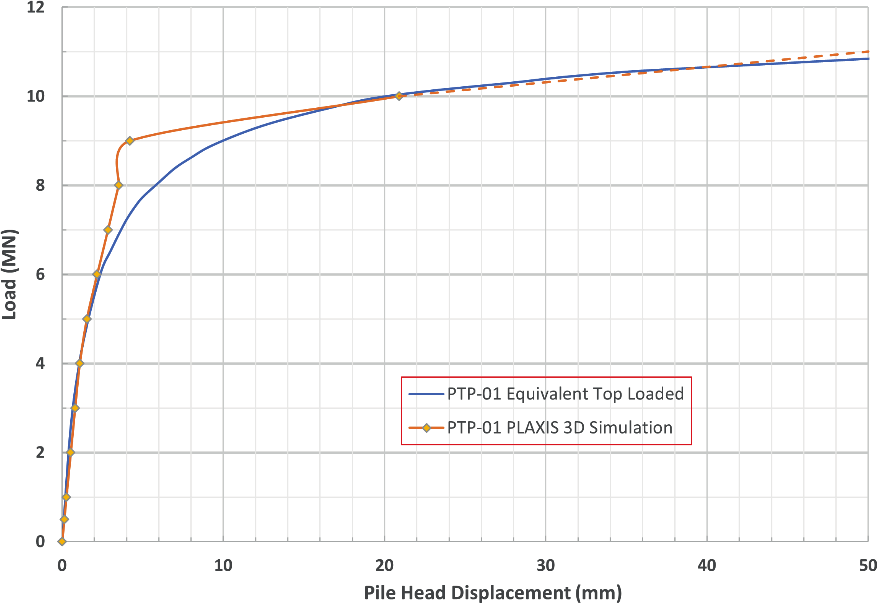
The extension of the load-displacement curve from Plaxis analysis in Figure 10 is close to the load-displacement curve derived from the test data. The close match of the load- displacement curves from the tests and from the Plaxis 3D analysis indicates that the HSsmall soil model for CHAM used in the Plaxis is appropriate. The soil parameters for CHAM used in the Plaxis 3D pile heave analysis are shown in Table 4.
A 900 mm Dia. 30.0 m long pile was assumed in the analysis. The pile was modelled as a volume element in the FE analysis. An interface was added between the volume pile and soils and full interaction with the adjacent soils was assumed. The elastic material type was used for the bored concrete pile with a long-term Young’s modulus E of 24.0 GPa. The pile was assumed to be installed after the excavation reaches the final excavation level. An excavation depth of 14.0 m was assumed in the FE analysis. The groundwater level was assumed to be 20.0 m below the ground surface in the FE analysis based on the piezometer sensor measurements at the site of Boddington Cutting Heave Trial.
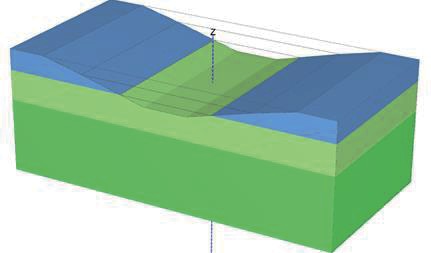
Figure 11 shows the Plaxis 3D model when the excavation is completed. The single pile is installed after the excavation and is placed in the middle position of the excavation.
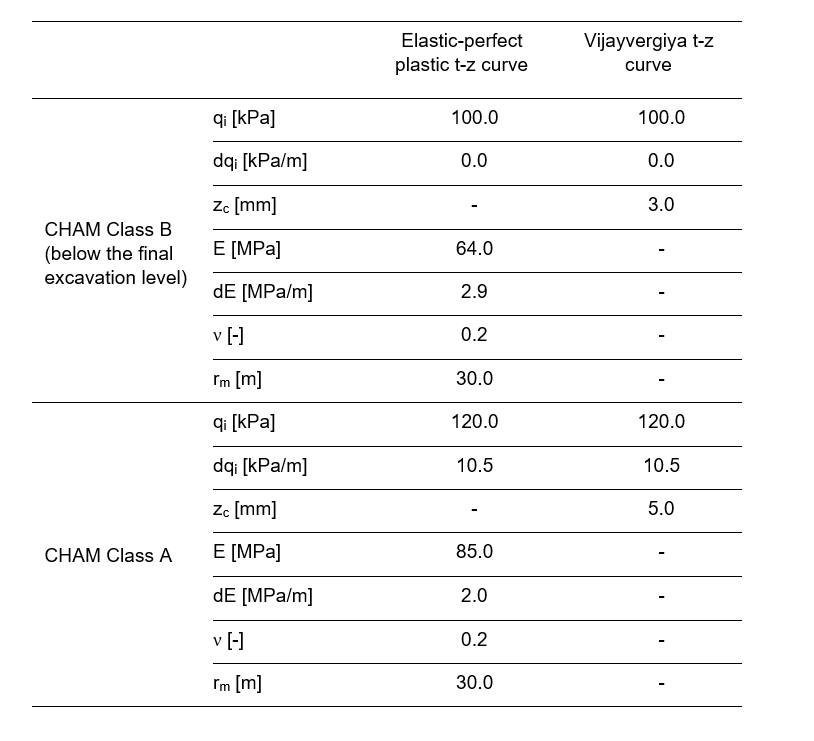
Two types of t-z curve available in Oasys Pile were chosen for the analysis: one was the elastic-perfect plastic t-z curve (Randolph & Wroth, 1978)[6] and the other was the parabolic t-z curve (Vijayvergiya, 1977)[9].
The Elastic-perfect plastic t-z curve is characterized by a constant stiffness until yield, and the stiffness is zero thereafter. A typical elastic-perfect plastic t-z curve was used to represent the test t-z curves. The inputs of soil stiffness were determined based on the properties of HSsmall models used in the Plaxis 3D analysis and the relationship between E ref and E as advised in Plaxis Material Models Manual[17].
The empirical parabolic t-z curve by Vijayvergiya[9] requires an input of corresponding displacement zc for full mobilization of shaft friction. zc of 3 mm was adopted for CHAM Class B and zc of 5 mm was adopted for CHAM Class A in the analysis. The shaft frictional resistances q were derived from the pile test results.
The input parameters for both t-z curves in the Oasys Pile analysis[18] are presented in Table 5. The values of E in Table 5 were calculated based on the properties of the HSsmall models which were used in the Plaxis analysis. The values of rm were calculated based on the method suggested by Randolph & Wroth, 1978[6].
The pile moved upward under the impact of ground heave movements. Figure 12 shows the movements at the section which crosses the pile and the cutting. It is shown that both the pile and the ground move upward. The inclusion of the pile changes the ground heave profile. The pile upward movement is less than the maximum ground heave movement. The maximum ground heave occurred at an offset from the pile in the middle of the cutting. It is expected that the ground heave movements close to the pile would be less than the estimated ‘free-field’ ground heave movements without the pile.
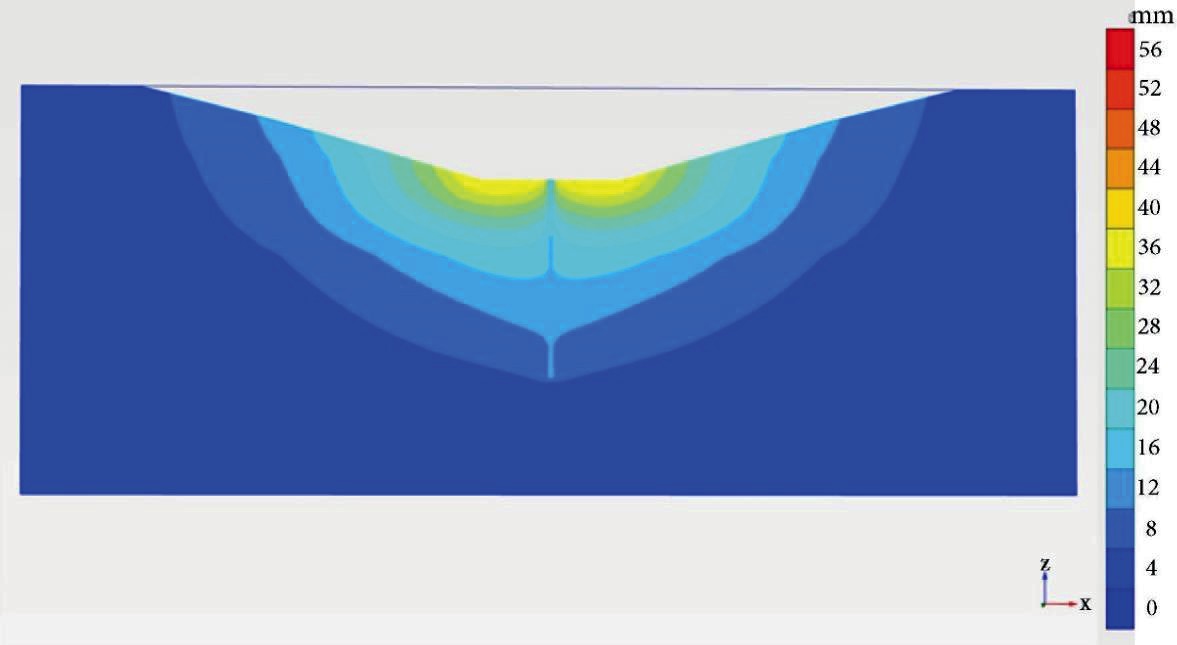
Figure 13 presents the pile upward movements obtained from Plaxis 3D analysis and t-z curve method analysis. The calculated pile displacements from Plaxis 3D analysis and t-z curve method analysis are in close agreement. The percentage difference of the pile head displacements between the Plaxis 3D analysis and the Elastic-perfect plastic t-z curve analysis is less than 5%, and the percentage difference of the pile head displacements between the Plaxis 3D analysis and the parabolic Vijayvergiya t-z curve analysis is less than 10%.
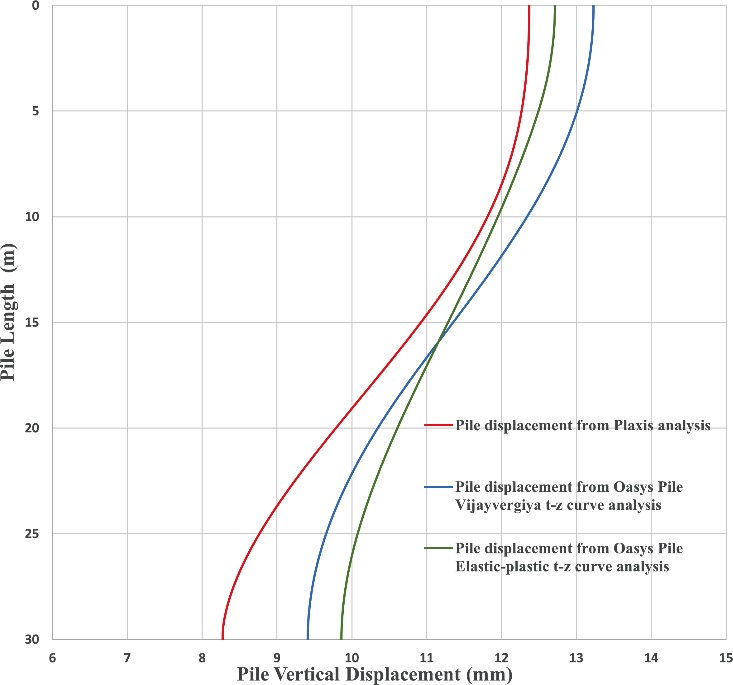
Figure 14 shows the calculated pile axial tensile forces from Plaxis 3D analysis and t-z curve method analysis. The maximum tensile force predicted by the Vijayvergiya t-z curve is higher than that from the Plaxis 3D analysis. The percentage difference of the maximum pile tensile force between the Plaxis 3D analysis and the Vijayvergiya t-z curve analysis is less than 20%. The maximum tensile force predicted by the Elastic-perfect plastic t-z curve is lower than that from the Plaxis 3D analysis. The Vijayvergiya t-z curve was taken forward in the design in HS2 project.
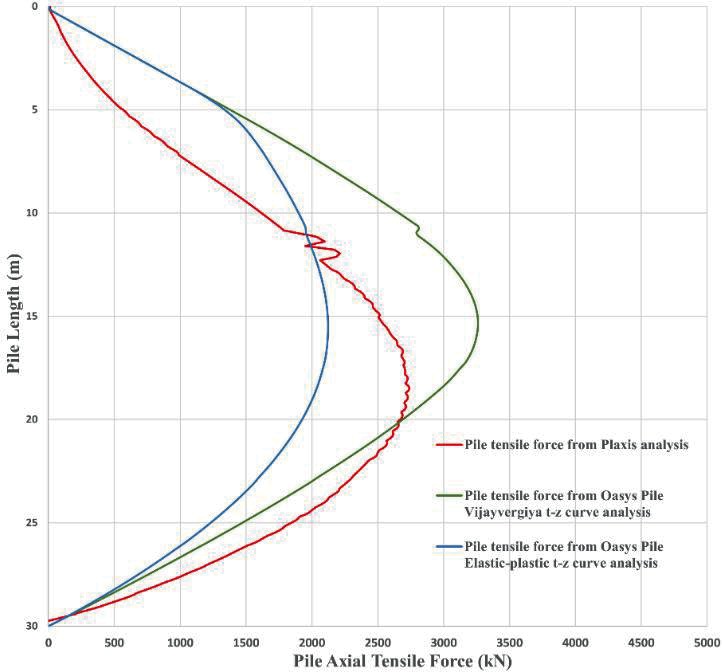
Figure 14 shows that the level of the analysed neutral plane from Plaxis 3D analysis is slightly lower than that for t-z curve method analysis. The depths of the obtained neutral planes from both t-z curve methods are 15.5 m below the pile head. The neutral plane from the Plaxis 3D analysis is 18.5 m below the pile head.
The FE 3D analysis is complex and time consuming. The t-z curve method is relatively simple and provides an alternative for pile heave analysis. The comparisons of the analysed pile upward movements and pile tensile forces in Figures 13 & 14 show that the parabolic Vijayvergiya t-z curve provides conservative, yet reasonable, estimates of the pile head upward movement and the pile tensile force. This analysis conclusion verifies the use of a Vijayvergiya t-z curve in the preliminary design of piles subjected to excavation-induced heave.
The appropriate inputs of ground heave movements, the choice of the t-z curve and the soil parameters defining the chosen t-z curve are critical for obtaining satisfactory analysis results. Further analysis will be carried out to define appropriate soil parameters for ground heave analysis in conjunction with further ground investigation data. Additional work is required to check if the observations for the CHAM are applicable to other stiff over- consolidated clays such as the London Clay, the Gault Clay and the Oxford Clay which are also encountered in deep excavations in HS2 Phase One.
Summary and conclusions
The study involved a series of preliminary load test piles in Charmouth Mudstone. The preliminary pile load test results showed that the unit shaft frictional resistance for CHAM was variable and could be related to the weathering grade. The measured unit shaft frictional resistances varied between 40 and 60 kPa for CHAM Class D and between 100 and 150 kPa for CHAM Class B. The measured unit shaft frictional resistance for CHAM Class A was higher than 100 kPa and reached 500 kPa at a depth of 50 m.
The obtained t-z curves for CHAM from pile load test results are close to bilinear curves. The corresponding displacement for full mobilization of pile shaft resistance was 2 to 3 mm for the CHAM Class D-B, and it increased to 6 mm for the CHAM Class A below 40 m depth.
There is a dearth of research and design guidance for piles in CHAM. The preliminary pile load test results and the derivations in the paper provide valuable information to the wider industry for the future design of piles in CHAM.
The pile response to excavation-induced vertical heave was analysed using Plaxis 3D and the t-z curve methods including the elastic-perfect plastic t-z curve and the parabolic Vijayvergiya t-z curve. The preliminary pile load test results were used in determining the parameters defining the t-z curves and the unit shaft frictional resistances for the CHAM.
A comparison of the analysis results showed that the Vijayvergiya t-z curve method provided conservative, yet reasonable, estimates of pile response in term of the pile upward movement and the pile tensile force. The maximum pile tensile force estimated from the Elastic-perfect plastic t-z curve is less than that from the Plaxis 3D analysis. The estimated pile head upward movement and the maximum pile tensile force from the Vijayvergiya t-z curve are higher than those estimated from the Elastic-perfect plastic t-z curve.
The Plaxis 3D analysis showed that the inclusion of the pile changed the ground heave profile at the excavation level. The pile head upward movement was less than the maximum ground heave movement. The majority of ground heave occurred several meters away from the pile. The ground heave movements close to the pile would be less than the estimated ‘free-field’ ground heave movements without the pile.
The results of this study verified the use of the t-z cure method in the preliminary design of piles to resist vertical ground heave at HS2 Boddington cutting. The specific t-z curve for CHAM would improve the accuracy of the analysis. The specific t-z curve for CHAM could be created with further pile load test data.
One of the key parameters in the pile heave analysis is the ground heave movement. Ground heave could not be simulated in the current preliminary pile load tests. At the current stage, reliance has to be placed on the FE analysis to estimate the ground heave movements. It is proposed in the future study to test the working piles from the start of the excavation measuring the forces and displacements of piles and compare them with the t-z curve method analysis results. This study is to extend to other stiff over-consolidated clays including the London Clay, the Gault Clay and the Oxford Clay in HS2 Phase One.
Acknowledgments
The present study was carried out as part of the design work on HS2 Phase One. The authors would like to acknowledge the support of HS2 Ltd and Eiffage, Kier, Ferrovial Construction and BAM Nuttall (EKFB) Joint Venture for permission to use pile load test data.
References
[1] McNamara, A. M. and Taylor R. N. (2002). Use of heave reducing piles to control ground movement around deep excavations. Proc. 3rd International Symposium on Geotechnical Aspects of Underground Construction in Soft Ground, Toulouse, France, 569-574.
[2] O’Reilly M.P. and Al-Tabbaa, A. (1990). Heave induced pile tension: a simple one-dimensional analysis. Ground Engineering, 28-32.
[3] Lee, C. J., Al-Yabbaa, A. and Bolton, M. D. (2001). Development of tensile force in piles in swelling ground. Proc. 3rd International Conference on Soft Soil Engineering, Hong Kong, 345-350.
[4] Seed, H.B., and Reese, L.C. (1957). The Action of Soft Clay along Friction Piles. Transactions, ASCE 122, 731-754.
[5] Coyle, H.M., and Reese, L.C. (1966). Load Transfer for Axially Loaded Piles in Clay. Journal of the Soil Mechanics and Foundation Division, ASCE 92, 1-26.
[6] Randolph, M. F., and Wroth, C. P. (1978). Analysis of deformation of vertically loaded piles. Journal of Geotech. Geoenviron. Eng., 104(12), 1465–1488.
[7] Chin, J. T. and Poulos, H. G. (1991). A “TZ” approach for cyclic axial loading analysis of single piles. Computers and Geotechnics, 12(4), pp.289-320.
[8] Puzrin, A.M., AND Burland, J.B. (1996). A logarithmic stress-strain function for rocks and soils. Geotechnique 46, 157-164.
[9] Vijayvergiya, V. N. (1977). Load-movement characteristics of piles. Ports ‘77: 4th Annual Symp. of the Waterway, Port, Coastal, and Ocean Division, ASCE, Los Angeles, 269–284.
[10] Frank, R. (1985). Recent developments in the prediction of pile behaviour from pressuremeter tests. From theory to practice on deep foundations, UFRGS, Porto Alegre, Brazil.
[11] Hobbs, P. R. N. et al. (2012). Engineering Geology of British Rocks and Soils – Lias Group. Internal Report OR/12/032, British Geological Survey UK.
[12] Boddington Cutting Heave Trial – Preconstruction Assessment of Heave, 1MC07-CEK-GT-REP-CS07_CL14-000013, Revision C01(2019), HS2.
[13] Fleming, W.G.K. (1992). A new method for single pile settlement prediction and analysis, Geotechnique 42, No.3, 411-425.
[14] Repute 2.5 Reference Manual, Geocentrix, July 2021.
[15] Fleming, K., Weltman, A., Randolph, M. and Elson, K. (2009) Piling Engineering, 3rd Edition, Talyor & Francis.
[16] Schmertmann, J. H. & Hayes, J. A. (1997). The Osterberg Cell and Bored Pile Testing – A Symbiosis, Proceedings: 3rd International Geotechnical Engineering Conference, Cairo University, Cairo, Egypt, 139-166.
[17] Plaxis Material Models Manual, Connect Edition V21.00, December 2020.
[18] Oasys Pile 19.7 Manual, October 2018.
Peer review
- Chrysanthi TrygousiHS2 Ltd
- Nick SartainHS2 Ltd