Landmark and passenger experience study
Project: Provision of a series of customer focused Virtual Reality Simulation sessions for the Phase One and 2a hybrid Bill Design, commissioned as part of two Passenger Experience and Landmark Studies carried out by Arup for HS2. These simulations are supported by the project sponsor and the HS2 Independent Design Panel. This work is central to the core tenets of the HS2 Design Vision – People, Place, Time.
Background: In 2016, HS2’s Design Team commissioned a landmark study to test the Phase One hybrid Bill design from the passenger’s perspective. This was then developed into a virtually simulated experience along a 10km section of the route using a methodology that accurately simulates a passenger’s journey on HS2. It was shared extensively across HS2 Ltd and supply chain during summer 2018. A second study and virtual reality simulation was commissioned in 2018 for a 30km stretch of the Phase 2a hybrid Bill design. The technology available progressed since the Phase One study and new interventions were simulated. HS2 Design team commissioned the presentation of an extensive series of sessions demonstrating the Phase One and Phase 2a VR simulation to key groups working on the respective route sections.
Objective: Whilst it is essential to mitigate effects identified in the Environmental Statement, we have a duty to the sponsor and our customers to create a memorable and enjoyable passenger experience. This includes considering the potential for views of landmarks and landscapes, the impacts of design decisions made and importantly the timing of those decisions.
- Written by
-
Christoph Brintrup (HS2 Ltd)

- Resource type
- Resource type: Technical Paper
- Intended audience
- Consultants
- Tags
- Landmark & Passenger Experience, Landscape Design, Landscape Architecture, Passenger Experience, Train Journey, Virtual Reality posts
Introduction
Some travel by train for convenience, others for experience. The landscapes that form part of these train journeys are fundamental to creating a memorable experience when riding a train. However, travelling at up to 360kph (or 100m/second) results in a radical shift in our perception of objects in the landscape. Both distance and scale change drastically in relation to the speed of the train.
When asked how travellers would spend their time on a high-speed rail journey of up to 1.5 hours, around half of respondents said they would ‘gaze out of the window’[1]. As such, the views passengers are presented with when traveling on High Speed Two (HS2) trains are a key factor influencing how memorable their train journey would be.
In 2016, HS2 Ltd commissioned Ove Arup and Partners Limited (Arup) to conduct a study that would explore the role of the ‘View from the Train’ in design development and what opportunities might be possible to create memorable passenger experiences as part of an integrated scheme design.
The study explored how the experience of the landscape on a train journey can influence all aspects of the design of the railway. The study was divided into two stages.
Stage 1 developed a methodology of applied landscape characterisation and visual appraisal to identify potential views in motion and landmarks across the route. These determined the temporal extent of visibility and whether locations could be taken forward for modelling.
Stage 2 took forward the locations from the first study and developed a programme of landscape design with digital interventions that were represented in a VR simulation. The VR simulation recreated as realistically as possible what the experience of travelling on HS2 would look like at maximum design speed.
The passenger experience
Creation of a memorable and enjoyable passenger experience on trains is vital for the economic success of rail travel. This was a key message in an extensive survey that was undertaken by McKinsey in 2018 [2] and where the relationship between high user experience and increased revenue growth was highlighted. HS2 will have competitors such as other train operators, cars and aircrafts, and to remain viable it must be an attractive, valued option for travellers and commuters.
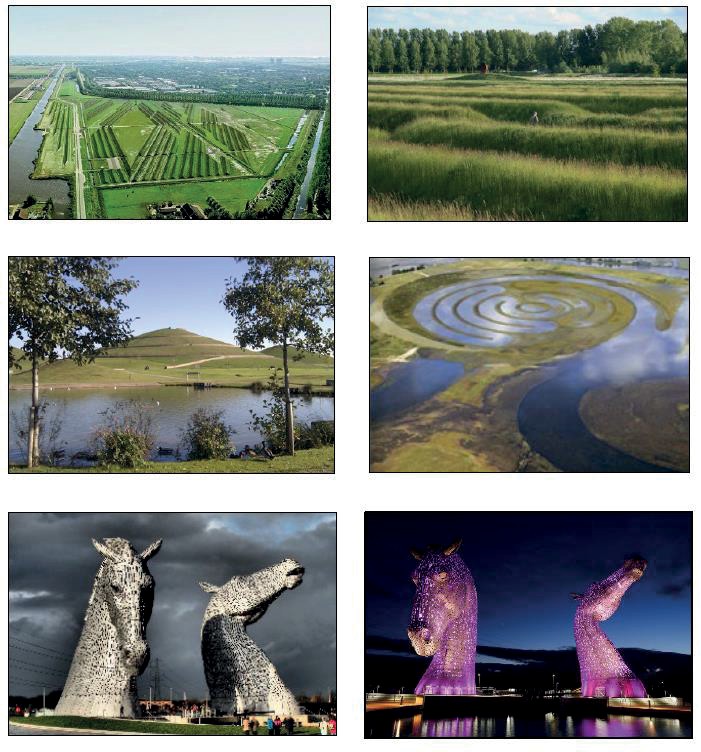
Creating a memorable train journey leads to direct benefits for the HS2 project. First, it can increase ridership, boosting future revenues. Second, it has be ability to encourage tourism by promoting communities located along the train route. Third, it can create new destinations and landmarks that support local communities and in some cases might become symbols of a specific region (e.g. Angel of the North, Gateshead).
Other countries have successfully used train travel as a way to ‘experience’ the country. The Eastern & Oriental Express connecting Singapore through Malaysia to Bangkok is a 1,200- mile journey. Despite low-cost flights connecting these cities, travellers often deliberately choose to travel by train, despite the much longer journey in order to enjoy the interior of the Eastern countries. Closer to home, the popularity of the ‘Eurorail’ pass in Europe among backpackers has become a hallmark of young travellers spending their gap years exploring Europe who avoid driving and flying to experience backpacking across Europe by train.
As Britain’s premier high-speed rail project, HS2 has the potential to position itself as a ‘brand’ for experiencing Britain. One way to encourage more people to use HS2 as an alternative to flying or driving is to create a memorable experience out of the trip.
Factors influencing the passenger experience
Before commencing work on the study, thoughts on what the passenger experience could be were brainstormed, including questions such as:
- How could ‘Britain’ be “sold” through the passenger experience?
- How could the history of the railway/landscape heritage be revealed along the route?
- How could layers of information for people interested in geology/hydrology be shown?
- How might passengers keep up with and notice future change?
- How could a sense of orientation be provided and/or visual experiences?
- How could the landscape be made more interesting? (swathes of planting, land art, art on noise barriers, positioning of trees to create flip book animations effect/channel views, landmarks etc)
- What are the views from the landscape looking back towards the train? How can HS2 be celebrated?
- How could the experience of speed be conveyed so passengers understand how fast they are going?
- How could an informative/educational element to the journey be incorporated and a playful element to entertain both children and adults along the journey?
Another point to consider were passenger demographics. Who, why, when, where, and how frequently people might travel would differ significantly for a regular commuter and a family traveling for leisure purposes.
Experiential components such as the speed and direction of travel, sensory factors (taste, temperature, smell, sound, visual, vibration and touch), the weather, seasons, travelling during the day or at night, whether it’s light or dark, or peak or off-peak, the passenger’s mood and wellbeing and interaction with other passengers/train crew and the seating position within the carriage (left or right-hand side, forward or backward facing, aisle or window and the changing view looking out from the train) were also taken into account.
These could vary considerably, add variety and interest to a journey and have an impact on the overall passenger experience. This is in contrast to the number of physical/environmental elements to the journey which will remain relatively unchanged on a day-to-day basis such as the townscape, town edge, natural environment (discounting seasonal variations), experience within cuttings and behind noise barriers and open views at grade, on embankments or viaducts.
The above happen regardless of whether some form of intervention is incorporated into the landscape to enhance the passenger experience, which also adds an element of variety to the journey.
Design Interventions
To further enhance this experience, interventions that could be applied to the journey were considered. These were broadly split into changes to the physical environment (landmarks and land art) and entertainment or diversions through digital means inside the carriage:
The potential for passenger experience via digital means includes display of real time information and a mixed reality approach of interactive screens applied to windows, tables, visualiser apps, even potentially holograms. It is important that these are optional, with a degree of customisation to suit the individual, to provide the maximum benefit and degree of choice for the passenger.
Projections from and onto the train and or tunnels could also be possible noting that the type of imagery and the psychology of the pictures projected would need to be carefully considered. The feasibility of this approach would also need to be thought through thoroughly in relation to ongoing maintenance requirements for instance. This would also present a potential scope for advertising opportunities within tunnels for example.
Circadian/personal lighting were also factors that were considered, however, as this relates more to the internal environment of the train these were discounted for the purposes of this study. HS2 Ltd has commissioned a separate study for the design of and passenger experience within the train itself therefore only an indicative train interior was included within the VR stimulation.
Methodology
Approach
The Landmark and Passenger Experience Study was developed in two linked stages:
Stage 1: Methodology and scoping: Analysis and identification of potential locations to take forward as a basis for design interventions to communicate opportunities
Stage 2: Creative and imaginative proposals: Taking forward a short-listed set of locations to model and represent in a simulation – a fully immersive augmented reality ‘virtual train’ environment, to provide the experiential/legacy evidence for investment in landscape.
Concept of ‘motion parallax’ (Kevin Lynch)
The idea of representing passenger experience of the landscapes through which they travel on a high-speed rail journey brings with it a unique set of challenges, not least:
What might meaningfully be legible, visible and for how long when travelling at maximum design speed of 100 metres per second.
The key considerations here are therefore proximity, distance and the scale of the objects in question, whether existing features or proposed new design interventions.
Some of these questions were posed in a much earlier landscape planning study by US urban planner and designer Kevin Lynch (1918-84), when he co-devised a methodology to influence the design coding and design language for passenger experience of US freeways, working with Donald Appleyard and John R Myer in their seminal but now little-known collaboration View From The Road [3].
Key principles that Lynch, Appleyard and Myer explored were the sense of motion (real and apparent, or ‘dynamic motion’), the sense of self and place and the role of route alignments in creating anticipation and experience. The relationship between distance and scale was also a key consideration and Lynch’s approach formed the theoretical background the study was based on.
Given that trains travel at considerable speed, there was a need to consider the design and position of features within the landscape, views of which contribute to passenger experience.
The relationship, between distance, scale and speed, is known as ‘motion parallax’ – a theory for understanding the relative speed of objects in a scene crossing the field of view as a cue for distance in order to help create a legible design. Understanding these cues for distance is vital in creating a legible design.
In the context of HS2 this is significant, since everything in the foreground will either be a blur or would need to be of such a scale as to either be unviable as a design intervention/narrative, or else would create highly abstract swathes of colour, shape, light and shadow – stroboscopic effects (particularly when viewed through the noise barriers or in the context of the vertical alignment changes on the route). These in themselves could be interesting, but it is really ‘beyond the red line’ where opportunities for interesting design opportunities lie, e.g. those which could be realised effectively at 100m/s, that is, at distance.
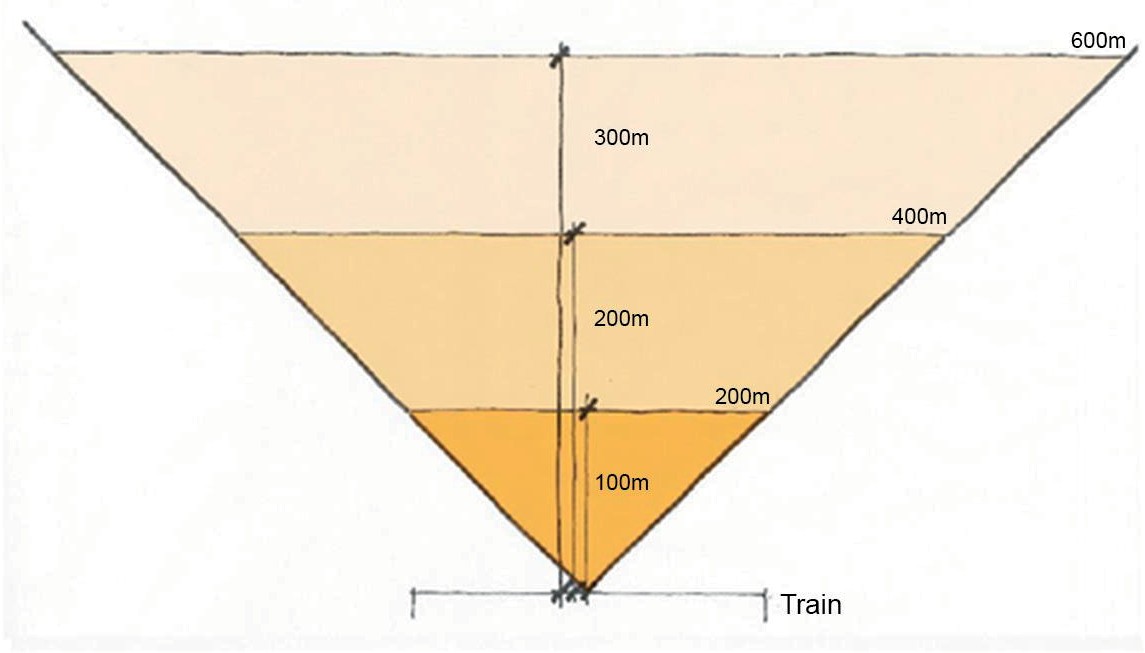
To achieve this, there was a need to understand the speed of the train at different points along the route and to apply a calculation of distance against time to create a series of
distance bands which indicated the approximate amount of time it would take for an object at each distance to pass across the view.
Figure 1 represents what would be notionally visible, and for how long, when the train is travelling at its maximum design speed of 360/km/h. This shows indicatively that approximately 6 seconds of view would be visible at 600 metres.
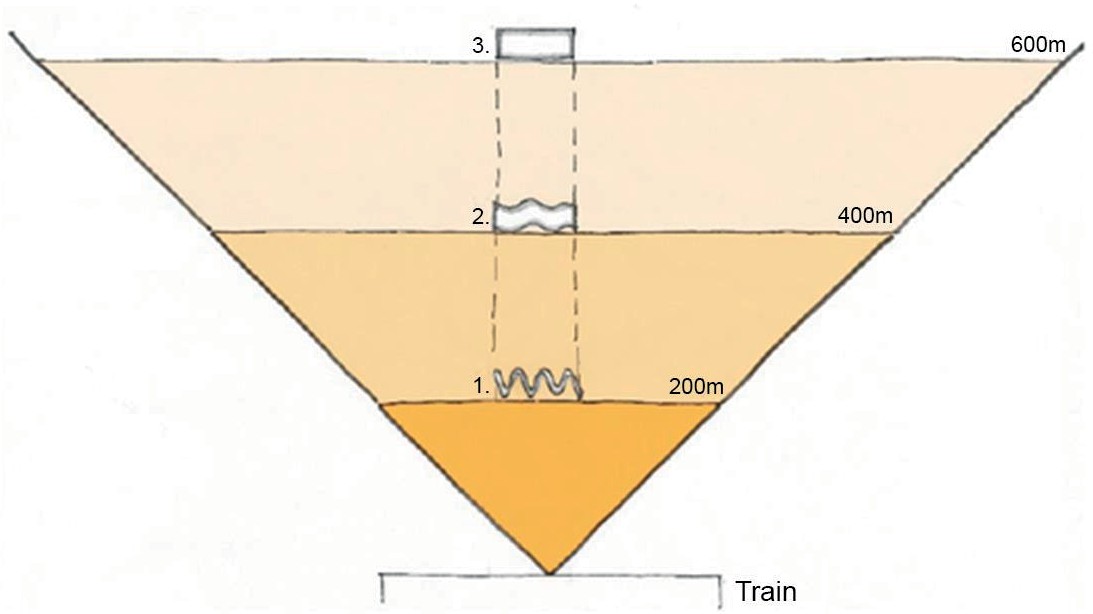
Calculating visibility from the train
To take account of motion parallax, the following distance buffers were applied to the route in line with the notional field of view principles shown in Figure 1 and Figure 2. The distance buffers were judged appropriate based on consideration of the relationship between distance, speed and time: 0-250 m, 251-500 m, 501-750 m, 751-1000 m, 1001-1500 m,
1501-2000 m, 2001-2500 m and 250-3000 m.
5m resolution Digital Terrain Model (DTM) data was used for the buffers within the 3km corridor to ensure appropriate accuracy of information/modelling. The majority of the route was modelled to 3km (based on available DTM data due to the cost of purchasing additional data).
The key challenge was how to model this, given the speed of the train to robustly scope in or out possible assets or sites for interventions. A Geographical Information System (GIS) application was used as the primary tool – Zone of Theoretical Visibility (ZTV) models (more usually used to set the parameters of Landscape Visual Impact Assessments) based on the vertical alignment height of the route plus train carriage and passenger height, were built based both on the basic engineering design and earthworks and also on the fully mitigated, landscape designed scheme. By using maximum/minimum extent of visibility in the ZTV and combining the design speed of the train, the study was able to quickly, simply and clearly identify potential locations of interest for consideration of design amendments in relation to the mitigation design.
Desktop Study
This was completed in 4 key stages.
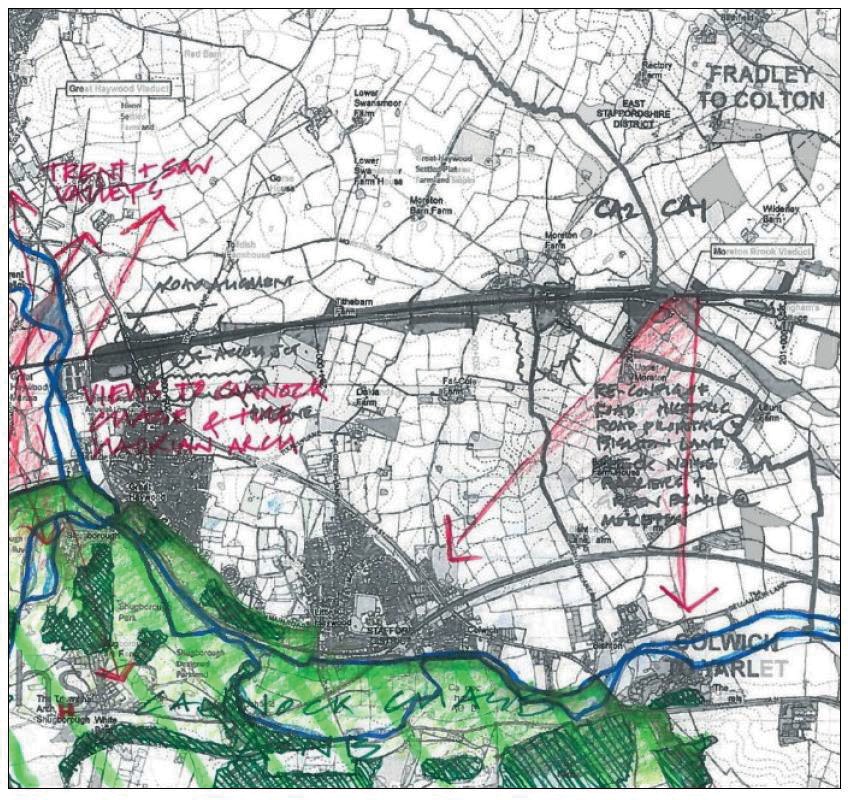
First stage – mapping
The first stage focused on the creation of base mapping to identify potential assets/landmarks on which to focus. Assets along the route, apart from where the train would be in tunnels or deep cutting, were identified and recorded. These included a mix of elements such as registered historic parks and gardens, Grade 1 listed buildings, sites on the Sites and Monuments Record and prominent landscape features. This list also included features which could aid orientation, but which may not necessarily be recognised as assets,
e.g. telecommunications masts/aerials, power stations, edges of large conurbations or prominent industrial features. Once assets and features were identified, they were analysed and scoped into a long list of potential opportunities by Community Area and categorised as potential landmarks/assets into a typology. The parameters for asset and feature mapping were defined by the extents of data available for the studies which was a 3km route corridor for both Phases.
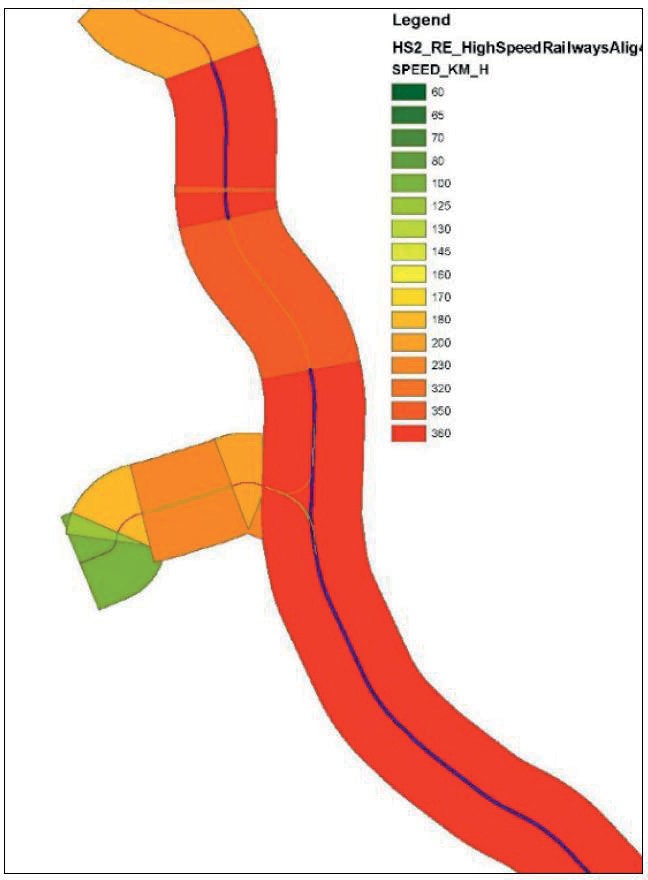
Second stage – GIS
The second stage focused on defining the ZVT analysis parameters which provided the basis for modelling the ZTVs. ZTV is a computer-generated tool used to identify the likely (or theoretical) extent of visibility of an intervention, development or feature in a landscape. The elevation, or set of elevations, of the intervention, development or feature (in this case the train itself), is tested against a 3D terrain model. In ArcGIS Spatial Analyst, sections of the route which are at grade or on embankment were identified from which to run the ZTVs. In addition, the average eye level of seated passengers (2.5m above track level) within a train carriage for the ZTV analyses was used. Finally, using the concept of motion parallax, which considers the relative speed of objects moving across the view as the train passes through the landscape, buffers were created for the different operational speeds e.g. maximum design speed, areas of speed restriction or speeds when on station approach/departing stations. These buffers help narrow down the potential locations to model and analyse.
Third stage – ZTV
The third stage focused on modelling the ZTVs for the route and were based on bare earth Digital Terrain Model and Digital Elevation Model data. They were first modelled without designed barriers (proposed landforms and mitigation planting), in order to show the maximum extents of identified landmarks which would theoretically be visible and then this step was repeated with the design barriers. The design speed information and series of identified distance buffers within the 3km corridor each side of the route were then overlaid upon the ZTVs. A simple calculation of distance (D)/speed (S) = time (T) was used to understand for how long a given landmark could notionally be visible. Distances were fixed for the whole track while speed was the variable in the equation with the mean of visibility within a specific buffer changing with varying speed.

Fourth stage – analysis
The fourth stage focused on analysing the modelling of the ZTVs where the results were used to shortlist the potential opportunities (iconic landmarks, local landmarks or features important for orientation on the route), as well as to develop initial thoughts on additional landscape design recommendations.
Virtual reality application
Creative and imaginative proposals – the virtual train (environment)
The purpose of Stage 2 of the project was to explore more widely the opportunities that exist in enhancing the passenger experience and to provide further information on how passenger experience can be improved through innovative tools such as technology, art and landscape architecture. The brief was to include as many of the railway features as possible (tunnels, noise barriers, cuttings and embankments etc.) but excluded the experience passengers will have when being in or around stations and depots.
To fulfil the brief, Arup collaborated with the University of Sheffield using their broad and scientific approach and particular expertise in landscape architecture, landscape history, social sciences, digital technologies, and land art.
A 10 km section of route between the Wendover and Chiltern tunnels was modelled in detail. This was built upon the hybrid design model developed for the photomontages and animations. For the context, a high resolution lidar [4] scan was commissioned and was the basis for the detailed context in the distant views. The lidar survey was undertaken by a special Aerial Capture Company (Bluesky) who used a small aircraft with one IXU camera and an Optech Galaxy LiDAR system.

The brief requested an immersive train route experience from the perspective of a passenger for a 10km section of the line of route. This was to use the existing route wide 3D model and produce a 1km wide contextual viewing corridor following the route alignment.
The model was to be viewable as a simulation from a passenger vantage point and be compatible with Virtual Reality technologies to emulate passenger experience (with the passenger eye-level set to 2.5m above track level).
Although experimental, there was a requirement for the simulation to be credible and accurately geo-referenced, to allow for incorporation into a wider model and/or further increments to be added.
Given that the commission was for a study, innovative thinking was encouraged to highlight both opportunities and constraints and considering the journey in its entirety including both the urban realm and natural environments.
Areas of research considered within study were to focus on Landscape Architecture; Land Art; Augmented Reality [5] / Virtual Reality; Landscape History; Landscape Ecology; “Story Telling” through visual and audible measures and Inclusivity and Diversity.
The build
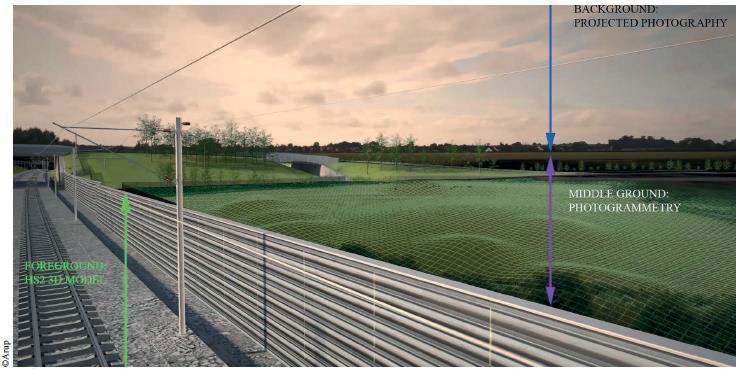
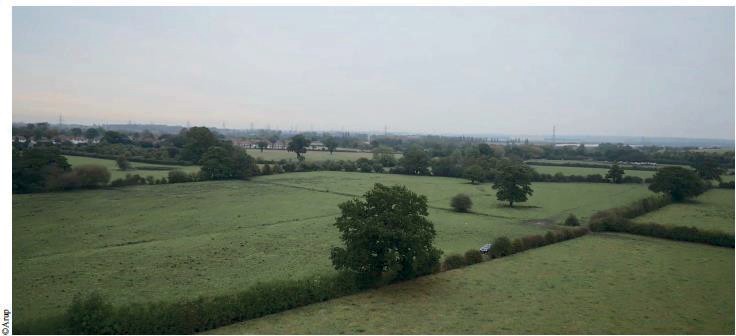
Utilising the basic rendered animations that were used to decide the section of track to be taken forward, orthographic photography [6] was draped over the surrounding topography model. This revealed the amount of landscape visible from the train to determine the brief for and the extent of the area to be surveyed in more detail. An initial site visit was then undertaken to collect field data using a custom data collection form via a mobile data platform. This facilitated the documentation of a geotagged and time stamped photographic record to ensure site photography would be applied accurately to the model.
A 5km x 10km area was accurately captured using a combination of ground and aerial surveys. Geo-located photography, orthographic photography and lidar scans provided a rich dataset to create a verifiably accurate digital model of the area, forming the basis of our
simulation. The model topography was created using the scans combined with orthographic photography. Scanned points of the trees and hedgerows provided the heights and volumetric data required to recreate vegetation using computer generated models. The route wide 3D model of the HS2 scheme was then integrated, in order that the scheme design could be accurately represented and fully understood within the existing landscape.
The terrain geometry was based upon the DTM supplied from the site capture scans. Textures were applied from the orthographic photography and trees and hedgerows and buildings were modelled from the Digital Surface Model (DSM) to verify heights and distribution, from ground based photographic surveys and reference orthographic photography.
The route model was based on the hybrid Bill design and featured an articulated photographic level of model detail. Including, parapet design, security fencing, and overhead electric line masts. Three-dimensional vegetation represented both existing and proposed species of trees.
The simulation model was rendered in photorealistic stereo and played back through a game engine environment. Simulated at the design speed of the railway, the following types of hypothetical togglable interventions were added to the simulation to demonstrate an improved level of orientation for the passenger whilst travelling through the landscape and provide possible improvements to the passenger experience whilst looking out of the train:
- Addition of decorative planting to cuttings/embankments;
- Permanent earthwork treatments and artworks applied to cuttings/embankments;
- Installation of land art/sculptures in the distance and outside HS2 boundary;
- Altered design of noise barriers to allow views through;
- Temporary art/lighting installation to existing landmarks;
- A proposal for a digital app to provide additional real-time information/highlight opportunities.
The finished environment and application – Impacts on decision-making
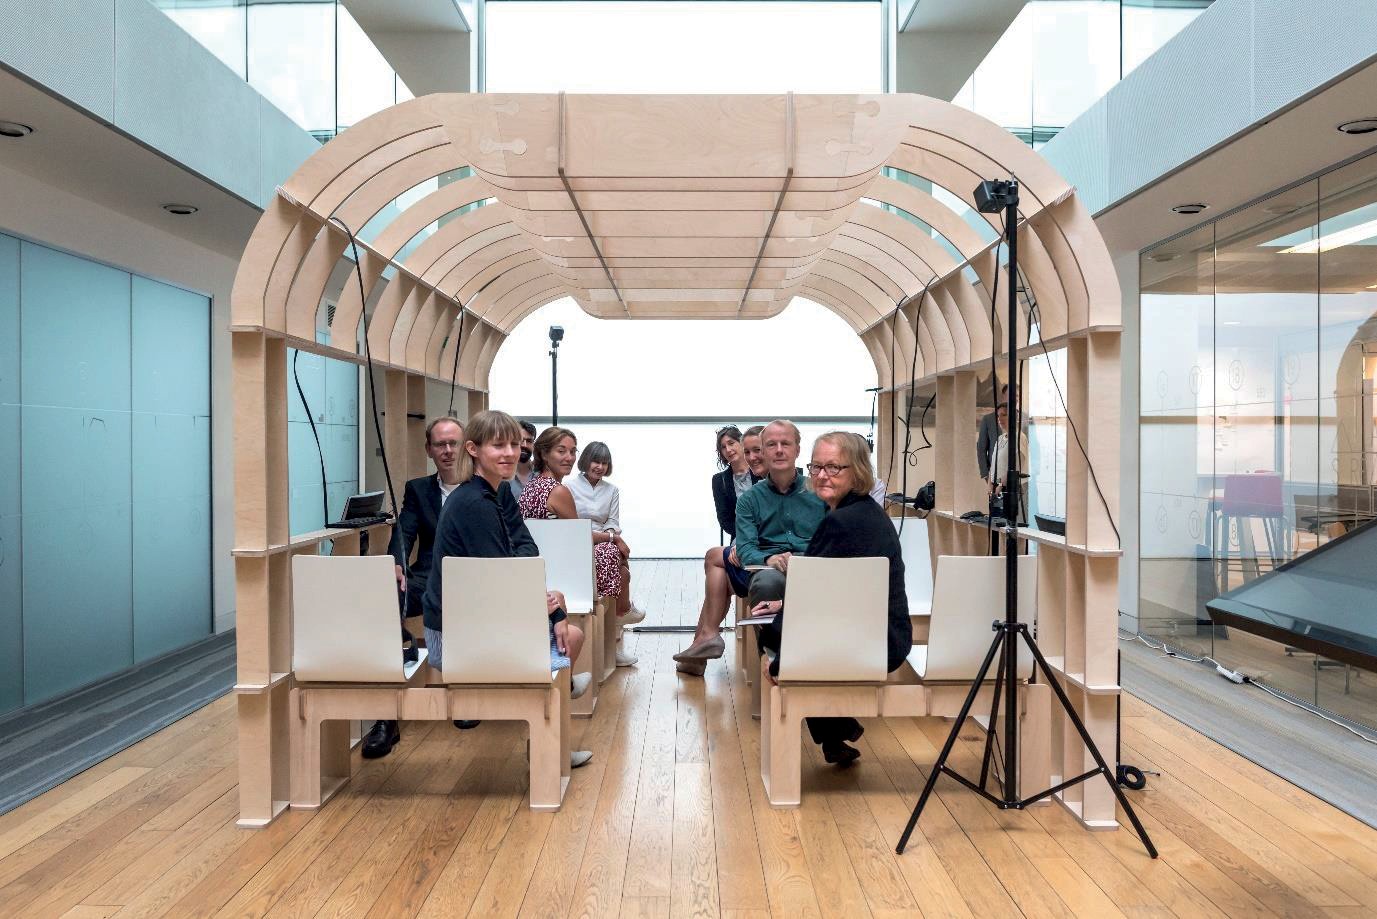
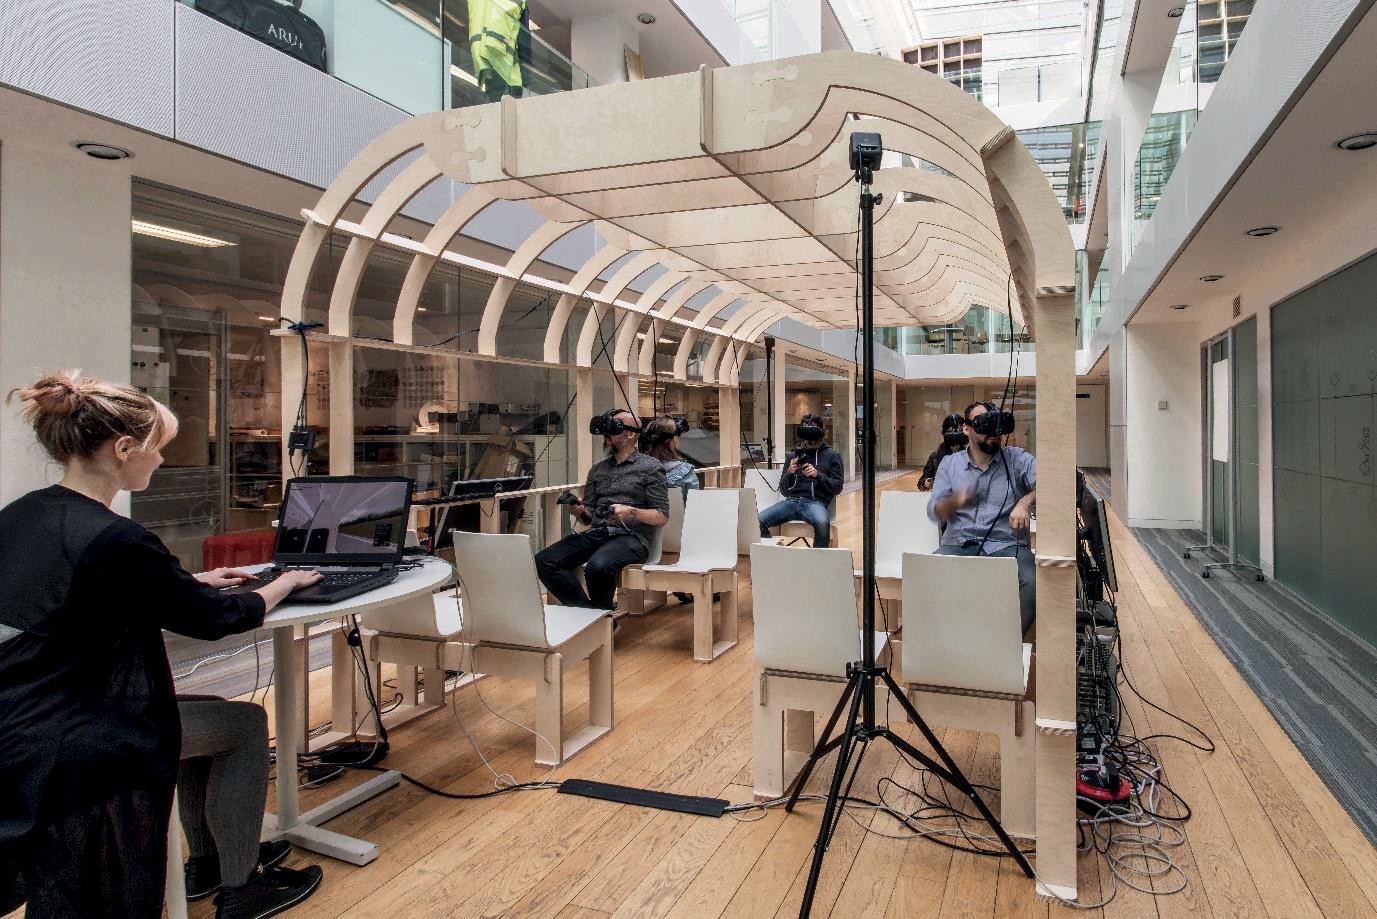
The fully immersive virtual environment created a good basis for understanding the scheme design and effectiveness of design interventions, building a ‘real’ case for proposed enhancements to the scheme in later design development.
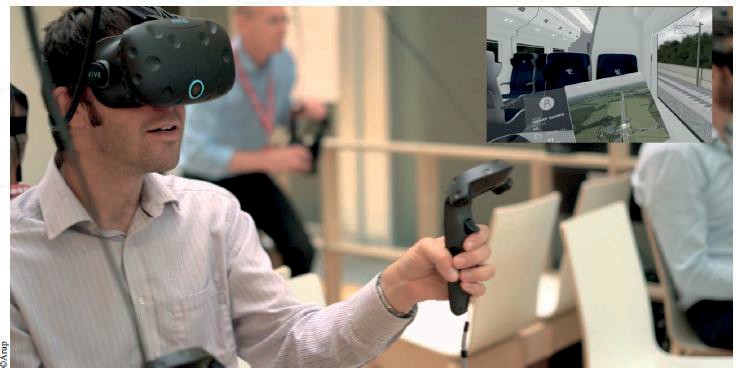
The addition of a skeletal timber ‘train carriage’ with seating (Figure 11), representing the scale and form of a carriage, created the setting for fully immersive virtual environment. Up to six networked virtual passengers were able to experience the simulation utilising networked head mounted displays.
Acoustics was added from a soundfield recording of a high-speed train.
A vibration platform was added for the immersive experience of train vibration.
The platform and interior of Euston Station was added as part of the user experience to contextually lead users into the experience.
The stage was set to devise a programme of events to present the simulation not only to members of HS2 Ltd, but to the Design Panel and to key stakeholders. To date over 13 ‘train carriage’ road shows have taken place around the country to provide an opportunity to explore the role that interventions in the landscape and digital overlays can make to contributing to a memorable and enjoyable passenger experience.
The virtual reality simulation was the winner of the HS2 Independent Design Panel Awards, Design Guidance and Requirements.
Panel comments:
“The HS2 Independent Design Panel commends HS2 Ltd, and the team at Arup, for work undertaken to develop a virtual reality simulation of the Phase One passenger experience. This is an extremely valuable and innovative tool which provides an immersive experience that can be used across the wider project to influence decision making and inform iterative design development processes.”
The train experience was also utilised as a form of engagement at Education fairs in London Excel and Birmingham NEC to thousands of students.
In addition to the benefits experienced by the individuals travelling by train, the work on this enhanced passenger experience study has also started influencing the design approach for other elements of the project, e.g. internal design of rolling stock and engineering details of tunnels and bridge abutments.
Lessons learned and recommendations for future projects
The study commissioned by HS2 was a successful model that can be implemented in other projects involving high-speed rail. It identified not only that a significant aspect of a train journey are the views from the train, but also their critical impact on the passenger experience and therefore the train operators’ business case.
More than 1,000 people (mainly HS2 Ltd employees and external stakeholders) have attended the roadshows. Their feedback was highly positive with many of the participants seeing the VR tool as incredibly powerful, as it enables HS2 to test the passenger experience during an early stage of the design development.
Benefits of VR
Making the case to improve views along a train route can be difficult when relying simply on drawings and renderings on a map and photos of landmarks. To bring to life the journey, VR technology was used to show how the train ride would look with enhanced views and landscapes, and without those views and landscapes.
In this way, modern, cutting-edge technology was used for the first time in a study focused on applied landscape planning and high-speed rail in the UK. This model and methodology can be easily applied to future sections along the HS2 route and can be replicated on other large scale projects.
Technological advancements since the study was completed
Future opportunities with the advancement of technologies such as online cloud-based gaming can be used to experience networked gaming environments allowing the simulation to be accessible to a wider audience.
There are other ways of playing back the simulation without the use of head mounted displays, for example Arup has developed a facility called the Arup V-Lab, which is an immersive stereo projection facility with ambisonic [7] acoustics and motion tracking. This type of facility might be attractive for users who do not want to engage with head mounted displays and discuss key aspect of the design speaking eye to eye.
How the Phase One study informed the Phase 2a study
The VR stimulation was successfully used in Phase One study of the HS2 project simulating sections of the route. It stimulated design discussions, tested the passenger experience, demonstrated HS2’s commitment to a holistic and context driven design and became a powerful tool during the stakeholder engagement process. As a result, the same VR simulation was adopted for use in the Phase 2a study to simulate a 30KM section of the route.
From these studies further commissions were added to the virtual train experience, this included design sprints of the future rolling stock design and physically testing the options for the future seat design, vestibule, and toilets. This brought together, technical rolling stock teams, customer experience teams, service design expertise and industrial design teams together.
The design of the train seat was physically developed in parallel to the immersive experience so that users could physically touch aspects of the train whilst in virtual reality.
In the future, the VR technology can be applied to the rest of the phases of the HS2 project and/or expand existing simulations. The methodology and technology could be further adopted on other railways and large-scale infrastructure projects across the UK.
Conclusion
The pilot animation used in both the Phase One and Phase 2 routes for HS2 offered a successful method in which interventions in the landscape and digital overlays can be made to contribute to a memorable and enjoyable passenger experience. Influencing the design for the purpose of improving passenger experience also contribute to increased revenue streams (during operation).
The virtual reality simulation is both credible and geo‐referenced accurately to allow for incorporation into a wider model and with the potential to add further details and interventions. In the future, this model can be developed to display other aspects of a journey on HS2, including:
- Further sections of the HS2 train interior,
- the Experience of arriving at HS2 Stations including adjacent public realm.
- views at night, during different seasons and different weather patterns (rain, snow, sunny day, cloudy day).
- Develop animation as a tool for use during design development and construction to demonstrate different finishes to engineering details / surfacing / tunnels etc.
- Railway systems integration from an immersive perspective.
- Machine learning and analysis of immersive user testing of holistic train experience.
VR used as a communication tool
A second key benefit in using VR technology is the superior way it can display the benefits of HS2 to key stakeholders, the public, government institutions and future riders. The traditional way in which infrastructure projects are presented to the public is through photos, maps, and drawings and renderings on paper. Communities that are affected by infrastructure projects can be hesitant to support these projects because of a natural scepticism toward change. By utilising VR technology, HS2 and other companies working on infrastructure project can better display a more realistic picture of what a rail line, bike lane, tram line or any other urban project would look like before it is built.
Cost, time and revenue benefits
The third benefit related to carrying out landscape and passenger experience study involves cost and time savings as well as increased customer satisfaction and revenues at operational stage.
A database of potential landmarks along the path, and a VR simulation of various interventions for how the monuments would look with changes applied saves both time and money in the long run because HS2 can then focus its efforts on only the key monuments worth carrying out interventions for that will be visible to passengers, while putting aside those that won’t be noticeable because the train is traveling too fast.
References
- SNC Lavalin and Arup. (2016). HS2’s Market Characteristics: Summary of Findings, version 1.24
- McKinsey & Company (2018). The Business value of design
- Kevin Lynch Donald Appleyard and John R Myer. (1962). The view from the road
Glossary
- Lidar – is a method for determining ranges (variable distance) by targeting an object or a surface with a laser and measuring the time for the reflected light to return to the receiver. It can also be used to make digital 3-D representations of areas on the earth’s surface and ocean bottom by varying the wavelength of light. It has terrestrial, airborne, and mobile applications.
- Augmented Reality – is an interactive experience of a real-world environment where the objects that reside in the real world are enhanced by computer-generated perceptual information.
- Orthographic Photography – has to do with an aerial photograph or satellite imagery that is geometrically corrected (“orthorectified”) such that the scale is uniform.
- Ambisonic – is a full-sphere surround sound format: in addition to the horizontal plane, it covers sound sources above and below the listener.