Programme management techniques and tools for complex hybrid Bill submission
The production of the hybrid Bill for the High Speed Rail (Crewe – Manchester) was a complex, multi-stakeholder and multi-disciplined co-ordination under a challenging programme with risks of a minor delay to deposit that could result in a major delay to Royal Assent and following delivery programme. The deposit of the Bill by the Department of Transport (DfT) was therefore a significant milestone in the delivery by High Speed Two (HS2) Phase 2B and marked the commencement of the Parliamentary process. The delivery programme was hugely challenging and required to achieve an aspirational target deposit date set by Ministers.
This paper details the strategy and approach taken in delivering the Bill products and prerequisites enabling its successful deposit. Whilst deposit can be considered successful, this paper also identifies areas where further improvements could be made to increase certainty of outcomes and avoid risk. The paper will be of use to any organisation or project that is required to deliver a multi-functional and multi-stage programme with many interfaces and key stakeholders and not restricted solely to the delivery of a hybrid Bill.
Background and industry context
Early Quantitative Schedule Risk Analysis (QSRA) modelling indicated a ‘most probable’ deposit date for the Bill as late 1st quarter 2022 and possible deposit ranges into the 2nd quarter. However, HS2 Ltd was set a stretch goal by the DfT for a 2021 deposit date ahead of the Christmas recess. This stretch DfT target date sat at a probability of <2% within the QSRA modelling.
As a result the Phase 2B ‘Collective Endeavour’ set to guide the work of the Phase 2B team included the objective “to deposit a robust and compliant Western Leg hybrid Bill no later than December 2021” and delivery required the development of a suite of robust management tools to identify, record, communicate and mitigate risks, issues, progress, and opportunities. These tools have been developed to augment HS2 core systems and process with key focus on open and accurate dialogue across the whole integrated supply chain.
The high level of programme readiness for the December 2021 target allowed HS2 to dynamically support the DfT closely with rapid deposit scenarios for a late shift of deposit to early 2022 and ultimately facilitating the earliest deposit of 24-Jan-22 once agreed between the DfT and other Government Departments.
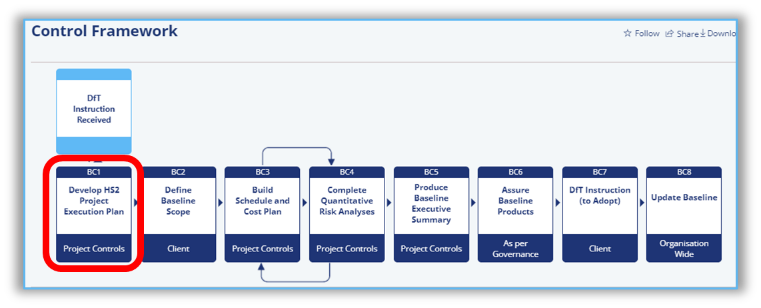
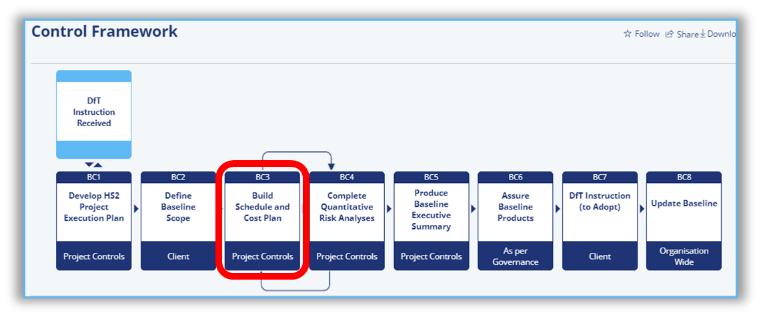
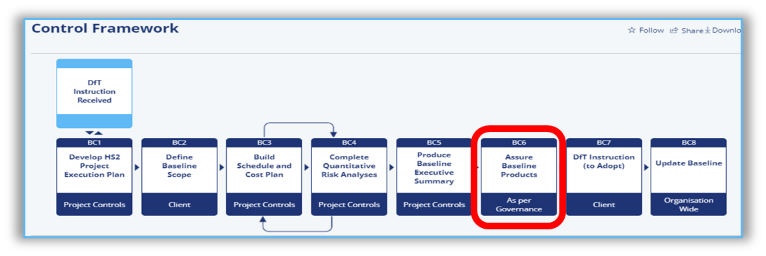
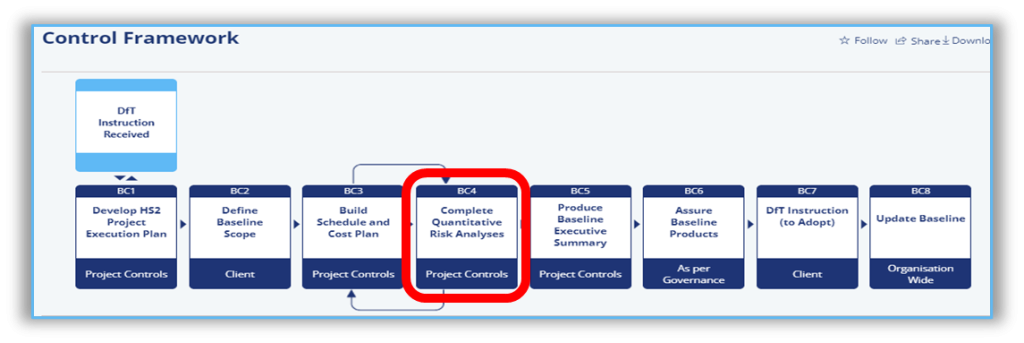
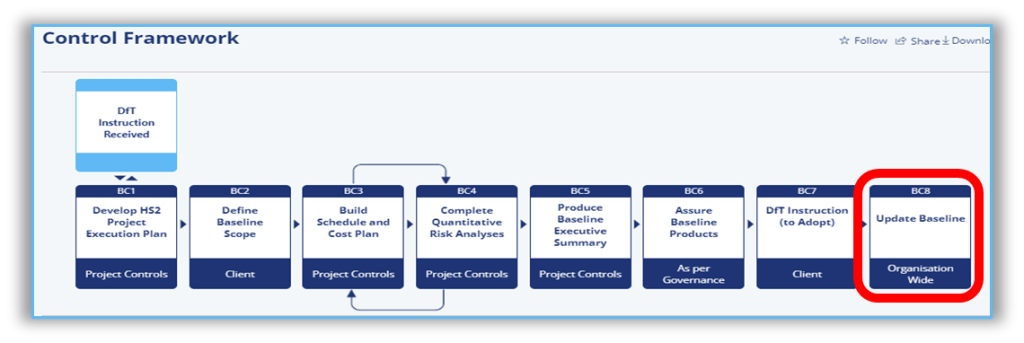
This paper will explain applicability across future schemes and programmes by the philosophy and approach of these tools. Where appropriate, HS2 Integrated Management System (IMS) links will be highlighted as shown by the Control Framework boxes. Although the example of project management development and application is example in the context of the HS2 Phase 2B Western Leg scheme, the approach can be considered for any complex delivery programme across industry.
Approach
Simply put, the approach to the delivery programme management of the Phase 2B hybrid Bill (hB) was a structured system of integrated data driven tools and forums to facilitate clear and collaborative decision making. Performance was also incentivised across the supply chain with aligned common incentive targets to reinforce the expectation of integrated collaborative working. Many of these processes feature in any major programme in some form, however the differentiator for Phase 2B was the structured way that the processes complemented each other, held together by a clear cadence fed by a single source of programme truth.
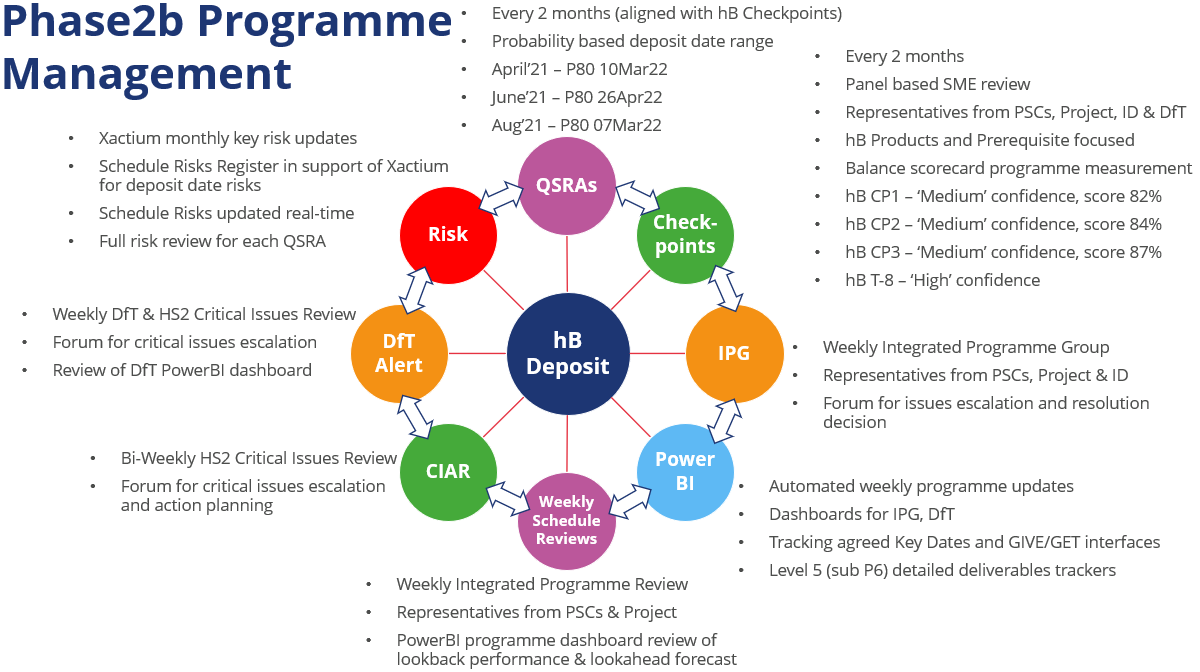
Fig 1 shows the cadence of the main programme forums. These forums, along with the tools, are explained in detail of the paper below along with commentary on success and recommendations for further improvement (shown in bold text). To give structure to the paper, content has been grouped under Plan-Do-Check-Act to emphasise that the management system was a continuous loop.
Plan
Project Execution Plan(1) (PEP)
Phase 2B hybrid Bill delivery approach was initially laid out within the Project Execution Plan (PEP) developed and assured by workstream leads and agreed by the Delivery and Hybrid Bill Directors. This document defined the strategy for successful delivery of the products required by the DfT for the constituent parts of the Western Leg hybrid Bill on deposit, as well as prerequisite items required for the hybrid Bill to be deposited.
The PEP is the governing document, setting out the scope and objectives of the hybrid Bill, the products required for successful delivery of the hybrid Bill and the methodology, assurance and governance applied in their production and provides the means to record the impact any change may have on these throughout the duration of the hybrid bill scheme development.
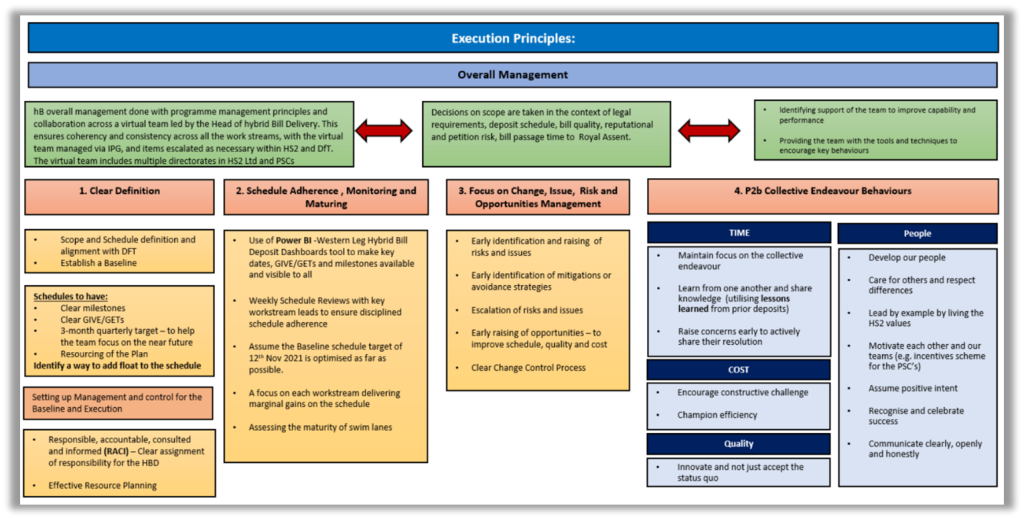
The PEP was also used to aid familiarisation for new starters and act as a delivery Road Map for the hybrid Bill deposit, essentially providing “how” the hybrid Bill will be delivered. Figure 3 below shows the execution principles summary within the PEP.
Programme management
Once the Western Leg scope list had been defined and schedule developed a key step was to select and agree the key milestones required to achieve the successful deposit outcome. These were selected to give a distribution of milestones across the main workstreams over the duration of the programme.
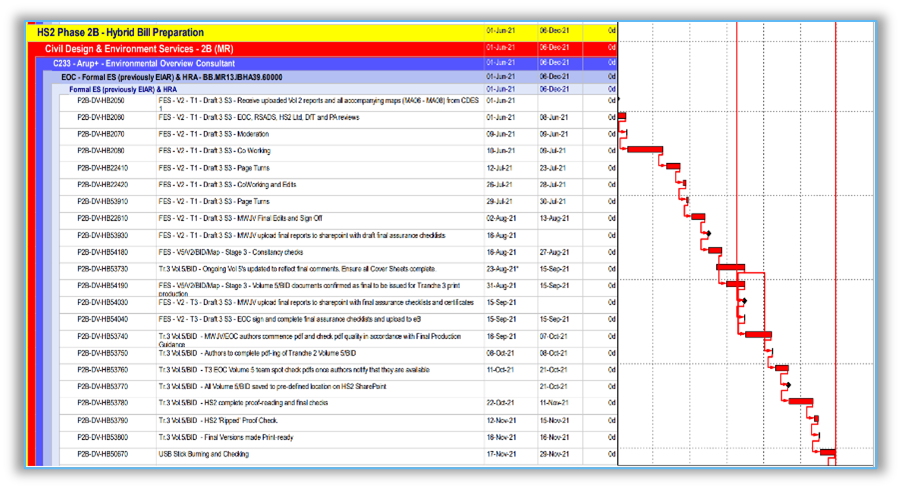
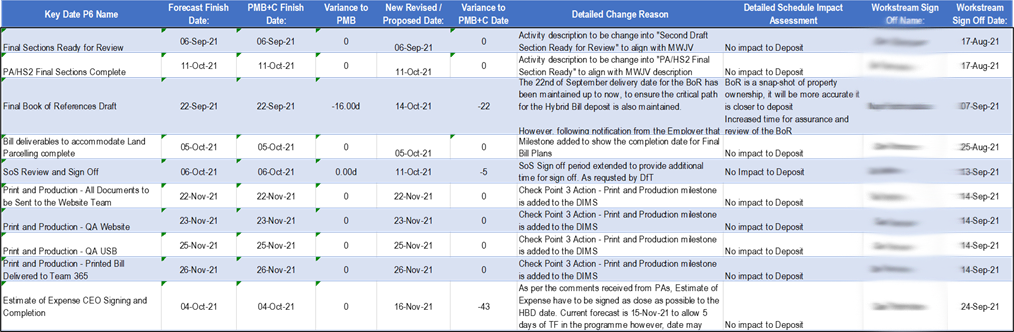
Milestone scope definitions were agreed with owners before being locked down within the programme Performance Management Baseline (PMB), a snapshot of which is shown in Figure 3 below. PMB updates were initiated by significant instructed changes in scope or by a change of strategy, possibly as a result from a significant delay impact, and were governed by a strict process of staged approvals.
A key aspect of the programme was interfaces between Professional Services Contracts (PSCs):
CDES – Civils Design & Environmental Services
EOC – Environmental Overview Consultant
SLS – Site Access, Land Referencing & Stakeholder Engagement
RSADS – Rail Systems Application Design Services
Each PSC owned their individual programmes that were interface each period by HS2. Each programme had numerous interface points called GIVE-GETs that were used, along with key dates (a PSC milestone) to ensure alignment of programmes. These Give-Gets and key dates, followed a similar process as PMB Milestones for definition and agreement of dates before being signed off by the workstream leads under the Development Interface Milestone Schedule (DIMS) before being baselined. This also included tracking key interfaces with DfT through this process and flagging upcoming criticality of these milestones through the weekly publication of DfT dashboards and monthly reporting process.
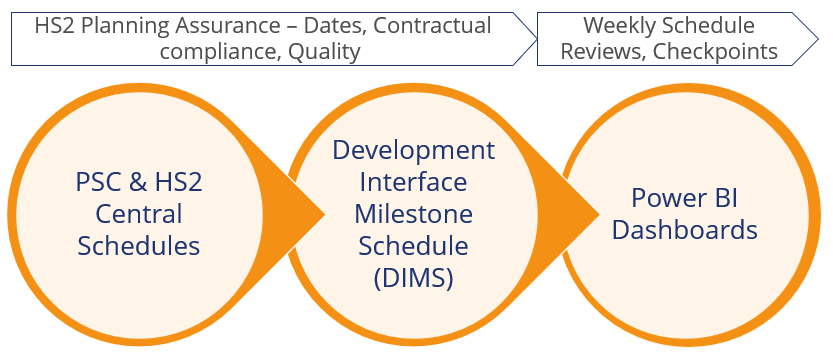
One of the cornerstones of the hybrid Bill approach has been joint reviews with PSCs and HS2. Regular DIMS Interface Meetings were used throughout the delivery to continuously flag, discuss agree and mitigate changes in the DIMS. This allowed the issues around key interfaces to be flagged and managed asap avoiding them becoming delays. These programmes were carefully assured as highlighted in the next section.
Future recommendation: An area of improvement identified was the process of defining the milestone definitions. At point of inception some descriptions did not explain to enough detail the measure of success (e.g., what evidence will be used as proof of achievement). Some definitions also changed during the programme lifecycle, mainly due to better understating of requirements, or a change in strategy. Several changes were approved however a few milestones did not follow definition change process leading to unnecessary discussion at the time of the milestone target which was a distraction to delivery focus of the milestone. A tool that could assist in all key interface setting is the Pulse Check, see figure 27. In future more focus should be made on definition setting and change control of milestone definitions.
A further area of focus is the management of the assumptions and exclusions list that is linked to the baselined programme. These were submitted and recorded with the programme submissions for the baselining process however improvements can be made in the treatment of these via the risk register, or similar, to manage out the risk of an incorrect assumption or an exclusion becoming an issue. Unmanaged, both programme assumptions and exclusions can become risk. In future a higher control level of assumptions and exclusions is recommended.
Programme assurance
A fundamental requirement to achieve programme adherence and success was to provide assurance to the programmes to ensure quality. This was carried out via several tools highlighted below. There are tools available off-the-shelf, or even in-house from PSCs, to allow such programmes analysis therefore the learning is more for the direction of regular application of programme quality analysis techniques.
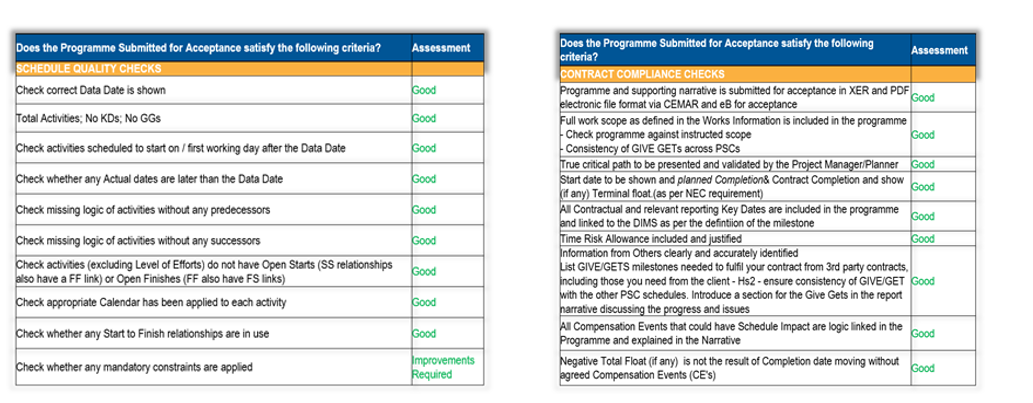
Each period PSC programme submission was initially passed through two check sheets processes for ‘contract compliance’ and ‘schedule quality’. Examples of these are shown below in figure 8, with feedback given to PSCs for rectification. This could be an immediate requirement to rectify any fundamental gaps or for next period submission for more minor issues.
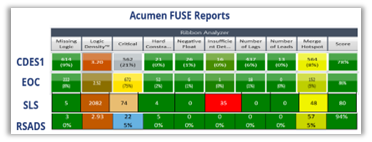
A further test was the ‘Acumen Fuse Report’ as shown in figure 9 above, used to check programme logic including the scale of critical path activities and the density of programme logic. A RAG scoring was issued back to PSCs based on agreed thresholds for feedback and correction where required.
Critical path analysis was applied to validate the Primary, Secondary and Tertiary Critical Paths as some of these were less than one week apart. Checks also included Total Float & Contingency as well as Key milestone adherence.
Again, these principles are not unusual within industry, however the Phase 2B approach was to avoid being blinkered to just the primary critical path by tracking multiple levels for early indications of increasing criticality.
PSC schedule narratives were also submitted with each period programme and were key to translate programme changes and performance to allow discussion at the programme review forums. Return commentary on the narratives was a good way to issue feedback and agreement on directions for issue correction.
Plan On A Page
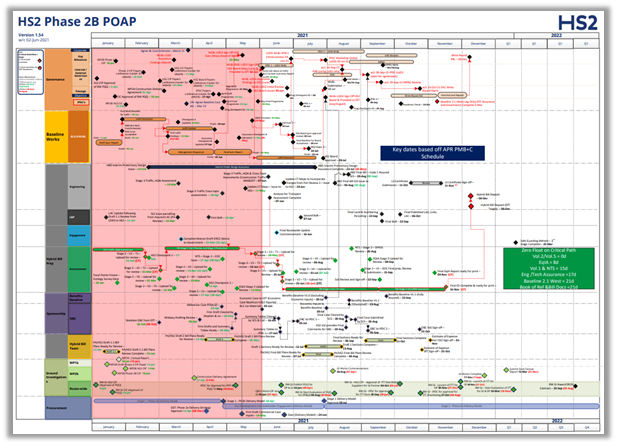
One of the key tools for visualisation and reporting of status was the Plan-On-A-Page (POAP), an example of the hybrid Bill POAP is shown below, figure 11. The base file driving the plan is directly interfaced from the single central P6 programme and were discussed by the HS2 lead planners weekly to make any management adjustments needed to correct errors prior to reporting.
A future improvement that is underway for an efficiency saving of management time as well as a reduced risk of reporting errors is the automation of the POAP from P6. This will be carried out via software called SummaryPro.
Risk & opportunity management
Planning for risks and opportunities is a fundamental part of any programme management strategy. The hybrid Bill delivery risks Fassociated with dates and quality were represented within the HS2 corporate system (Xactium) for control and reporting. However, it was quickly realised at the granular level of activates within the control P6 programme, that these key schedule risks were too high level to manage the rapid response that saw some risks being raised and mitigated within a week and therefore missing the monthly Xactium reporting cycles. Figure 12 shows the applied risk hierarchy.
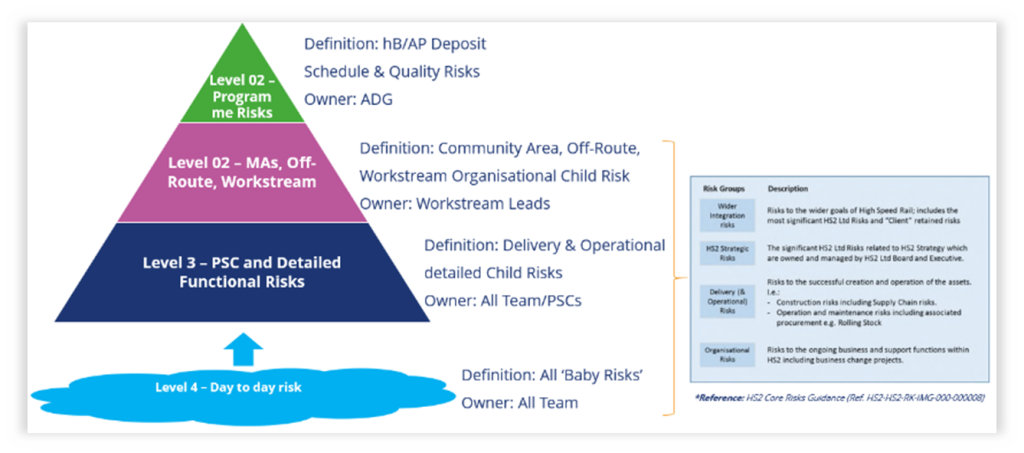
An online SharePoint tool was developed to manage these lower-level risks daily. It was important to ensure that these ‘day-to-day’ risks were fully aligned with the corporate system guidance for scoring to allow them to inform the high-level ‘parent risks’ withn Xactium.
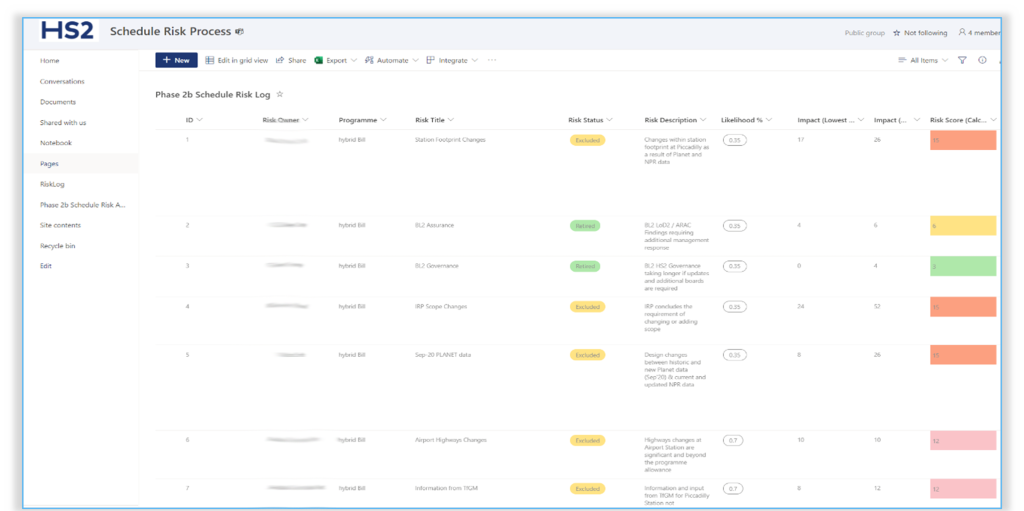
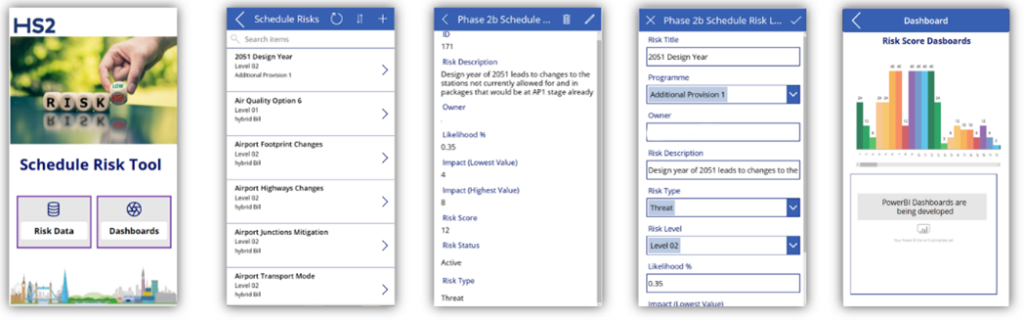
An example of the SharePoint based Phase 2B schedule risk log is shown in Figure 13 and was designed to allow online collaborative updates by all team members. Functionality includes automated risk score calculation (based on HS2 rules), email notification for risk entries, and improved downloads of risk lists to facilitate QSRA modelling. As well as allowing live risk updates, the tool also holds a history of previous retired and excluded risks for reference.
The schedule risk register tool also allows data entry via mobile phone app. This is to facilitate risk entry at any time, for instance during a site visit at the point a new risk is identified. The benefit being that a description can be captured at the time to allow immediate reporting and response. During lockdown and working from home, this facility has not been fully utilised since the full risk register can be open and used during online meetings, however the recommendation is for the consideration of this functionality on return to more office & hybrid working arrangements.
The ease of use of this online tool was very successful in bringing risk management to the front of planning and discussion allowing rapid data entry and response plans to be logged and more importantly mitigated.
It allowed for the risk owners to be more actively engaged in regular risk management. The key learning from this tool is the need to keep data entry simple and give access to all necessary users. An area for recommending future focus is the development of better opportunity strategies as these were generally lacking in quantity.
Do
Integrated Programme Group (IPG)
The Integrated Programme Group (IPG) is the key forum for head of hybrid Bill delivery to drive coordination, decision making and problem resolution. The principal function of the IPG was to coordinate the various programmes that converge as the project approaches the Phase 2B hybrid Bill deposit date. The IPG does not assume responsibility for any of those programmes directly (as each programme will remain the responsibility of the relevant team; for example, the programme for the preparation of Parliamentary Plans & Sections will remain the responsibility of the Hybrid Bill Preparation & Powers Team. The IPG convened weekly to ensure progress, discuss emerging risks and manage problems as they arise and take a cross-discipline approach to ensuring that the overall delivery programme for Bill associated products remained on track.
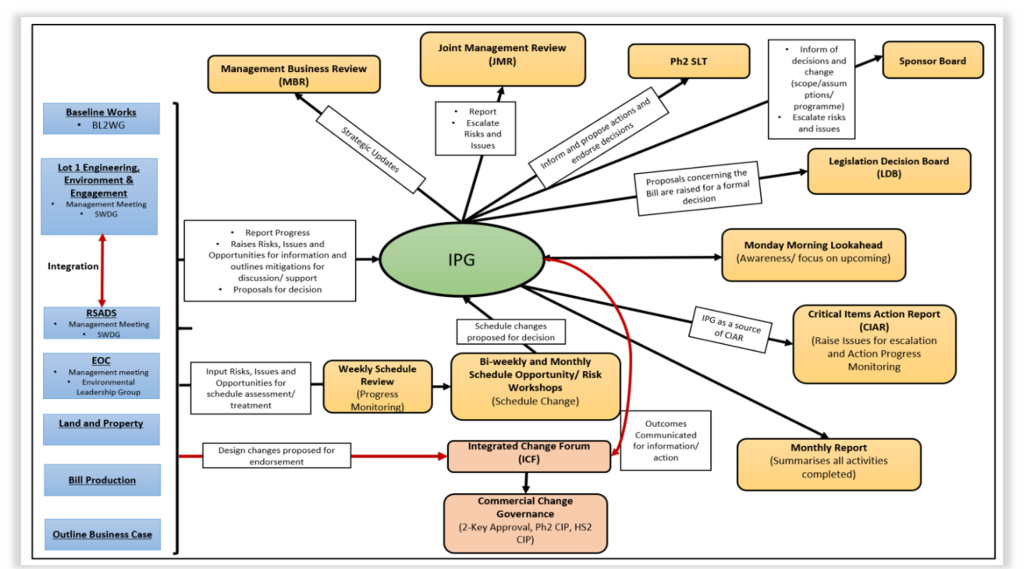
Figure 15, taken from the PEP, graphically shows the IPG at the centre of the suite of programme management tools and forums. Its function is a collaborative forum allowing discussion and decision making on issues. Members include leadership from PSCs, HS2 project and central staff. It is held midweek to allow information to be input from other forums such as weekly and bi-weekly reviews and output on decision into reports such as CIAR and Phase 2 Senior Leadership Team which occur later in the week. This cadence is important to ensure that information is as up to date as possible. The only time IPG was suspended was to hold the hybrid Bill Checkpoints (as shown in figure 31).
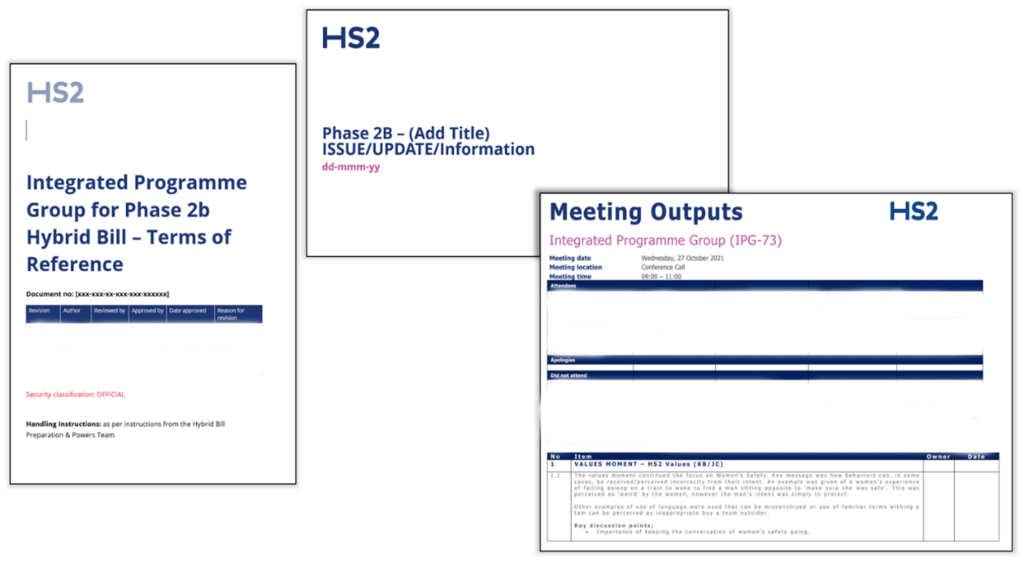
The IPG is governed by an agreed Terms of Reference (ToR) and recorded formally by issue of minutes. The learning from the IPG forum is to facilitate a safe open place for the identification and discussion of key issues and the ToR underpin these desired behaviours. In addition, presentation templates were created to aid a consistent approach to presentation of issues and improve IPG records as slides packs can be used for reference information. Figure 16 8 shows the front pages of these documents.
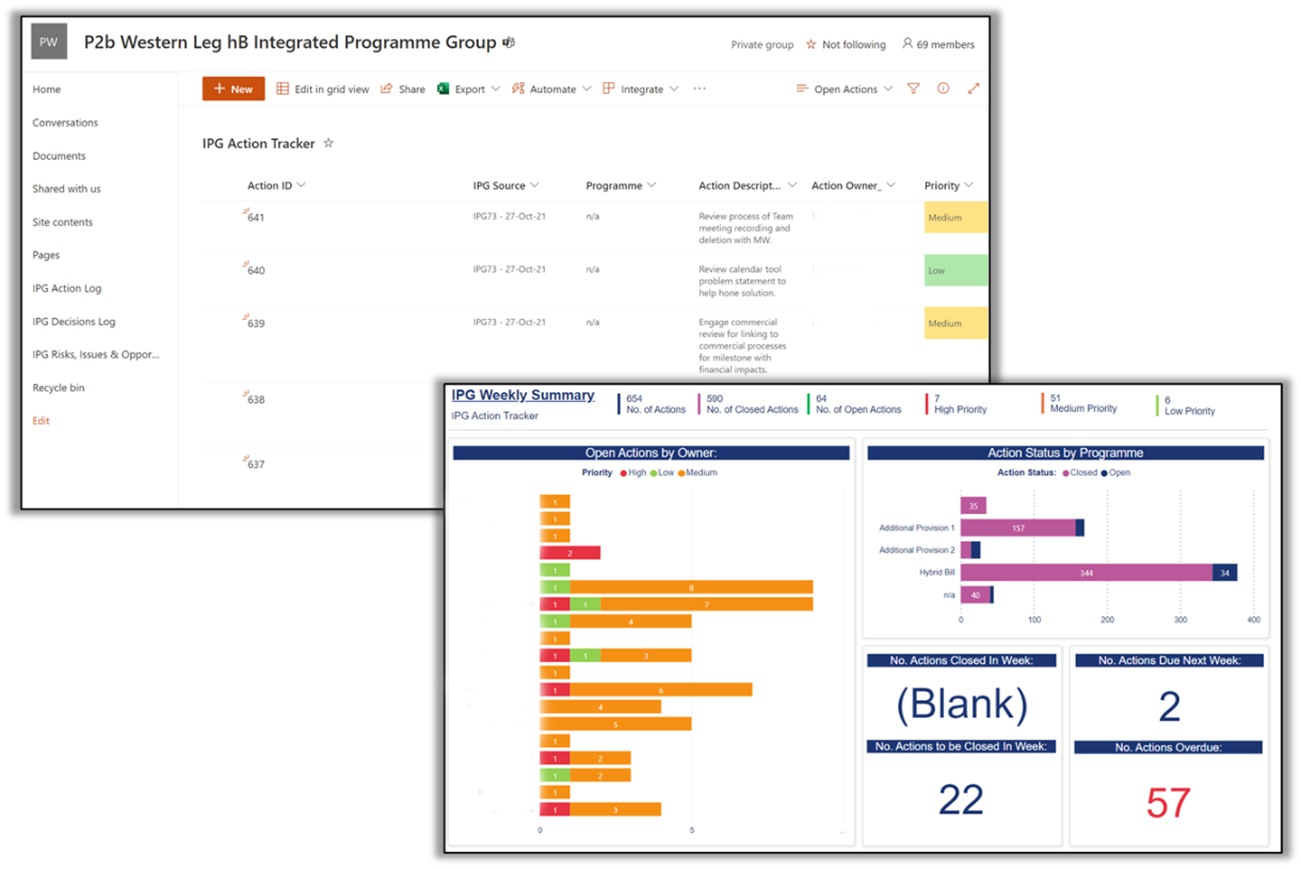
The IPG forum naturally results is actions, some of which are critical to resolve issues. To facilitate rapid action logging, closure and reporting, an online SharePoint tool was designed to aid the process. Like the Schedule Risk Register, the IPG Action Tracker allows collaborative online action entry, update, and closure by the action owners or delegate such as the IPG Administrator.
The action tracker also includes a dashboard that was used at the weekly IPG forum to highlight action closure progress and priority.
A recommended future focus on this tool is the functionality of automated alerts being issued when actions are due and overdue.
Critical Issues Action Report (CIAR) Register
Another key process in a project arsenal is the management of critical issues. As per other tools such as the IPG Action Tracker and the Schedule Risk Register, the CIAR register development was taken into an online collaborative platform. The benefits are also similar efficiencies in allowing all project members to access and update their own issues and actions. Critical issues and actions were logged on separate sheets and the PowerApp brings both together so that actions are directly linked to their critical issue and allows changes to CIARs through the application.
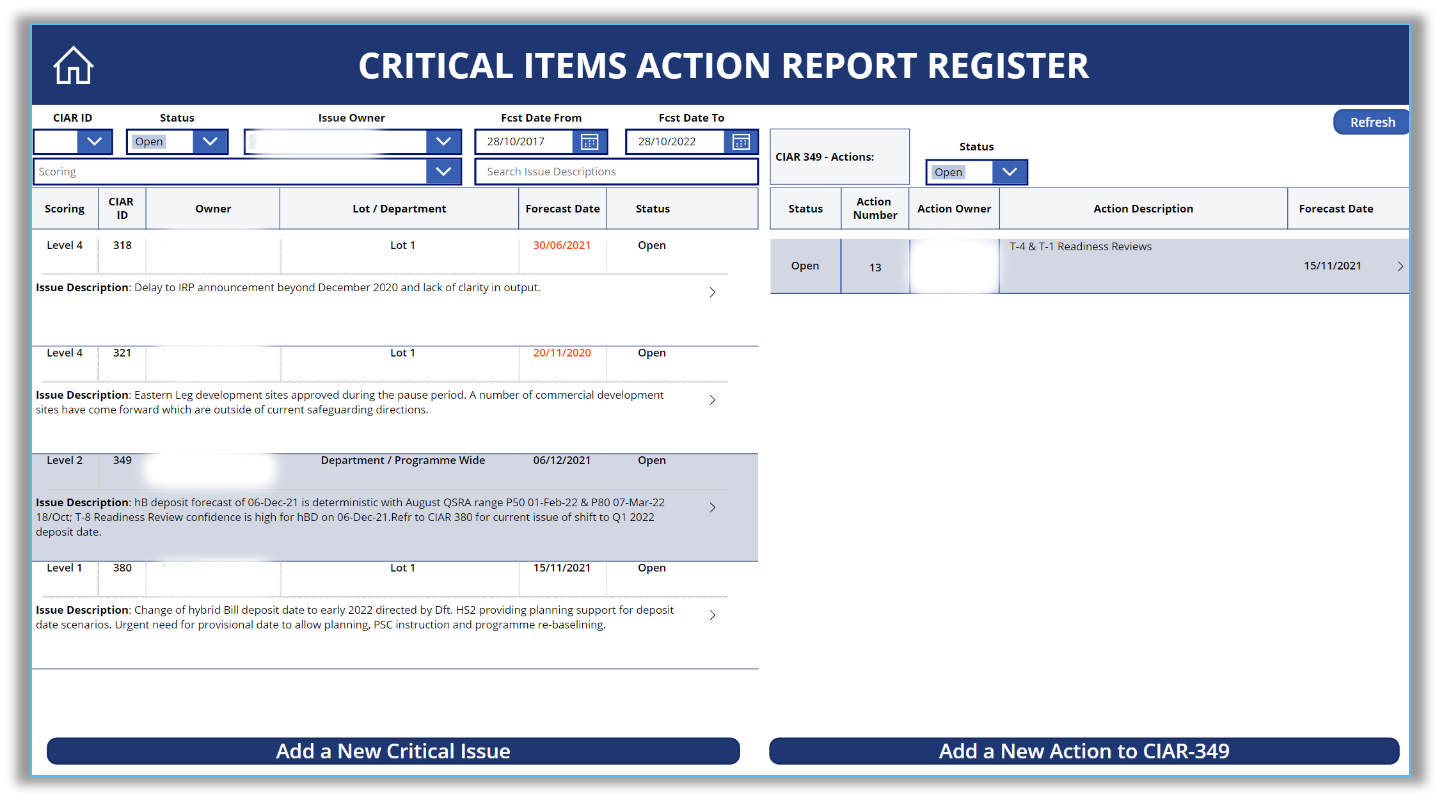
The CIAR register shown above in figure 18, is discussed bi-weekly but updates to issues and actions can be made at any time therefore allowing users to retrieve up to date information without relying on fortnightly updates or having to request information from the CIAR administrator. The issues are listed in a hierarchy based on the level of escalation required.
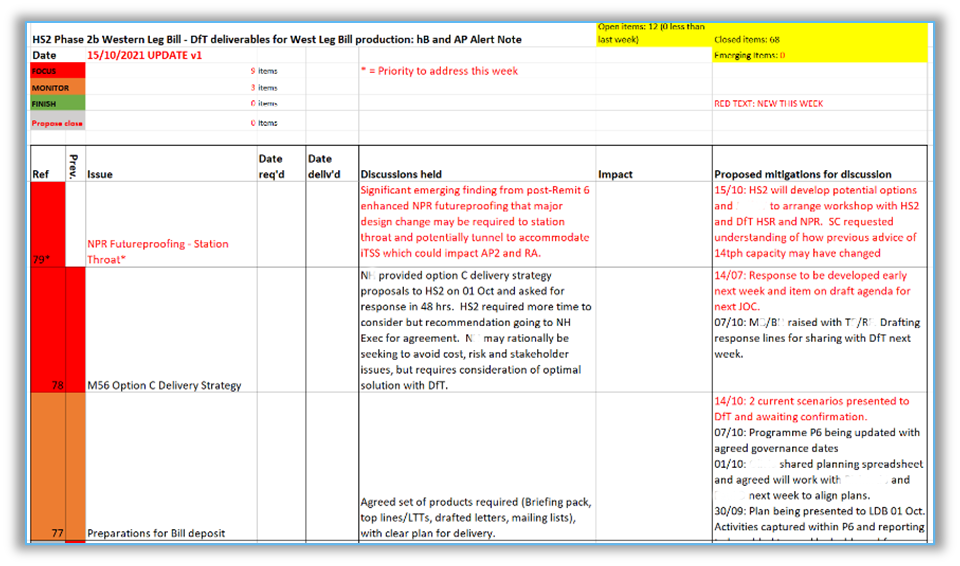
DfT alert note & dashboard
An important area for successful programme management is stakeholder communications. The key stakeholder for the hybrid Bill is the DfT who may provide important direction and information as well as hold crucial avenues with wider stakeholders for communication on issues. It was therefore important for regular clear escalation of issues as well as identifying information deadlines to the DfT. This was facilitated by the Sponsor team through the DfT Alert Note as well as a PowerBI dashboard bespoke to the DfT.
The DfT Alert Note is a simple spreadsheet-based list logging history of significant issues arising for DfT attention. Escalation is based on a RAG rating. Closed issues are included for full record purposes and is populated on a weekly basis from team inputs of new issues and progress on open items.
The DfT dashboard is linked to the central P6 programme that feeds all PowerBI dashboards as the single source of truth.
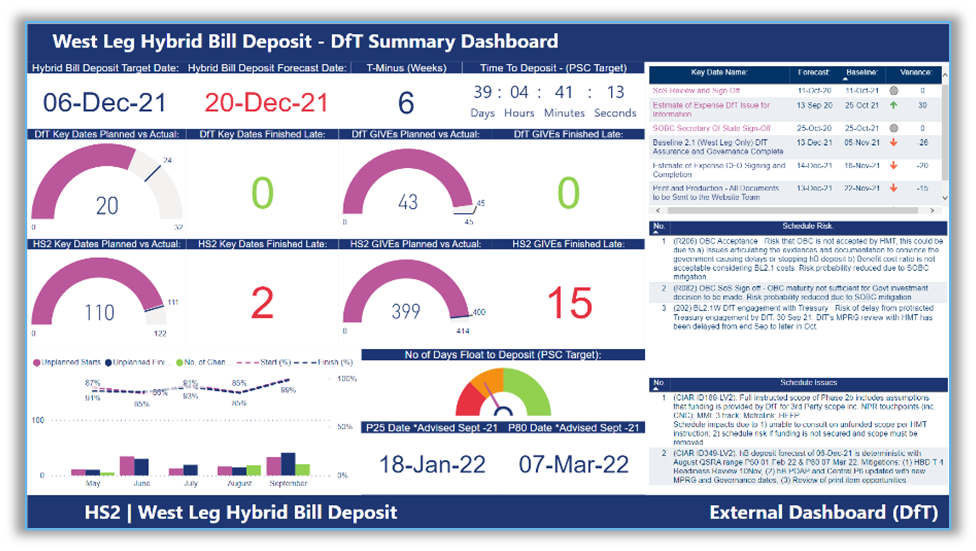
The DfT interfaces are maintained in P6 with logic links to downstream activities to facilitate the measurement of variances.
Key schedule risks & CIARs of DfT interest are included and were updated by the hybrid Bill Project Manager. The dashboard is updated by the planning team and is discussed weekly with the DfT alongside the alert note.
Check
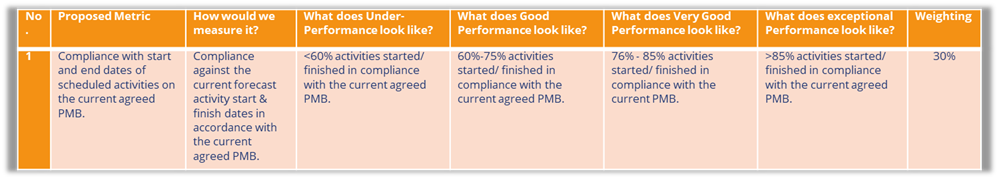
Schedule adherence
Schedule adherence was used as a key metric for programme adherence and measures variance of all programme activities from their PMB baseline start and finish dates and forms one of the incentive measures in the PSC contracts. The table below in figure 21 describes the thresholds used for exceptional, very good, good and under performing. A score of 100% would effectively that all planned activities in the month had been started and complete on their planned dates. Below 100% indicates variances however if there has been no impact to the critical path programme the variance would indicate usage of float with the programme.
The IPG PowerBI dashboards included a section to report monthly schedule adherence by PSC, plus HS2 activities identified by the ‘central’ programme as well as the rolling 6-month schedule adherence trend.
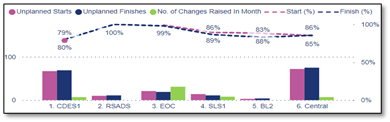
The PSC monthly schedule narrative would clarify main causes of impact to schedule adherence. This may include agreements on use of float required for issues management to protect critical activities or a result of an instruction which could be discounted from the final KPI score. Other causes would include items such as PSC performance.
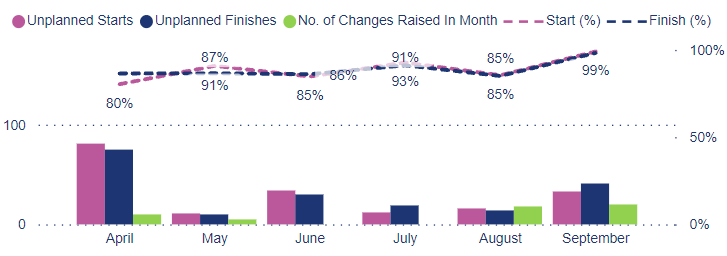
The PowerBI dashboard included an interactive schedule adherence page that would be used in weekly and bi-weekly schedule reviews.
IPG lesson learnt
The completion of the hybrid Bill deposit marked a significant milestone in the securing of the Act to grant powers for the delivery of the scheme. In the run up to, and post deposit, the Phase 2B workstream team recorded lessons learnt to consolidate positive and constructive lessons for sharing with future programmes such as the development for the East Leg scheme post publication of the Government’s Integrated Rail Plan.
To elevate the importance of lessons, the weekly IPG added an agenda item to present one of the Hybrid Bill lessons each week. In addition, the IPG presentation template and terms of reference mentioned above were revised to include the prompt for lesson learnt recording with each new issue presented and resolved.
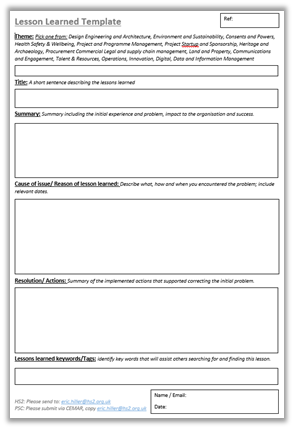
Whilst HS2 development is underway for the final structure and process of capturing lessons, the Phase 2B Value Management workstream developed a template and repository to ensure these are captured accurately ready for transfer to the HS2 repository.
Integrated weekly schedule reviews
PSC workstream detailed weekly programme reviews were held on Mondays each week. To avoid risk of silos forming, a weekly integrated review was held on a Tuesday. This didn’t repeat the detail covered on the individual contract reviews but focused on the points of integration, mainly the Give-Gets and key dates.
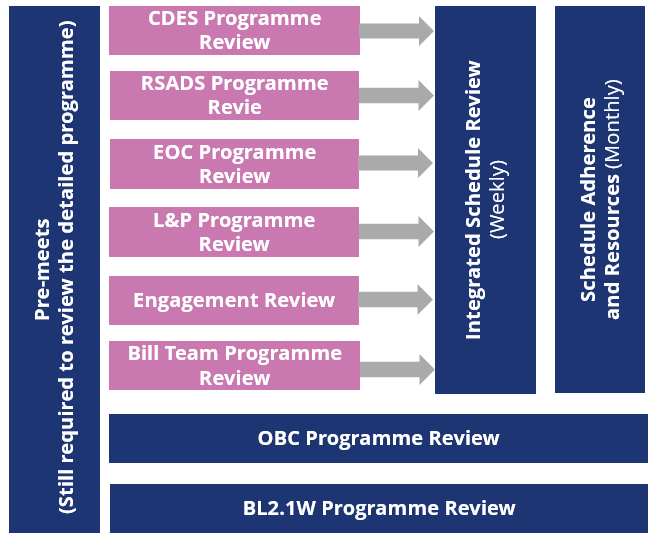
All PSCs and most HS2 workstreams were represented, except for Outline Business Case (OBC) and Baseline Cost (BL2.1W), as these did not require direct PSC involvement and contain sensitive commercial information. OBC and BL2.1W held individual weekly schedule reviews.
The root cause for most programme delays were often GIVE-GETs oriented, this integrated session gave for a two-way review of the completed GIVE-GETs and highlighted any risks in future ones. As for the delay route cause, the mitigation is often multidisciplined requiring a cross-workstream approach which could be progressed at the integrated weekly meeting allowing detailed discussion before escalating to the Wednesday IPG, or other forums, as an issue if required. Reporting was carried out on a by-exception basis to look at the variances to plan using the IPG PowerBI dashboard (as shown in figure 30 – visualisation for dashboard examples). Information included progress summaries, key dates, Give-Gets, critical path progress and schedule adherence. In addition to IGP, these dashboards were also used across forums such as programme checkpoints, weekly and bi-weekly schedule reviews.
The agenda was carefully rotated cycling 4 weekly between a 1 back/3 ahead to 12 weeks ahead. This was to encourage the workstreams and PSCs to regularly engage in mid-range planning that can often be lost between the need to mitigate urgent issues and long view on the final deposit milestone.
Pulse checks
One of the tools developed to help regular mid to long range review was the pulse check. This was a collaborative SharePoint access tool designed to set a forward review window at 24, 12, 4 and 2 weeks from the planned delivery date.
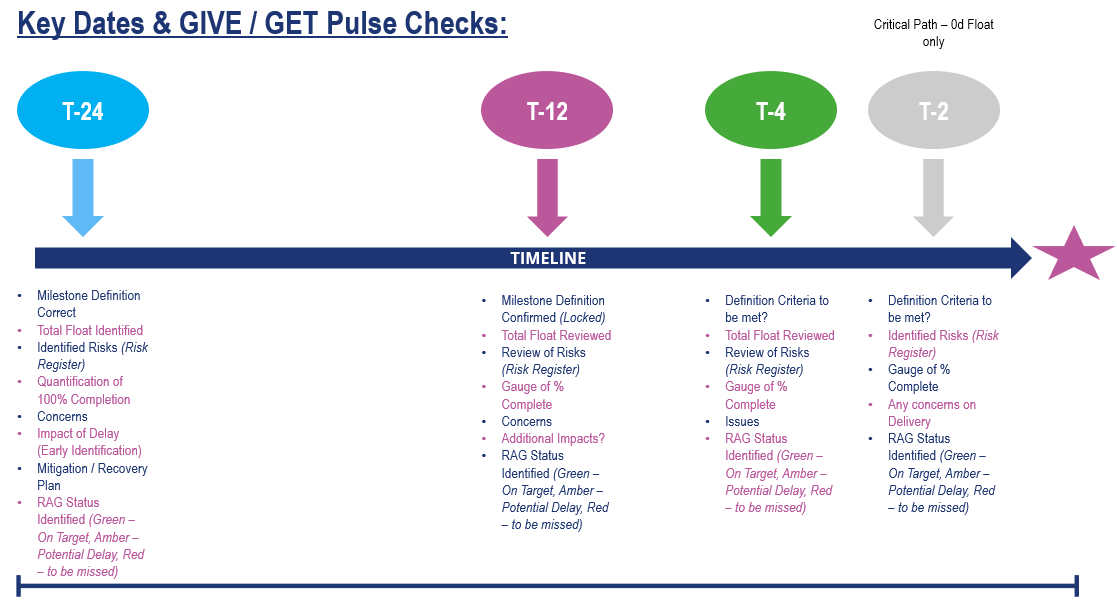
To counter the risk previously identified of poorly defined DIMs activity descriptions, the pulse check tool requires the completion of a simple question set each time a DIMs activity passes through one of the T-week stages. Data fields include DIMs description agreement between parties as well as if any risk has been identified.
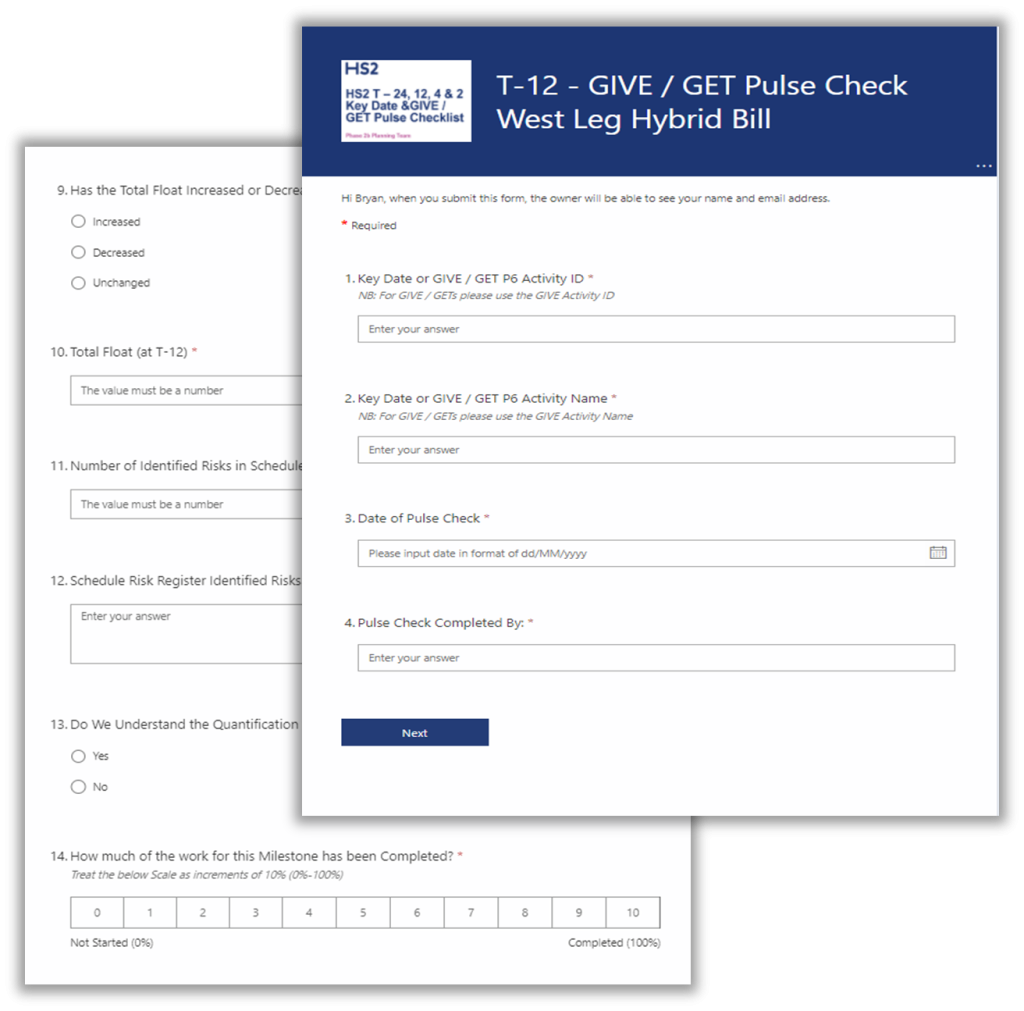
The key benefits are firstly the raising a flag if any of the data fields have not been completed, an assessment of work done to date towards the completion and if the description needs to be updated and agreed between parties. The learning behind this tool was the acknowledgement that interface activities can change during programme progress and this tool allows for these changes to be recorded at the earliest opportunity. A further benefit, as with all on the online collaboration tools covered in this paper, was that all parties had access to the single data source. This reduced the risk of multiple copies as well as reduced administrative burden as can happen with a spreadsheet based system.
A recommended future focus on this tool is the early preparation time required for tool data entry. Some sessions saw reduced usage of the pulse check tool and frequency of use should be considered (i.e. bi-weekly or monthly) for increased usage and improved reliability of data.
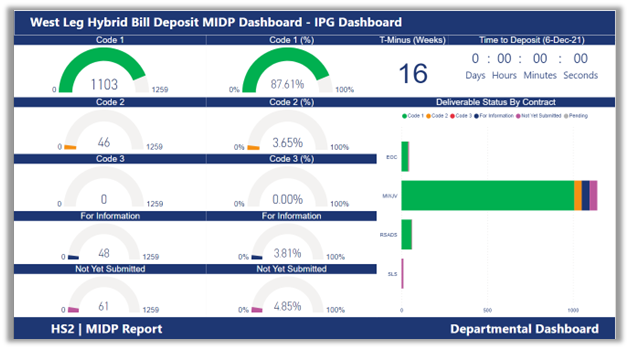
Level 5 dashboards
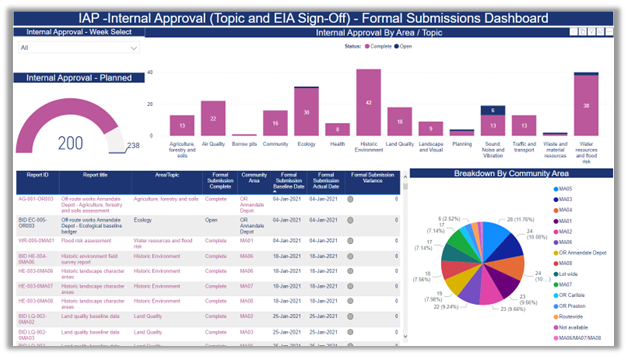
Major programme baselines will normally be fed by sub-level programmes or more usually trackers in order not to overload the P6 programme with too much detail. On a major scheme such at the WL hybrid Bill, these trackers can run to hundreds, if not thousands, of lines of data. To manage this level of data, the project created several PowerBI dashboards to facilitate contemporaneous data retrieval as well as automated status calculation on performance. Access to the dashboards was provided to anyone who required the information allowing team members to interrogate performance before asking questions. This allowed the responsible delivery teams to concentrate on the delivery performance by minimising the need to respond to request for progress and performance updates. Two examples shown here are the Environmental Statement Integrated Assurance Plan (IAP) and the Design Assurance Master Information Deliverables Plan (MIDP).
Integrated Assurance Plan (IAP). The ‘internal approval’ dashboard example is just one of twelve levels of available dashboard within the IAP. The tool was split into sublevels to make visualisation of the high volume of data easier to read based on defined steps through the IAP process.
Master Information Deliverable Plan (MIDP). The design assurance process is a crucial prerequisite required to assure the validity of design prior to hybrid Bill deposit. Although not directly part of the deposited Bill it is of vital importance to assure the Bill is informed by accurate and assured design information. The MDIP encompassed over 1250 design documents, all of which required to be completed as Code 1 accepted before HS2 could certify the design to be suitably assured prior to Bill deposit. Similar to the IAP, the benefits of this are access to data via a visual dashboard that allows interrogation into any field to quickly search the status of any of the individual items.
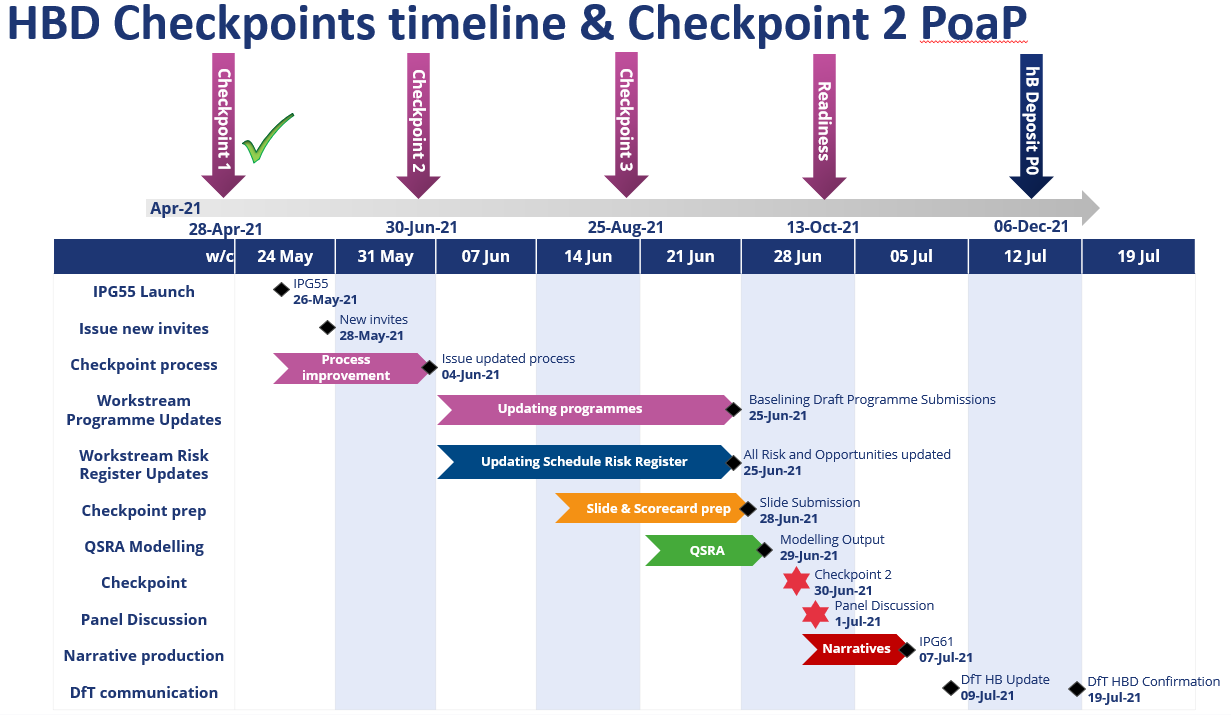
Programme checkpoints
A series of programme checkpoints was implemented at regular intervals with the aim of the demonstration of the robustness of the delivery plan to hybrid Bill deposit. There were three main checkpoints spaced at approximately two-month intervals followed by three readiness reviews at T-8, 4 and 1 weeks.
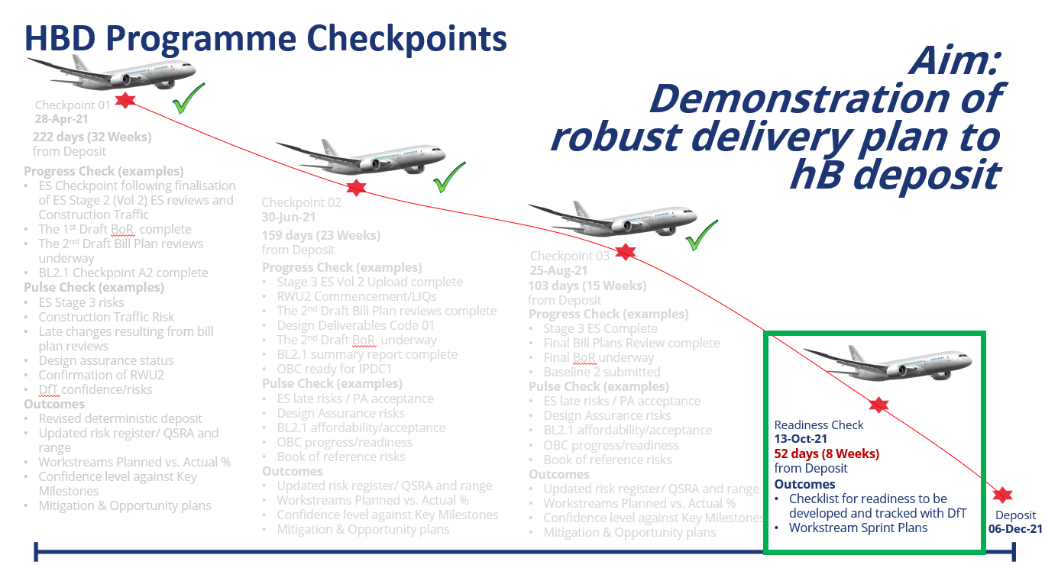
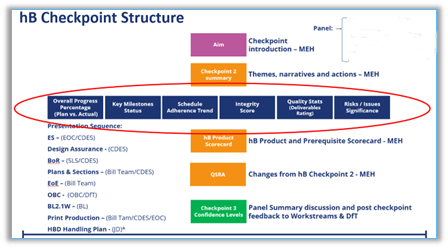
Each review was carefully developed with workstreams following a preparation plan, updating the schedule risk log, completing issued scorecard (shown below) and preparing a templated presentation slide pack. Slides templates were used so that each workstream approach was similar in order to give consistency of data and discussion. The presentation structure is shown in the blue boxes below.
The checkpoint included a panel from the HS2 Senior Leadership Team as well as external independent expert who would discuss and agree the summary narratives and scores.
Each review would cover closure of actions from the previous review as well as highlights of risk profile changes between checkpoint QSRAs.
Scorecard and presentations were spilt based on the Bill products (part of deposit submission) of environmental statement, book of reference, plans & sections and estimate of expense, and the prerequisites (not part of deposit but required for assurance purposes) of design assurance, outline business case, baseline cost as well as print production preparation.
To ensure a data driven approach to scoring, a scorecard for each section was designed covering programme quality measures (e.g. fuse attributes and schedule adherence as covered in earlier sections). These were combined with a risk score assessment and a quality measure based on the workstreams nominated measure. It was important to include a quality measure as a secondary metric to avoid solely a focus on programme.
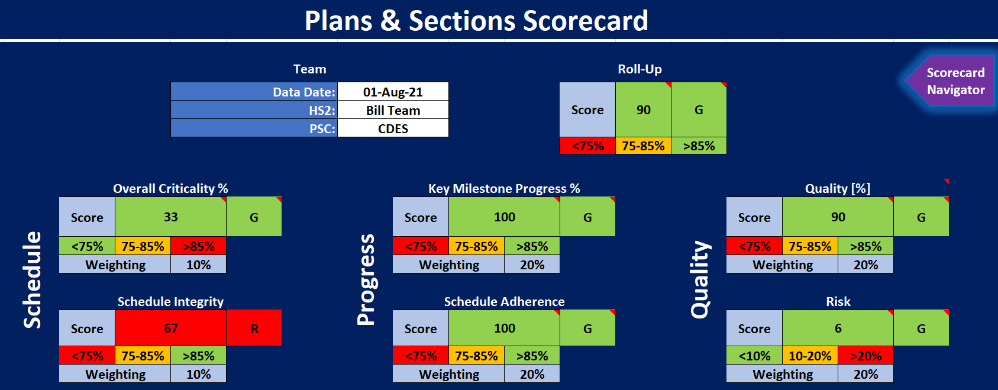
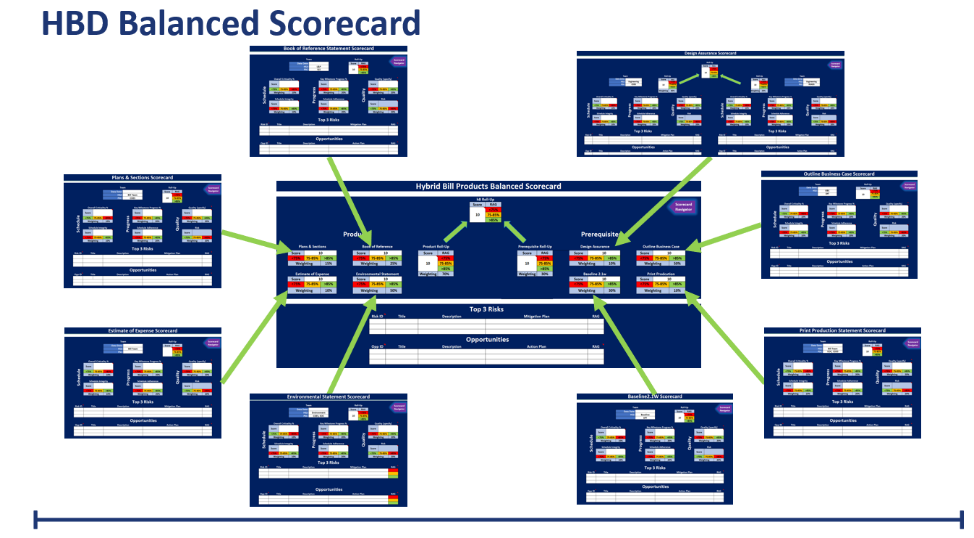
The importance of keeping each product & prerequisites scorecard consistent was to enable them to be rolled up into a balanced scorecard. This was done in a staged roll up giving a balanced score for products and prerequisites as well as an overall score for the hybrid Bill programme.
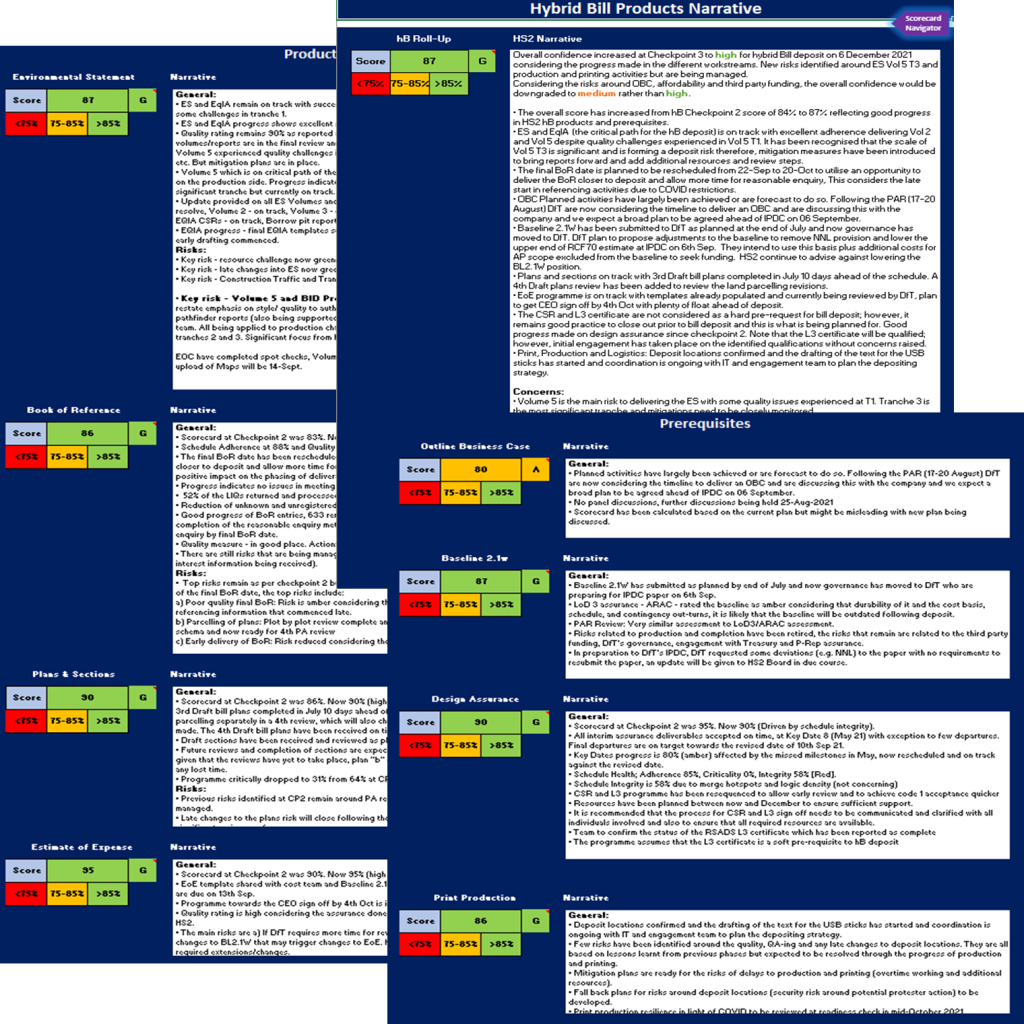
Finally, the scorecard included the summary narratives and any amended scores based on the panel discussion that follows the main checkpoint session. These formed the final recorded summary output of the checkpoint for communication to HS2 and DfT leadership. Each workstream received feedback on the final narrative with an opportunity to add or amend comments.
A recommended future focus on the checkpoint process would be to include a resource focus within the scorecard. This could be achieved by simplifying the programme measures where there is some amount of overlay on milestone measurements.
Risk modelling
Risk modelling is a fundamental requirement of any major programme. The delivery approach and improved tools to risk management. Standard tools were used for Quantitative Schedule Risk Analysis (QSRA).
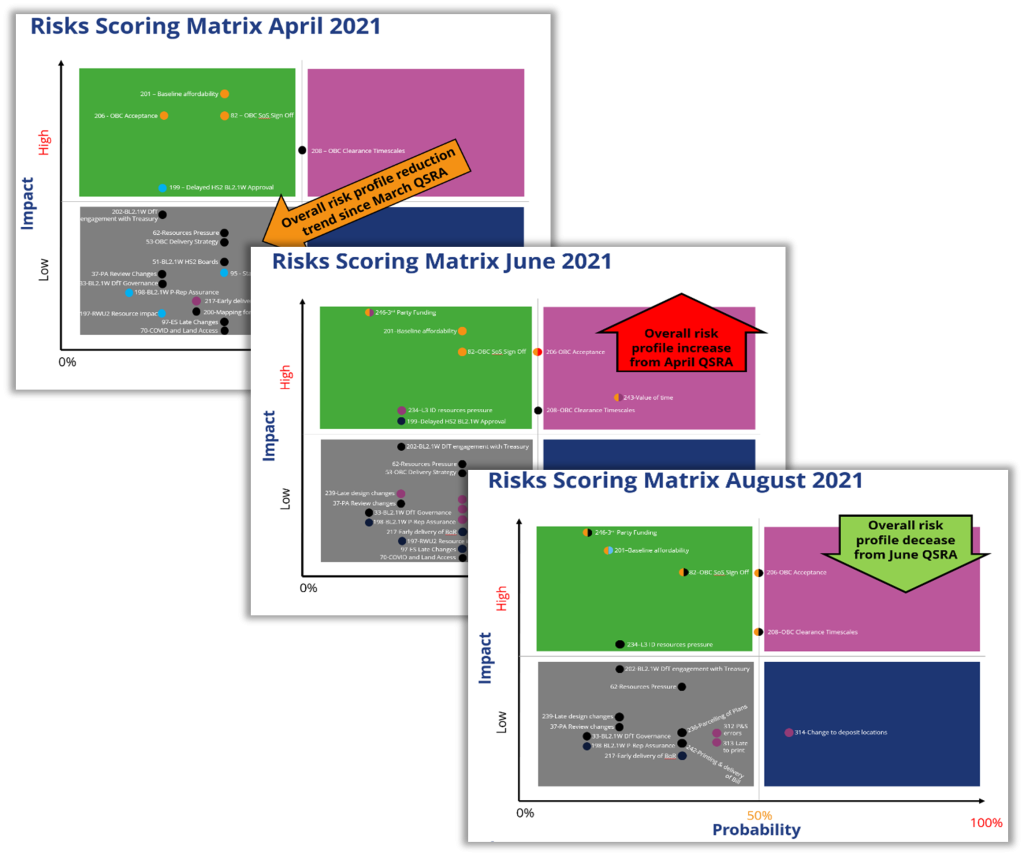
The hybrid Bill QSRAs were increased in frequency and aligned with the checkpoint process in order to validate schedule risk assessment updates and predicted possible deposit ranges to add to the checkpoint confidence assessment. Not shown here are the standard type of risk tornados that were incorporated within the full QSRA reporting however to simplify the explanation and direction of QSRA risk profile a 2×2 matrix was developed and standardised across all QSRAs. This enabled the progression of risk profile to be tracked throughout the course of the delivery programme by overlaying previous matrices.
Due to frequency of the later readiness reviews and the reduction in final programme activities towards completion, a QSRA was not rerun as it was considered the low numbers of remaining, largely critical path, activities would not lend itself to accurate results. Risks however were continued to be updated and the 2×2 matrix produced for use in readiness reviews and reporting.
Act
Schedule change control
Change to any programme will occur. The learning for schedule change is for the rapid and close management of changes, in particular interfaces, and to effectively communicate these quickly for mitigation or acceptance.
This was managed by a collaborative online SharePoint tool, giving access to PSCs to raise Change Requests that would allow interfacing parties to produce an impact assessment before any change was approved by the workstream leads, PM and planning team before updating of the schedule would be allowed. The SharePoint change list, example below figure 40, also affords a full audit trail of issues impacting change to the programme that can be used for lessons learnt when creating new baselines or other delivery programmes.
Power BI
Visualisation
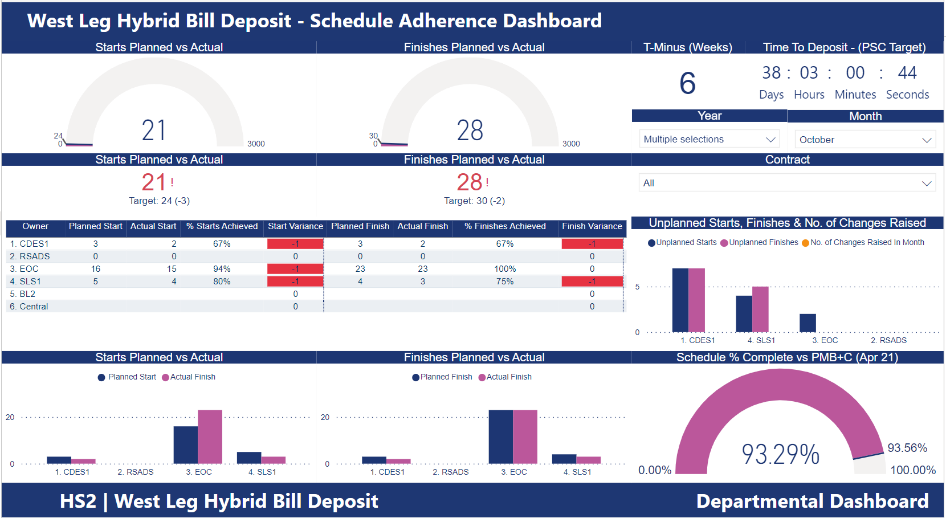
A theme throughout the hybrid Bill delivery programme was clear visualisation of data. The key tool used for this on Phase 2B was PowerBI that interfaced to the assured programme as the single source of truth. Process and tools have previously been highlighted within this paper for the development and control of the programme detail. Dashboards include several of the areas previous explained in this paper including key dates, Give-Gets and schedule adherence. The dashboard allows the data to be sliced in numerous ways inducing by month or by PSC/Workstream. Other features such as critical path analysis, activity s-curves and FUSE scores were also available.
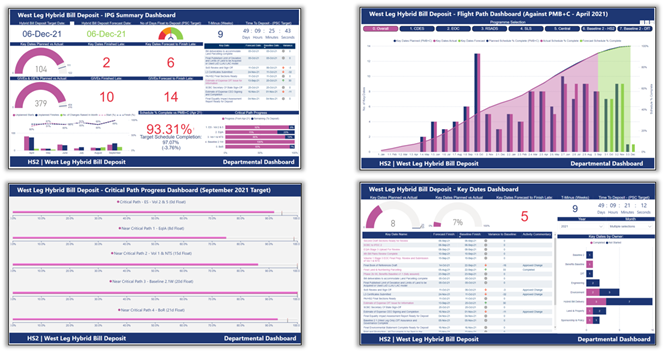
The interactive dashboards were used in the multiple forums, such as the IPG and weekly schedule review, as well being available for reference at any time. Dashboard reports were taken at regular intervals for record purposes as well as sharing with stakeholders, such as DfT. The IPG dashboard is shown as an example below however a bespoke dashboard for DfT meetings was products that covered specific DfT key dates, Give-Gets, risk and critical issues.
A recommended future focus for PowerBI is for PSC direct access. This could be direct to the central system; however programme IT restrictions may preclude, or to an offline version that can be hosted externally. A further option would be all PSC to hold a version for their own programmes and these are interfaced each month, however this would increase the administrative burden.
Deposit daily race card reports
An important feature of the project management was to increase the detail and frequency of reporting as the deposit target date approached. At T-2 weeks, reporting stepped up to a daily control meeting. The key was a simple format focusing on the day’s completed activities and the plan for the next day. Workstreams of production, land referencing and engagement & communications were represented each with a simple spreadsheet race card. The one shown below, figure 42 is the production race card, however it is not necessity need to be in a gant format if it represents the workstreams activities and can be easily tracked and updated.
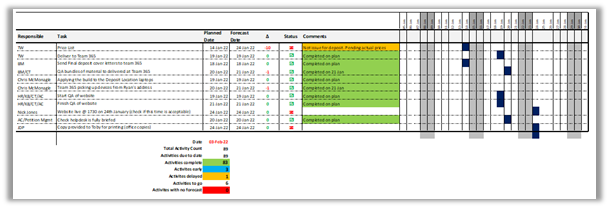
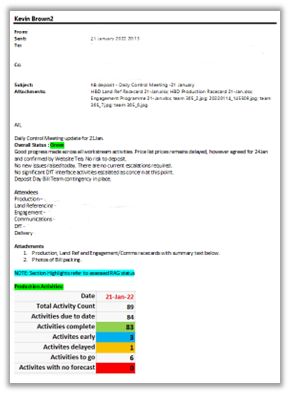
Each race card was summarised on a simple email report format, as shown in figure 43, to the Phase 2B senior leadership team to clearly indicate assessed RAG status, daily progress and escalation (and resolution) of issues.
A recommended future focus would be an automation of daily race card reporting. These could be populated in advance and allow a reduction in duration of the daily race card review meeting by allowing real-time update to progress during the day and reducing required meeting time.
Deposit ‘race day’ reporting
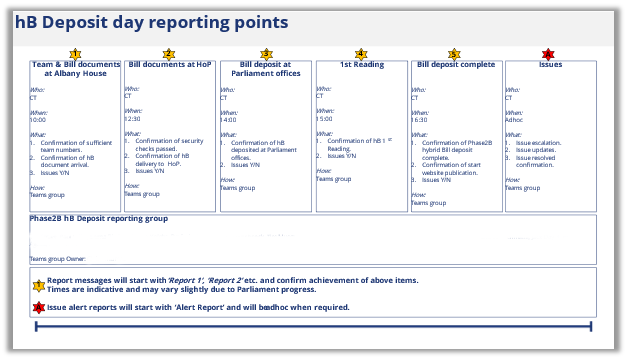
On deposit day, reporting was stepped up further to an hourly approach. The plan below, in figure 44 shows the planned sequence of key activities of the day with clearly defined reporting points.
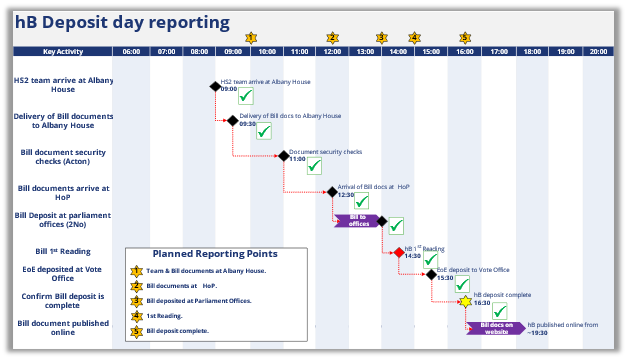
The reporting points were communicated to the report recipients prior to the deposit day so they could see which reports to expect and when. Instruction was also given to the recipients to wait for the planned reporting rather than chase for updates ad-hoc to allow the deposit manager to concentrate on deposit delivery requirements on the day. Separate from the planned reporting points was an alert report that could be used for immediate escalation. Messages were sent via a closed Teams group so that any messages on progress and issues could be consistently controlled.
This approach ensured regular, clear, pre-arranged reporting which took pressure off the deposit team from regular un-controlled requests for updates.
Outcomes and learning
The Bill was successfully delivered to the DfT revised target. One of the key differentiators of which were the behaviours engendered by the tool suite as well as those exhibited by the Phase 2B integrated team.
The paper has explained these tools and forums and how they were used for successful outcomes and how they can be further improved to help resolve issues encountered with the tool’s application. These include accessibility issues as well as control of ‘Third Party’ deliverables.
Recommendations
The key recommendations for future improvements have been included within each section throughout this paper.
Conclusion
The successful delivery of the Bill delivery programme, and any other similarly complex delivery programme, is the structured approach of the teams, tools, and techniques. Most of what has been covered in the paper will be in use in some form on any major scheme, however the key success of this programme was the integrated approach of how each tool and forum was interfaced with each other with a central focus on the IPG decision making group.
Acknowledgements
The successful project management of the Bill deposit was due to the significant efforts across all parties involved including HS2 workstreams, PSCs and DfT.
References
- Project Execution Plan – Phase 2B Western Leg Hybrid Bill Delivery
(eB: P2B-HS2-DL-PLN-M000-000003)
Peer review
- Paul Seller HS2 Ltd
- Bridget Badoe McQuickHS2 Ltd