Mathematical modelling of cross passage spacing in tunnels
Mathematical modelling of safety risk has a new resonance in the modern world. Government policy is driven by decisions based on current data, models of growth and impact of alternative risk mitigation strategies. In determining a way forward, comparisons are made of economic vs. safety benefit in the long term. Similar analysis has been undertaken by HS2 to drive many of its key engineering solutions and justify these decisions within a regulatory environment. This approach is demonstrated through the methodology developed for determining, from a safety perspective, the cross passage spacing within HS2’s bored tunnels.
Passenger transport tunnels are a particular concern regarding the risk of fire due to the limited escape means and the increased potential of becoming overcome by smoke. Some safety measures implemented within tunnels to manage the risk of fire are laid out in regulations, these cover elements such as flammability of materials or provision of an escape walkway. However, other measures are left up to the proposer of the railway to determine what is necessary and acceptable such as provision of mechanical ventilation, frequency of escape routes to a safe area. To assess these and determine if any safety measures reduced risk as low as reasonably practicable, HS2 needed to predict both the frequency and severity of fires within HS2 tunnels as well as the predicted impact of these. The conclusion of this study was a recommendation for a mixed cross passage spacing, with cross passages 350m apart near to intervention shafts but 500m elsewhere.
This paper outlines where there were challenges within the source data and applying this to HS2. The paper shows how different data sources were considered, new data developed, validated and applied.

Introduction
Mathematical modelling of safety risk is well established within the UK regulatory framework for safety critical industries[1]. The underlying foundation of many key design features are based on quantitative risk contours, target levels of safety or other such criteria.
For mainline railways, decisions on safety must be assessed under the Common Safety Method on Risk Evaluation and Assessment (CSM-RA)[2] Within this framework, hazards can either be accepted by
- Compliance with Codes of Practice (Standards),
- Compliance with a Reference System or
- Explicit Risk Estimation.
In this paper we concentrate where Explicit Risk Estimation has been used to make a key safety critical design decision on HS2. The challenge was to understand the predicted likelihood of the source hazardous event. This paper describes the approach, data sources considered and results of the assessments.
Fire frequency and severity within HS2 tunnels
A key question in the design of long tunnels within HS2 is the spacing of cross passages within the tunnels. HS2 tunnels are designed with two independent bores, these allow trains to travel well separated in opposite directions.
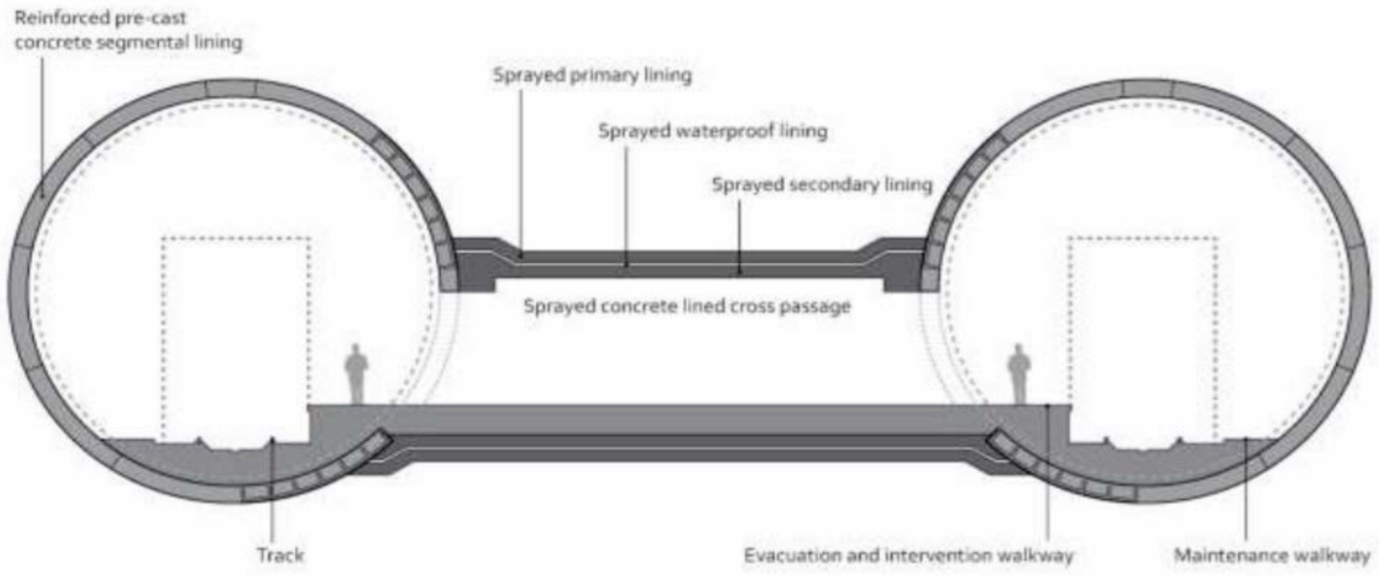
Connecting these bores are cross passages, as shown below in Figure 1. Cross passages serve a number of functions including:
- Permitting evacuating passengers to transit from one tunnel to the other in the event of an underground evacuation.
- Storage of critical equipment for tunnel operation.
- Allowing the transit of maintenance staff.
Cross passages to support evacuation are one of the two permitted approaches as outlined within the Safety of Railway Tunnels Technical Specification for Interoperability (SRT TSI)[4] from moving passengers to a safe area in the event of an emergency evacuation. In this approach, in the rare eventuality that a passenger train would stop in a long tunnel, then passengers would transit through the cross passage to the other tunnel bore which is defined a “safe area”. From there, they would transit to a final place of safety.
The SRT TSI also includes a requirement for maximum spacing of the cross passage at 500m separation in this configuration.
HS2’s evacuation philosophy in long tunnels is specifically designed around the length of the HS2 train and makes use of specific evacuation doors which are 350m apart as defined in the HS2 technical train specification[5]. These doors are planned to be used in predefined preferred tunnel evacuation locations.
The key question for assessment is to decide if the spacing of cross passages should be every 500m as defined as acceptable in the SRT TSI or is there is a safety benefit (and this being of sufficient magnitude) to space cross passages every 350m throughout the tunnel.
The difference in reality is approximately 10 cross passages between each intervention shaft at 350m spacing, but potentially only seven cross passages between shafts for a mixture of 350m and 500m spacing.
Approach
An impact assessment was undertaken for the two different scenarios. The key differentiators were that the 350m spacing throughout resulted in:
- Greater construction risk identified as more cross passages would need to be built and this is a difficult construction methodology. Although initial quantitative analysis shows that this risk delta is not large.
- Higher cost, the specific cost of each cross passage depends on detail of construction methodology and specific rock formation. Although a cost of £1m per cross passage is not considered unreasonable.
- Higher environmental impact, with more spoil, and more energy intensive methods needed to construct the cross passages.
- More railway systems equipment (cross passage doors, sensors, alarms, lighting etc.)
- Possibly a system safety benefit in reduction of walking distance for passengers evacuating in a fire if the train stops away from a shaft.
The assessment therefore focussed on determining the extent (if any) of the safety benefit to evacuating passengers to understand if that risk trading is appropriate.
A system safety management plan was developed to outline the key stages of the assessment. In summary this involved:
- Estimating the frequency and magnitude of train fires expected in HS2 tunnels.
- Estimating the likelihood that as a result of the train fire, the train would be able to reach the open route, or the planned tunnel evacuation locations or stop randomly in the tunnel.
- Estimating the increase in consequence for evacuating passengers due to walking further to a cross passage.
- Comparing this change in risk to the increased cost and other disbenefits to establish if the change in reasonable.
Step 1: Estimating the frequency and magnitude of train fires expected in HS2 tunnels from historic data.
The RSSB’s Safety Risk Model (SRM)[6] predicts a total frequency of fires on passenger trains across the national rail network of 53.12 per year. That figure is corroborated by recent annual train accident returns[7]:
2012/13 40
2013/14 31
2014/15 34
2015/16 37
2016/17 43
The definition of a train fire, for the purposes of the above reporting, is one that involved fire brigade intervention. Fires that were extinguished by the train crew or by automated fire suppression systems are not included in these totals. Thus, the frequency of fires on trains in the train accident statistics is the frequency of fires that is of concern to this study. Studies by BRR circa 1989[8] suggest that approximately 20% of the total number of fires on passenger trains meet the criteria for inclusion in the train accident statistics.
The SRM does not thoroughly model the possible range of variation in the severities of fires on trains. The overall average of consequences is 0.0012 Fatalities and Weighted Injuries (FWI) FWI per event, and the sub cases contributing to that figure are in the range 0.008 to 0.0019 FWI per event. Thus, at a national level, the predicted collective level of risk to passengers from fires on trains is not very high at 0.064 FWI per year. This means that most passenger train fires produce few, if any, casualties and that fatalities from train fires are rare events.
A survey of published accident reports confirms that cases involving potentially life-threatening fires are rare where the outbreak of the fire is the principal accident, and not a secondary consequence of another cause of accident. Over the past 50 years there are two notable cases, Cadder in 1983[10] and Maidenhead in 1995[11], that are comparable with the severity that was anticipated when determining the HS2 tunnel fire evacuation procedures. Both of these fires involved BR MkIII coaches. Such fires were more frequent in the 1940s and 1950s, but involved rolling stock constructed largely from wood, and so are not useful to this study.
Further analysis of the Cadder and Maidenhead accidents is not useful to developing a Quantified Risk Assessment (QRA) model for HS2. The former was attributed to a discarded cigarette, and the latter was caused by a fuel tank rupture on a HST power car.
The RSSB have made available to HS2 some unpublished data from their train accident database that is used to compile the SRM. These are the narrative text fields from records involving fires on trains and give some indication of what was fuelling the fire and the resulting fire intensity.
The RSSB SRM[6] represents the occurrence of train fires as the number per train kilometre. There is a range of values depending upon the type of train (loco hauled vs multiple unit, diesel vs electric traction, etc.) involved. None of these types are representative of the HS2 rolling stock, and so some hybrid fire frequency must be derived.
The fire frequency affecting HS2 trains estimated from the SRM tables is 5.91×10⁻⁸ per train kilometre. That number is built up of contributions from various accident sub-categories in the SRM but excludes items such as fuel or engine fires on diesel units that would not be applicable to HS2. The total fire frequency is distributed among the accident sub-categories as follows:
other underframe fires 14.3%
current collection 11.4%
external electrical equipment (underframe) 11.0%
arson / vandalism 10.3%
external mechanical equipment (not underframe) 9.6%
internal electrical equipment 6.7%
catering equipment 6.7%
brake dragging 6.6%
traction motor 6.3%
human error 5.8%
HV distribution 3.9%
external mechanical equipment (underframe) 3.3%
external electrical equipment (not underframe) 2.3%
internal mechanical equipment 1.5%
hot axle box 0.3%
The train fire frequency at the root of the QRA event tree is the rate derived from the SRM multiplied by traffic volume (e.g. as trains per year), and multiplied by the length of route over which a train is either in or committed to entering a long tunnel. This product has dimensions of fires per year.
The traffic volume for the Phase One (London to West Midlands) part of the route is assumed to be:
- 17 trains per hour
- 18 hours per day
- 363 days per year
Thus, the total traffic through the tunnels is 8.442×10⁶ train km per year on both the up and down lines. This number, when multiplied by the fire frequency described in above, gives a frequency of train fires in the Phase One long tunnels of 0.5 per year (the precision has been limited to one significant digit given the uncertainties in its derivation). This is the frequency that appears at the root of the Quantitative Risk Assessment (QRA) event tree.
The data set provided by the RSSB contains 390 records covering approximately 19 years between February 1998 and December 2016 but is not a complete history of the passenger train fires over that period.
For QRA modelling the train fire classifications that are used by EN 50553[12] for assessing the running capability of rolling stock have been adopted. These are:
- Type 1 Not presenting a significant risk of death or serious injury, and not affecting the running capability of the train.
- Type 2 Presenting a significant risk of death or serious injury, and potentially affecting the running capability of the train. EN 45545[13] requires that the train is designed to be capable of running for 15 minutes following the outbreak of such a fire.
- Type 3 Fires beyond Type 2 of sufficient severity to make designing for continued running infeasible.
Most of the cases described in the RSSB data set are Type 1 fires. To develop the model further it is necessary to distinguish between internal and external fires. The predicted HS2 train fire frequency described above divides 35% : 65% between internal and external fires, and that ratio is used for the event tree calculations. Refer to Figure 2.
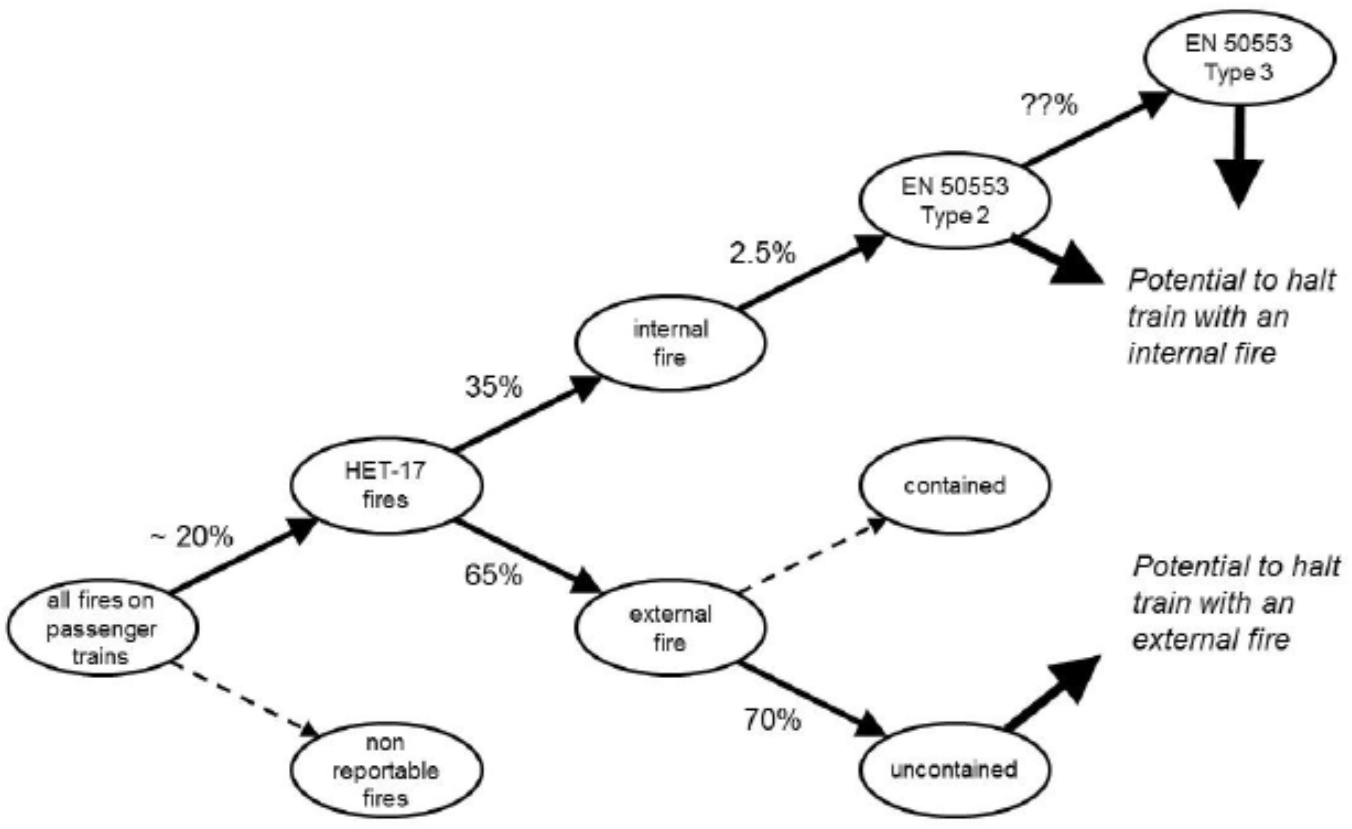
Internal Fires
Among the cases of internal fires described in the RSSB data set about 2.5% could be considered to qualify as Type 2 fires. EN 50553[12] specifies a reference Type 2 fire to be used as a design basis. This has a heat release rate of 75 kW for 2 minutes followed by 150 kW for 8 minutes. For the purposes of the QRA model all Type 2 fires are treated as having this intensity.
Among the cases of internal fires described in the RSSB data set there are none that would qualify as Type 3 fires. However, the possibility of a Type 2 fire escalating to become a Type 3 fire must be recognised. EN 50553 does not specify a reference Type 3 fire. The materials of construction used for the rolling stock are specified so that they are unlikely to provide sufficient fuel to produce a Type 3 fire, and so fuel for such a fire is brought on board in the form of passengers’ baggage. A credible Type 3 fire would be the contents of a luggage rack being ignited either maliciously or accidentally (e.g. by a defective lithium battery). In an example test[14] a peak heat release rate of 1.3 MW was produced from 33.6 kg of baggage. For the purposes of the QRA model all Type 3 fires are considered to be of 1 MW intensity.
Although the train is designed to continue running following the outbreak of a Type 2 fire there is the possibility that the protection may fail when demanded, and the train would be halted in the tunnel with a Type 2 fire. Similarly, there is an increased likelihood, but not a certainty, that the train is halted in the tunnel with a Type 3 fire. There is also an assumption that an internal Type 1 fire is never capable of halting a train.
For an internal fire to affect evacuation through the tunnel requires the windows on the affected vehicle to break so that smoke enters the tunnel. Previous Computational Fluid Dynamics (CFD) modelling performed by WSP[9] had the windows fail when the glass temperature reached 300 C. The gross internal volume of a HS2 train passenger compartment (i.e. neglecting the volume that is displaced by seats and other fittings) is about 96 m3. Heating that quantity of air from 25 C to 300 C requires an energy input of approximately 25 MJ, and a reference Type 2 fire, once developed, would release that in less than 3 minutes. Thus, even without detailed consideration of mixing within the compartment volume and of heat transfer rates between the air and the surrounding solid surfaces, it is reasonable to assume that a Type 2 fire (and hence also a Type 3 fire) will cause window failure. Similarly, Type 1 fires are assumed not to cause window failure.
External Fires
Excluding the cases involving burning diesel fuel or DC traction power arcing, neither of which are applicable to HS2, none of the external fires described in the RSSB data set achieve an intensity beyond that of a Type 1 fire. However, for the reasons developed below, an external fire on a HS2 train could burn for some time before being detected, and so despite being of a lower intensity does have the potential to affect the running of the train.
Where the fire is within an external equipment enclosure automatic fire detection may be provided, and since the enclosures are mostly associated with the traction systems even in the absence of fire detectors the effects of the fire on the train’s performance are likely to be discernible. The RSSB data set shows that fires of this nature, about 30% of external fires, are usually contained within the affected equipment enclosure and do not spread to cause wider damage. Given the distribution of sub-systems along the length of a unit, fires of this type are not considered to be a cause of trains being halted in the tunnel.
About 4% of the external fires described in the RSSB data set involved equipment installed on the vehicle roof, with the remainder involving equipment mounted on the underframe. In the absence of a detailed rolling stock design that distribution will be assumed to be also applicable to HS2 trains.
The principal fuel of enduring uncontained external fires is accumulated oil, dirt and debris on the vehicle underframe. Although these tend to be slow smouldering fires they can, given time while they remain undetected, cause damage to wiring and other exposed components in the vicinity, and so have the potential to halt a train in the tunnel. Such fires are modelled with an intensity of 100 kW because that is the lower limit at which the smoke effects model [15] can be applied, in practice they would be much less intense.
A characteristic of the external fires described in the RSSB data set that are applicable to HS2 (i.e. excluding the cases involving burning diesel fuel or DC arcing), is that they do not penetrate the interior of the train, and so do not constrain the movement of crew or passengers within the train during the evacuation.
Step 2: Estimating the likelihood that as a result of the train fire, the train would be able to reach the open route, one or the planned tunnel evacuation locations or stop randomly in the tunnel.
Tunnel Exit Philosophy
In general, following the detection of a fire while in or approaching a tunnel the ATO Stop function is activated. This automatically guides the train so that it stops at a designated location outside the tunnel. During the time taken to stop passengers in the carriage affected by the fire move to the adjacent vehicles. The ATO Stop location may be a station or at a tunnel portal, and the passengers are evacuated there. There are two circumstances where this is not done.
The first is where the train is already stopped at a signal in a tunnel when the fire occurs. The signal locations coincide with the tunnel ventilation section boundaries so that a train waiting at a signal has its primary evacuation doors aligned with the tunnel cross passages. In this case the train does not attempt to move and is evacuated from where it stands.
The second is where the fire occurs in an end carriage, and there are passengers trapped behind the fire unable to reach the adjacent carriage. In this case the train must make an immediate emergency stop so that the trapped passengers can make their own (unmanaged) evacuation as soon as the train is stationary.
Other than in the two scenarios described above a fire evacuation in a tunnel is done only if some failure prevents the train exiting the tunnel.
Causes of a Train Stopping in a Tunnel
The causes of a train being unable to exit a tunnel come under the following broad categories:
- loss of traction power (e.g. heat and smoke cause OLE flashover)
- fire damage to traction controls or motors
- fire damage causing brake application (e.g. severing the train line)
- damage to signalling / train control sensors (e.g. GSM-R antenna, balise reader, doppler radar, wheel tachometers) causing an emergency brake application
- passenger action (e.g. attempting to open doors) halts the train
In the absence of a detailed Failure Mode and Effect Analysis (FMEA) of a particular train design the above causes can only be modelled at a very superficial level. The effects of loss of power would be modified by the gradient in the tunnel, which could help or hinder the train being able to coast towards the tunnel exit. Consideration is being given to the requirements of the train’s “fire mode”, which inter alia specifies certain safety interlocks on the doors being supressed while the train is moving that would otherwise stop the train.
It may be assumed that a Type 3 (1 MW) fire has a greater likelihood of causing a train to be stopped in a tunnel than would a Type 2 (150 kW) fire, particularly as the train is designed continue running in the latter case.
The fire emergency procedure requires the train driver to take manual control after having ascertained that the train cannot reach the tunnel exit, and attempt to bring the train to a stand so that its primary evacuation doors are aligned with a pair of tunnel cross passages. Ideally these will be the pair of cross passages closest to a ventilation shaft because the clear air bubble effect is strongest at those locations and this is closest to the Fire and Rescue Service access points.
If the failure has resulted in uncontrolled braking the train driver’s intervention is irrelevant, and the train will come to a stand at some random location within the tunnel. If the failure leaves the train with some residual movement capability the success of stopping at a cross passage depends on the train driver’s expertise. (For example, this scenario could be performed as an exercise using a driver training simulator.) A particular burden on the driver is having to make the decision to intervene, which involves disengaging ATO Stop mode (which would have been activated immediately on receiving the fire alarm) and reverting to manual control. There is the possibility of the driver postponing this decision until it was too late for a successful intervention.
Given the lack of detail about the manner of a train’s movement capability being degraded, or about the effectiveness of intervention by the driver, the QRA model makes the pessimistic assumption that all forced stops in tunnels leave the train randomly positioned with respect to the cross passages.
Event Tree
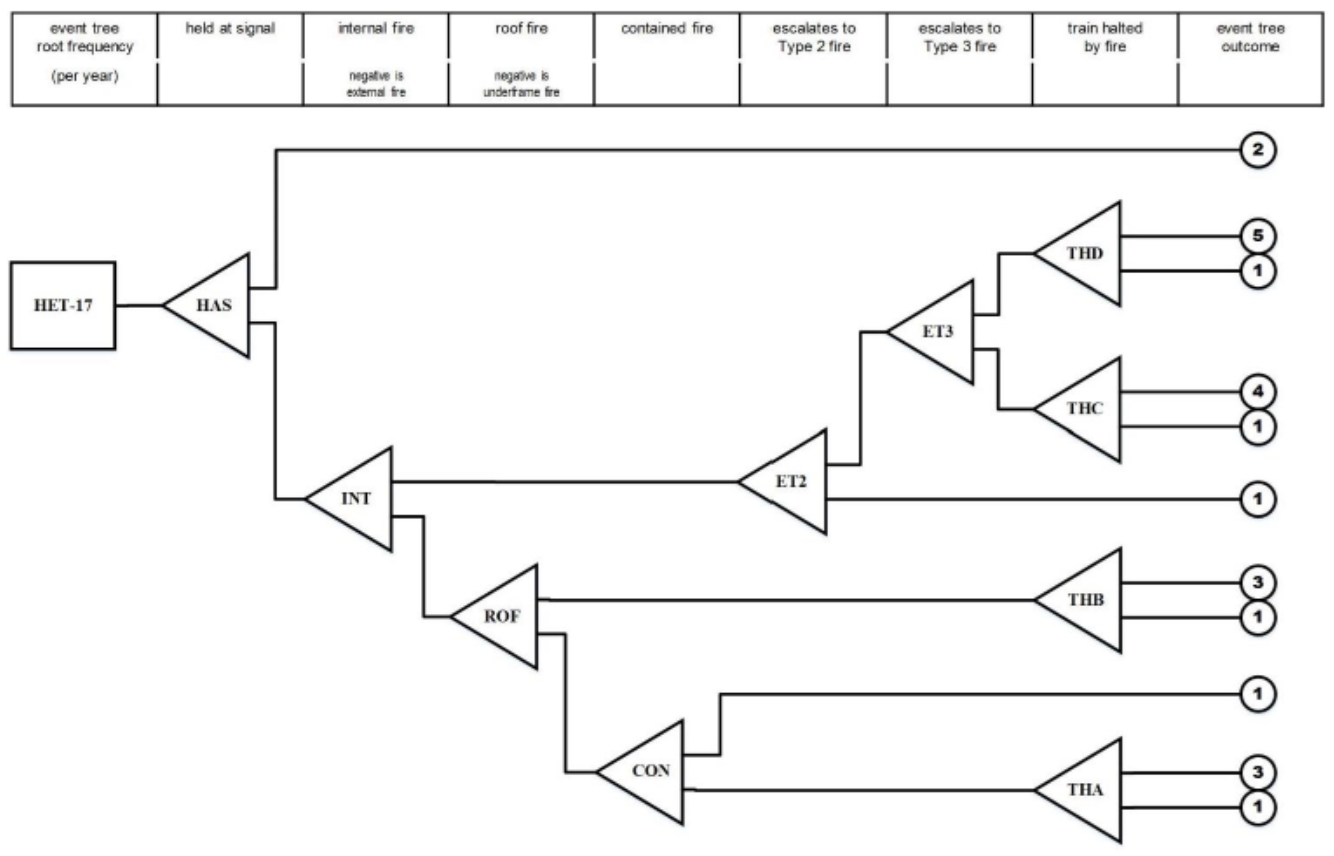
The event tree logic is shown in Figure 3 below. At each gate the convention used is the upper branch represents the true (i.e. the described event happens) condition, and the lower branch represents the false (i.e. the described event does not happen) condition.
The numbered terminal points at the right-hand side of the diagram represent the following outcomes:
- train exits tunnel, and then evacuates at ATO Stop location
- train evacuates in tunnel aligned with the cross passages closest to the ventilation shaft
- train evacuates in tunnel, stopped at a random location with respect to cross passages, and with an external fire
- as (3) above, but with a Type 2 (150 kW) internal fire
- as (3) above, but with a Type 3 (1 MW) internal fire
Step 3 Estimating the increase in consequence for evacuating passengers due to walking further to a cross passage.
From the event tree in Figure 3, the endpoint frequencies of the different events are calculated and shown in Table 1 below.
| Event Tree Endpoint | Endpoint Frequency (per year) |
|---|---|
|
(3) train evacuates in tunnel, stopped at a random location with respect to cross passages, and with an external fire |
3.167 × 10⁻⁴ |
|
(4) train evacuates in tunnel, stopped at a random location with respect to cross passages, and with a Type 2 internal fire |
1.416 × 10⁻⁴ |
|
(5) train evacuates in tunnel, stopped at a random location with respect to cross passages, and with a Type 3 internal fire |
2.209 × 10⁻⁴ |
The sum of these end point frequencies, 6.729 × 10⁻⁴ per year, is approximately one incident per 1500 years. Thus, a train being stopped in a tunnel by a fire is predicted to be a rare event.
Passenger smoke exposure model
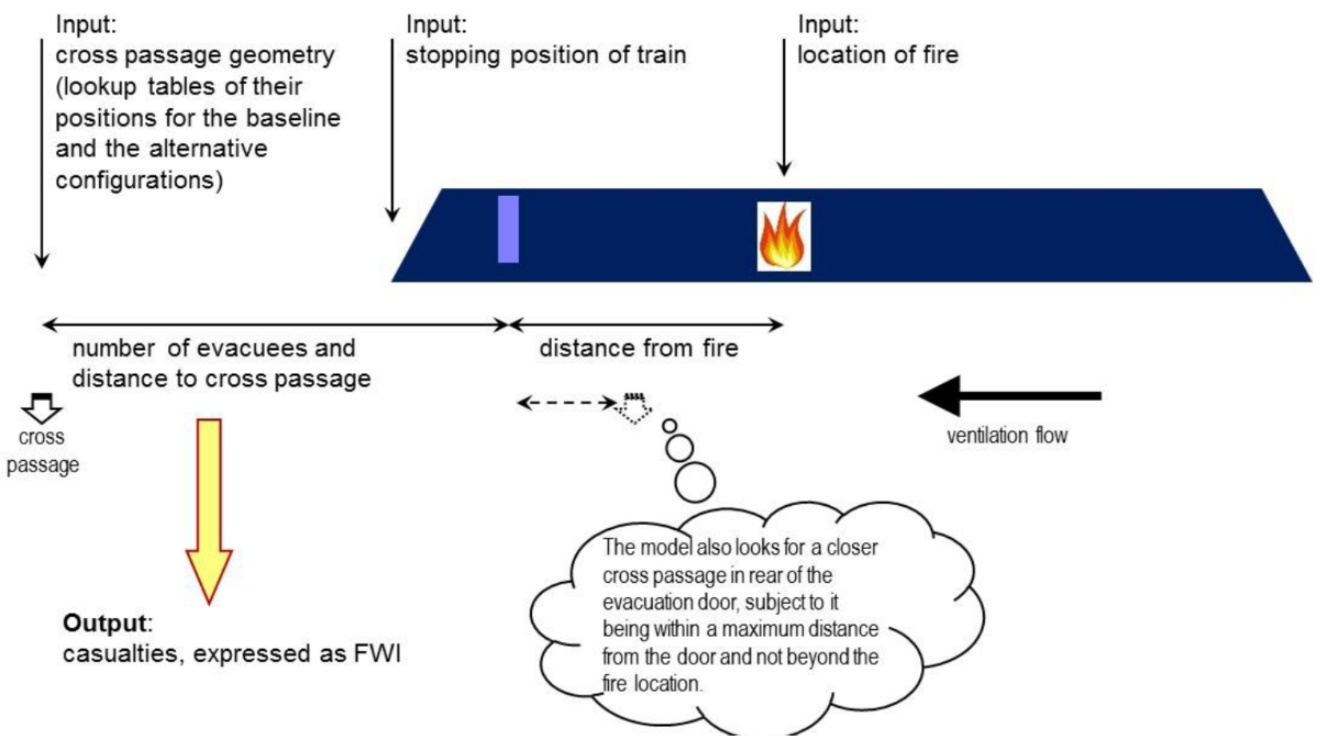
To determine the impact of different cross passage spacing on the consequences of an evacuation, a smoke fatality model developed by WSP was combined with a model of train stopping position into a smoke exposure model.
Figure 4 shows a simplified summary of the workings of the smoke exposure model. The inputs are the stopping position of the train (metres from the front of the train to the ventilation shaft ahead), and the location of the fire (vehicle number). These values are sampled assuming a uniform distribution from their ranges of possible values. The stopping position is in the range 0 to 3225 metres, sampled at 25 metre precision (i.e. one vehicle length). The vehicle number is an integer in the range either 1 to 8 or 1 to 16 depending on whether a single unit or two-unit train is being modelled.
The full ranges of the aggregated level of risk results are shown in Figure 5, presented as cumulative distributions, and are summarised in table 2 below.
| Level of Risk from Fire Evacuation in Tunnel (FWI per year) | With 350m Cross Passage Spacing | With 350m and 500m Cross Passage Spacing | Level of Risk Difference Between Cases |
|---|---|---|---|
|
5th Percentile |
0.0 |
0.0 |
0.0 (0%) |
|
Median |
1.867×10⁻³ |
2.525×10⁻³ |
6.58×10⁻⁴ (+35%) |
|
Average |
2.797×10⁻³ |
3.749×10⁻³ |
9.52×10⁻⁴ (+34%) |
|
95th Percentile |
8.474×10⁻³ |
1.111×10⁻² |
2.636×10⁻³ (+31%) |
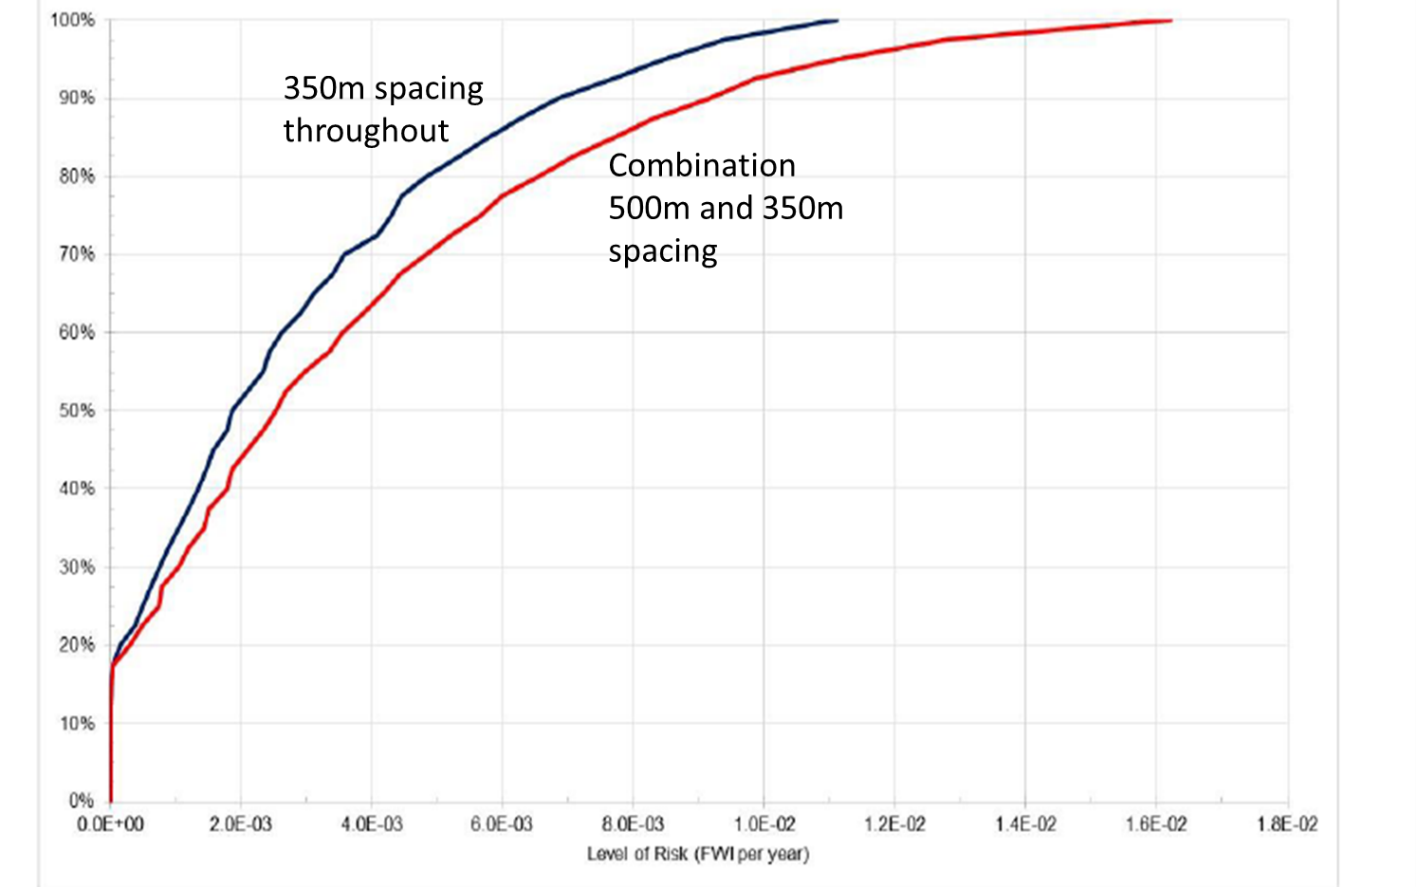
In Figure 5 the horizontal separation between the lines is the increase in the calculated level of risk. In the lower tail of the distribution the two curves converge at a zero level of risk. This arises when the combination of stopping position and fire location are such that all of the passengers are unaffected by the smoke plume.
The distribution of the median level of risk between the event tree endpoints is the same for both the base line and alternative cases. Thus, increasing the cross passage spacing increases the total level of risk, but does not alter the distribution of that total among the contributing scenarios.
Step 4 Comparing this change in risk to the increased cost and other disbenefits to establish if the change in reasonable
The difference in the predicted median levels of risk, 6.58 × 10⁻⁴ FWI per year, when multiplied over the lifetime of the railway represents a safety disbenefit arising from increasing the cross passage spacing.
A “reverse-As Low As Reasonably Practicable (ALARP)” calculation may be used to judge the significance of that increase. If the cost saving were instead treated as the cost of providing cross passage spacing reduced from 500 metres, and the output from the QRA model the safety benefit from such a reduction, the cost benefit analysis would show the cost of the proposal to be grossly disproportionate to the level of risk reduction. For this case the threshold between reasonably achievable and grossly disproportionate is found to be at about 0.05 FWI per year level of risk difference, i.e. about two orders of magnitude greater than that which is calculated by the QRA model. Thus, it may be argued that the change in the level of risk is negligibly small.
A mixture of 350m cross passage spacing at the shafts, with 500m spacing elsewhere is therefore the proportionate response.
Conclusion
This paper outlines the methodology for the determination, from a safety perspective, of the cross passage spacing within HS2’s bored tunnels.
The assessment seeks a balance between the legal minimum cross passage spacing (a cross passage every 500m) against a closer spacing (a cross passage every 350m) which could improve evacuation.
Following a detailed quantitative risk analysis, modelling the causes and likelihood of fires, along with the various train stopping positions and consequence profiles a compromise solution is found. This has 350m cross passage spacing around preferred evacuation locations (which are also Fire and Rescue Service intervention locations), with 500m spacing used elsewhere.
This conclusion results in a safe evacuation procedure, but at a lower cost and lower construction risk than previously assumed. Providing a best overall decision.
Acknowledgements
With thanks to Mark Gilbey, Technical Director, WSP for his work on smoke modelling which was used as part of this assessment.
References
[1] Health and Safety Executive (2001) Reducing Risk, Protecting People.
[2] Commission Implementing Regulation (EU) No 402/2013 of 30 April 2013 on the common safety method for risk evaluation and assessment and repealing Regulation (EC) No 352/2009 Text with EEA relevance.
[3] Commission Regulation (EU) No 1302/2014 of 18 November 2014 concerning a technical specification for interoperability relating to the ‘rolling stock — locomotives and passenger rolling stock’ subsystem of the rail system in the European Union.
[4] Commission Regulation (EU) No 1303/2014 of 18 November 2014 concerning the technical specification for interoperability relating to ‘safety in railway tunnels’ of the rail system of the European Union as amended by Commission Regulation 2019/776.
[5] High Speed Two Train Technical Specification Document, HS2-HS2-RR-SPE-000-000007.
[6] Railway Safety and Standards Board (RSSB) (2014) Safety Risk Model: Risk Profile Bulletin, version 8.1
[7] Railway Safety and Standards Board (RSSB) (2017) Annual Safety Performance Report 2016-17
[8] BRR (1990) Technical Memorandum Traction and Rolling Stock Fires on British Rail – 1989 TM HSU 002,
[9] High Speed 2 (2014) Burton Green Tunnel Ventilation Risk Analysis C240-PBR-TN-REP-030-000001, P03.0
[10] Department of Transport (1984) Railway Accident Report on the Fire that occurred on 16 August 1983 at Cadder HMSO
[11] Her Majesties Railway Inspectorate (HMRI) (1995) Report on a Fire on the 18:30 Paddington to Swansea Train near Maidenhead on Friday 8 Sept. 1995
[12] BSI (2016) BS EN 50553 Railway Applications – Requirements for Running Capability in Case of Fire on Rolling Stock, 2012 plus amendment A1, BSI, London, UK
[13] BSI (2013) BS EN 45545 Railway Applications – Fire Protection on Railway Vehicles Part 4 – Fire Safety Requirements for Rolling stock Design, BSI, London, UK
[14] Sherwood, Carl (2015) Why do design fires matter, Building Research Establishment Fire Conference, June 2015
[15] WSP (2018) Calculation of Evacuation Timings Calc 181 Rev 2, Apr 2018 [Unpublished]
Peer review
- Thomas Williamson, rail Systems Engineering DirectorHS2 Ltd