Semi-automated construction dust risk assessment tool
Risk assessment methodologies have been published by industry bodies to predict dust risk from construction activities. However, they involve simultaneous evaluation of multiple factors and variables, so these assessments are often outsourced to external consultants with the inherent implications for cost and waiting times.
A semi-automated risk assessment tool for construction dust was implemented in Balfour Beatty VINCI Joint Venture (BBV) that uses MS Excel to handle the complex logic prescribed in the dust risk assessment methodology, so that site-based environmental staff using their local site knowledge, need only input the level of dust likely to occur, and the number and type of nearby receptors. The dust risk assessment tool’s ‘logic engine’ accepts inputs from site-based environmental staff, conducts the assessment and presents the results all on a single page in MS Excel.
Site-based environmental staff, (after some basic training), can now successfully undertake dust risk assessments to an HS2 recognised methodology. This eliminates cost and retains control of preparation of risk assessments (and re-assessments) to maximise flexibility in support of project needs.
This paper will be of interest to other projects looking to utilise their existing site environmental teams to assess construction dust risk.
Background and industry content
BBV delivers the Main Works Civils Contract (MWCC) for the northern section of High Speed Two (HS2) Phase One, including Long Itchington Wood Green Tunnel to Delta Junction and Birmingham Spur and the Delta Junction to the West Coast Main Line (WCML) tie-in, being delivered by the BBV Integrated Project Team.
Construction of HS2 presents risks from the emission of dust arising from demolition, construction of new structures and earthworks and transfer of dust and mud on to public highways from vehicles travelling to and from construction areas. The degree of risk posed by dust is highly variable and influenced in large part by local weather conditions, the time of year and the sensitivity of nearby human and ecological receptors – especially for dust containing very small particles.
Environmental Minimum Requirements for HS2 Phase One – Code of Construction Practice (CoCP)[1] requires dust risk assessment of construction activities to be undertaken following the best practice methodology of the Institute of Air Quality Management (IAQM) – Guidance on the assessment of dust from demolition and construction[2] .The aim being to derive the risk of each site in order to inform the appropriate monitoring to be employed. In the case of a dust risk of Medium or higher, continuous monitoring must be deployed.
For a project on the scale of HS2, with many phases of construction activity and intensity at multiple and varying locations, literally hundreds of risk assessments (and re-assessments) were needed to adequately determine if the provision of continuous dust monitoring was necessary and where it should best be located
Although external specialist support to undertake such risk assessments had already been secured via a procurement framework agreement, it was recognised that this important construction deliverable would always be constrained due to external consultants having limited knowledge of current site activities and conditions. Consequently, their output would always be somewhat generic and further, was likely to take the form of a long report, which would take time to update as the construction programme activities and site conditions changed. In addition, there would be a known cost associated with external provision of this deliverable – around 2-3 consultant days.
The IAQM methodology was examined to determine whether it would be possible to undertake such complex construction dust risk assessments within BBV using input from local site environmental teams. Assessments would then be less generic and could be produced and re-assessed quickly as the construction programme progressed – and at much reduced cost.
The solution hinged on being able to ‘automate’ the complex conditional logic described in the IAQM methodology and guidelines, so that the site environmental teams only had to determine and input the local site variables – namely:
- How much dust would likely be generated from in-scope construction activities once all necessary mitigation measures were in place.
- Number, distance and type of receptors
On closer examination it became clear that the IAQM dust risk assessment guidelines[2] could indeed be represented using a series of logic tables and formulas within MS Excel – which could accomplish the majority of calculations of the risk assessment to yield an IAQM compliant result, providing that site environmental teams could satisfactorily input items 1 and 2 listed above.
Constructing the risk assessment tool
Making the dust risk assessment ‘Logic Engine’
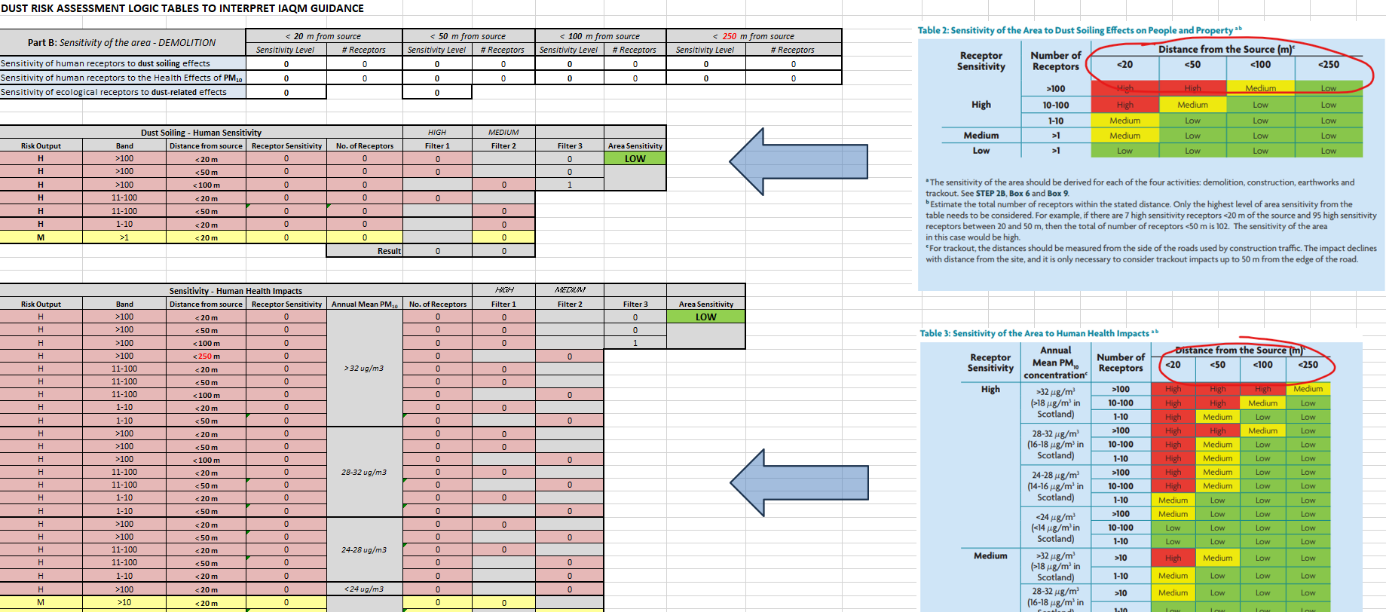
Firstly, it was necessary to convert the ‘analogue’ rules (logical arguments) described in the text and graphics of the IAQM guidelines into a series of digital formulas in MS Excel. This ‘logic engine’ could then automatically process the inputs made by the site environmental staff. Below in Figure 1 is an example showing three of the twenty-one logic tables that were required to make the logic engine – placed on a hidden tab in MS Excel.
User interface and supporting information
For simplicity and clarity, it was decided to handle all the risk assessment inputs and generate the dust risk results using a single page. which would be arranged to mirror the 5-steps of the IAQM guidance[2] itself which are outlined below.

To begin the risk assessment, site environmental staff enter a description of the construction activities and a map showing the site boundary, nearby houses and ecological features (receptors) plus a 250m buffer zone around the site boundary. See below in Figure 2 below.
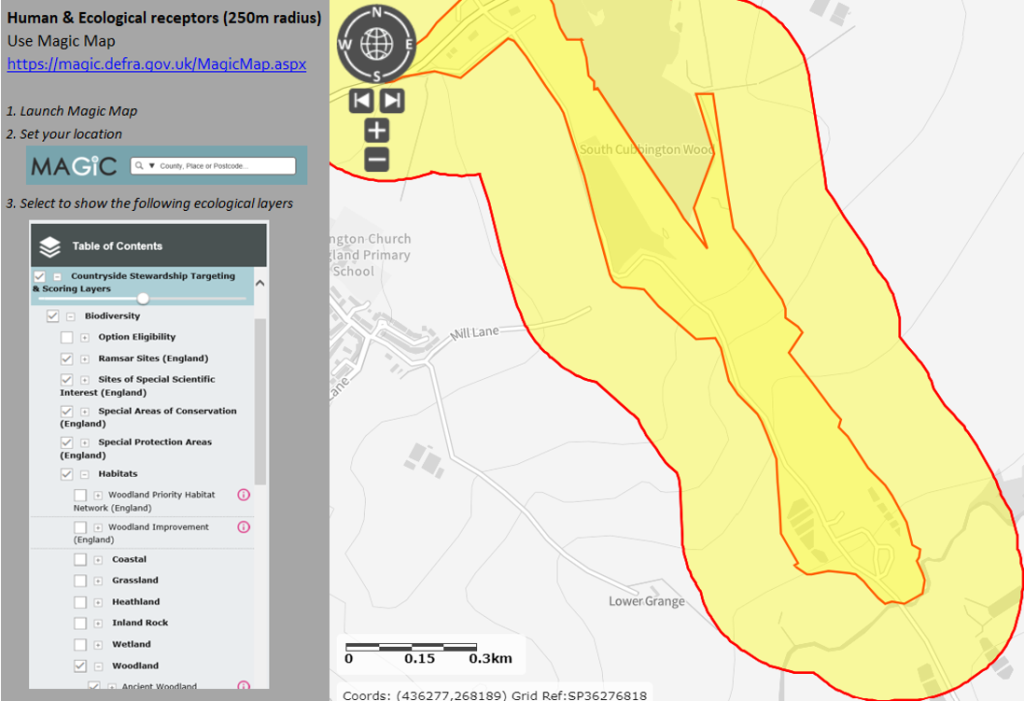
To assist the user to accomplish this with ease, a default map generator ‘magic map’ which is free to use online, was provided via a hyperlink on a separate Excel tab, see in Figure 3 below. Note that other mapping tools may be used instead.
Next follow the five steps of the IAQM dust risk assessment process itself [2, page 13]:
- Step 1 – screen the requirement for a detailed assessment
- Step 2 – assess the risk of dust impacts (4 areas: demolition, earthworks, construction and trackout)
- Step 3 – determine the site specific mitigation
- Step 4 – examine the residual effects
- Step 5 – prepare the dust assessment report
Steps 1 & 2 – Receptor screening and dust level estimates
In Step 1, using local knowledge and the boundary map above, the user (site environmental team) selects the presence of the described receptors (via a checkbox) and includes a short description for each category. See in Figure 4 below.

Conditional formatting is applied automatically to only reveal input fields for receptors confirmed in Step 1. For example, if no receptors are selected in Step 1, then no dust risk assessment is needed and the whole template remains greyed out with no user inputs possible. Usually however, receptors are present and the appropriate input fields are revealed to the user in Step 2.
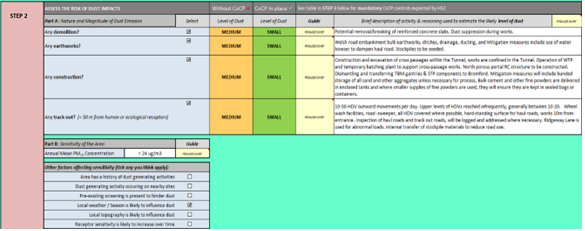
Further checkboxes in Step 2 (Part A) are used to select the categories of construction included in the assessment i.e., Demolition, Earthworks, Construction, Track Out, and a short description added. As before, only those selected activate input fields within the template.
Note: it is at this stage that the expected level of dust generated both with and without controls (CoCP[1]) is chosen via dropdown menu. See in Figure 5 below. These values are key inputs to the ‘logic engine’ and must be very carefully considered.
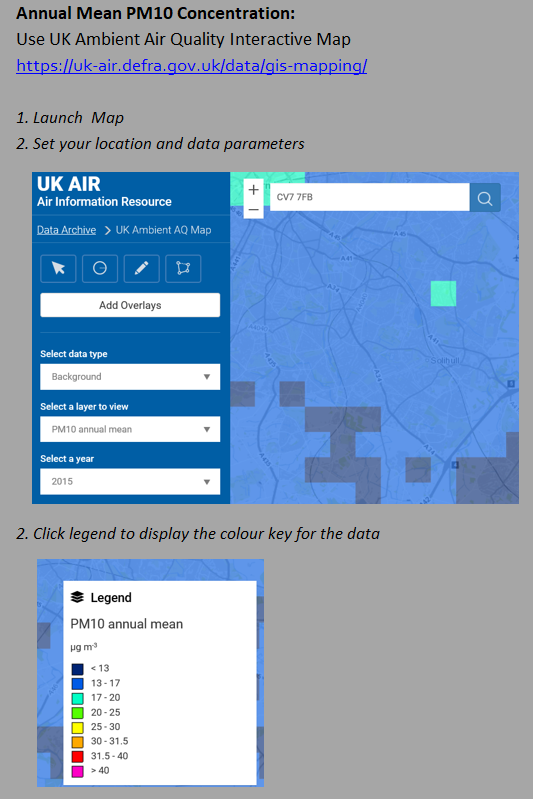
In Step 2 (Part B) above, the user is also asked to input the sensitivity of the area to micro-sized dust particles. To assist the user, as with magic map, a free resource weblink to a UK ambient air quality map is provided on a separate Excel tab. See in Figure 6 below
Next, the user makes the other important input to the logic engine – the number, distance and sensitivity of receptors between the site boundary and the 250m buffer zone on the map. See in Figure 7 below.
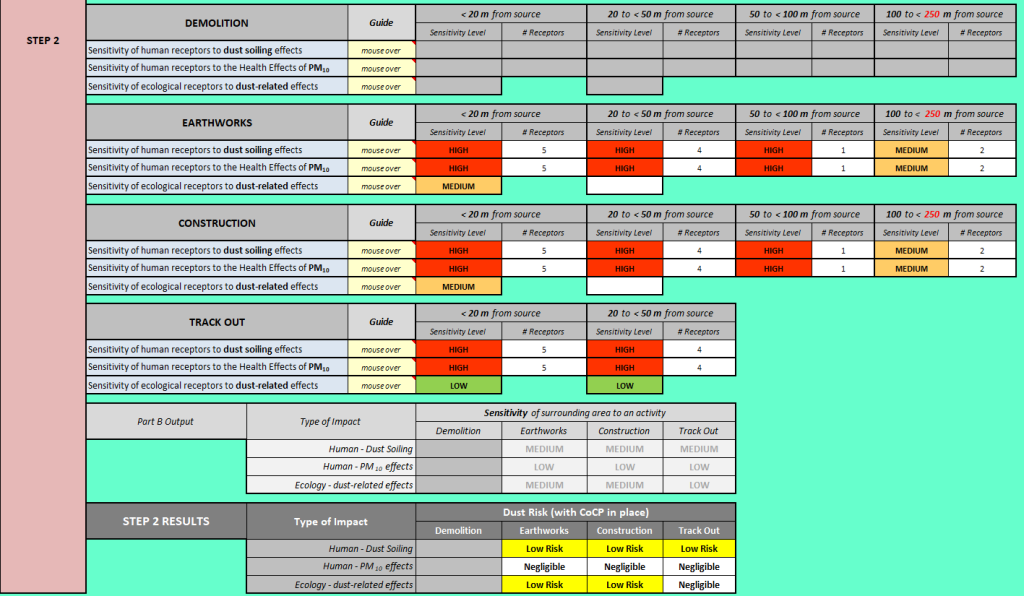
Users were instructed to keep the scale of the map to 200m so that distances could be judged visually by anyone reading the assessment. Once completed, an interim dust risk result is generated at this point.
Note that mouseovers were installed throughout Steps 1 and 2 to provide useful IAQM guidance to support users own professional judgement about the type and sensitivity of the receptors present. See Figure 8 below.

Steps 3, 4 and 5 – Dust mitigation arrangements and dust risk result
HS2 asked that the level of dust inputted in Step 2 (Part A) should assume full mitigation controls (as per CoCP[1]) were already in place and working, which made STEP 3 in the IAQM assessment process redundant .However, the guidance in Step 3 was retained in the template to help users implement CoCP[1] controls in Part A. Consequently, the usually interim result in Step 4 is presented as the actual final result. See in Figure 9 below.

Finally, Step 5 allows the user to summarise the dust risk result or choose to add a more detailed report narrative. See in Figure 10 below.

Testing and verification
The initial version of the dust risk assessment tool was tested using volunteers from several BBV site environmental teams based on their actual construction programme. Initial training was provided about how to determine the appropriate inputs for the risk assessment – particularly the level of dust expected (post mitigation) and type and sensitivity of receptors.
Their risk assessment results generated by the tool’s logic engine were compared to that produced by applying IAQM guidance[2] in the traditional way. In addition, HS2 Subject Matter Experts undertook validation of results produced by the tool. They also provided feedback about the structure and formatting of the user interface and the terminology used for the assessment inputs and results generated.
Subsequently, HS2 approved the use of the semi-automated dust risk assessment tool by BBV, and the current version is in its 4th issue following amendments to address minor bugs in the logic calculations spotted during ongoing testing, improvements to conditional formatting suggested by HS2 and to reflect changes in IAQM guidance[2].
Ongoing support and validation
Refresher training is provided from time to time to site environmental teams, including new starters. In addition, all dust risk assessments produced by the site environmental teams using the tool continue to be reviewed by subject matter experts at both BBV and HS2 before being officially accepted and recognised. This ensures that the assessments remain robust and refresher training is targeted appropriately.
Lessons learned and successes
The implementation and continued use of semi-automated construction dust risk assessment tool shows that:
- Established legacy resources such as MS Excel, can still be used innovatively to achieve sizable productivity gains.
- With the right support such as automated logic tools, even complex risk assessments can be successfully undertaken by site environmental teams quickly, accurately and consistently without recourse to external consultants.
- 150+ dust risk assessments have been prepared to date using the semi-automated Construction Dust Risk Assessment Tool saving approximately £400,000 in external consultant fees.
- Collaborative working between site teams, central enabling function and HS2 subject matter experts made this solution possible.
- The semi-automated construction dust risk assessment tool can be used by other construction projects (see supporting materials below).
Recommendations
The semi-automated construction dust risk assessment tool is readily usable by other construction projects, subject to consideration of:
-Native language – currently the tool is only available in English.
-Provision of suitable training to site environmental staff regarding its use.
-Any required adjustments to the tool interface and logic engine in response to changes in published IAQM guidance.
Acknowledgements
Andrea Davidson – Head of Environmental Sciences, Technical Services Directorate, HS2 Ltd
Sam Williams – Construction Noise, Vibration & Air Quality, Balfour Beatty VINCI Joint Venture
Alexander Hemming – Senior Environment Manager (Sublots 1, 4, 7 & 8), Balfour Beatty VINCI Joint Venture
References
[1] High Speed Rail (London-West Midlands) Environmental Minimum Requirements Annex 1: Code of Construction Practice (February 2017). Accessed 26 October 2024.
[2] Institute of Air Quality Management (IAQM): Guidance on the assessment of dust from demolition and construction, January 2024 (version 2.2) . Accessed 26 October 2024.
Supporting materials
Peer review
- Shital-Shirsat RohekarHS2 Ltd

