Shaft friction design for piles in extremely weak to weak Mercia Mudstone
There is limited guidance for pile design in the Mercia Mudstone, when it varies between a weathered stiff clay and unweathered weak mudstone. In this transitionary zone, it is common for the mudstone to be found interbedded with varying degrees of weathering over a significant depth, or for the material to gradually transition from a clay to a weak mudstone. One of the key problems identified in CIRIA R181 related to pile design in weak rocks is a poor understanding of pile behaviour. This paper summarises the largest pile test programme carried out in Mercia Mudstone, at several locations across the High Speed 2 Phase One Area North route. Based on these tests, and supported by available published literature, two updated methods for calculating pile shaft capacity are proposed. The first, is an update to the effective stress approach and the second an update to the relationship with UCS (in CIRIA R181) to take account of rock quality and the geology. For both these methods consideration is given to the influence of the wider geological setting, local stress history and pile construction with the aim of improving the reliability of shaft friction assessments in this complex geology.
- Written by
-
Stephanie Markvukaj (Mott MacDonald/BBV)

-
Sarah Pye (Mott MacDonald/BBV)

-
Michael Vance (Mott MacDonald/BBV)

-
Imran Farooq (BBV/Mott MacDonald)

- Resource type
- Resource type: Technical Paper
- Intended audience
- Consultants
- Tags
- Mercia Mudstone, shaft friction, shaft resistance, piling, bored, CFA, bentonite, design posts
Notation
𝛼 Dimensionless coefficient relating undrained shear strength and shaft friction
𝐴𝑠 Pile cross-sectional area
𝛽 Dimensionless coefficient relating vertical effective stress and shaft friction
𝑑 Pile diameter
𝐸𝑐 Young’s Modulus of concrete
𝐼𝑠,(50) Point load resistance index
𝐾0 At rest earth pressure coefficient
𝐾𝑠 Earth pressure coefficient following pile installation
𝑀𝑠 Shaft flexibility factor
𝑞𝑠 Unit shaft friction
𝑠𝑢 Undrained shear strength
𝜎𝑐 Unconfined compressive strength (UCS)
𝜎𝑣′ Vertical effective stress
𝜓 Dimensionless coefficient relating uniaxial compressive strength and shaft friction
Introduction
This paper presents some data, and shaft friction design recommendations based on this data, from the largest preliminary static pile test programme carried out in the Mercia Mudstone Group (MMG). This pile testing programme was carried out as part of the Main Works Civils Contract (MWCC) by the HS2 BBV IPT for the northern section of High Speed Two (HS2) Phase One Area North (running from Long Itchington Wood to Birmingham via the Delta Junction, and the Delta Junction to the West Coast Main Line (WCML) tie-in near Handsacre). There is limited guidance for pile shaft friction design parameters in the Mercia Mudstone.
This material is an Intermediate Geomaterial and straddles the boundary between soil and rock, commonly varying between a stiff clay and extremely weak to weak mudstone as defined by BS 5930 (2015)[1]. In such situations, it is common for either the mudstone to be found interbedded with varying degrees of weathering over a significant depth or for the material to gradually transition from a clay to a weak mudstone. As will be discussed later in the paper, there is considerable difficulty in taking good quality representative samples in this material, which leads to significant scatter in laboratory data. Standard Penetration Tests (SPTs) are of questionable value, also exhibiting considerable scatter. This results in considerable uncertainty in conventionally derived total stress strength parameters, such as undrained shear strength, 𝑠𝑢, and unconfined compressive strength, UCS, especially when empirical correlations are used to interpret strength.
Shaft friction, 𝑞𝑠, can generally be calculated from vertical effective stress and 𝛽 (Equation 1).
𝑞𝑠(𝑘𝑃𝑎) = 𝛽 × 𝜎𝑣′ (1)
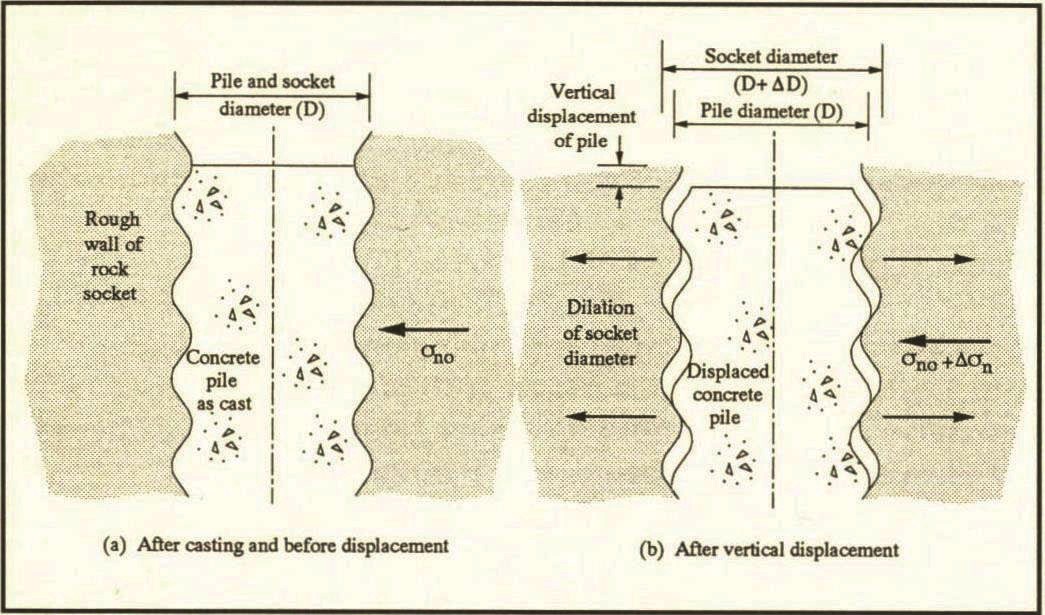
𝛽 is a coefficient that is a function of interface friction and mobilised horizontal effective stress. The mobilised horizontal effective stress is a function of three factors: the initial horizontal effective stress, pile installation effects, and constrained dilation as illustrated by Figure 1 taken from Seidel and Haberfield (1995).[2]
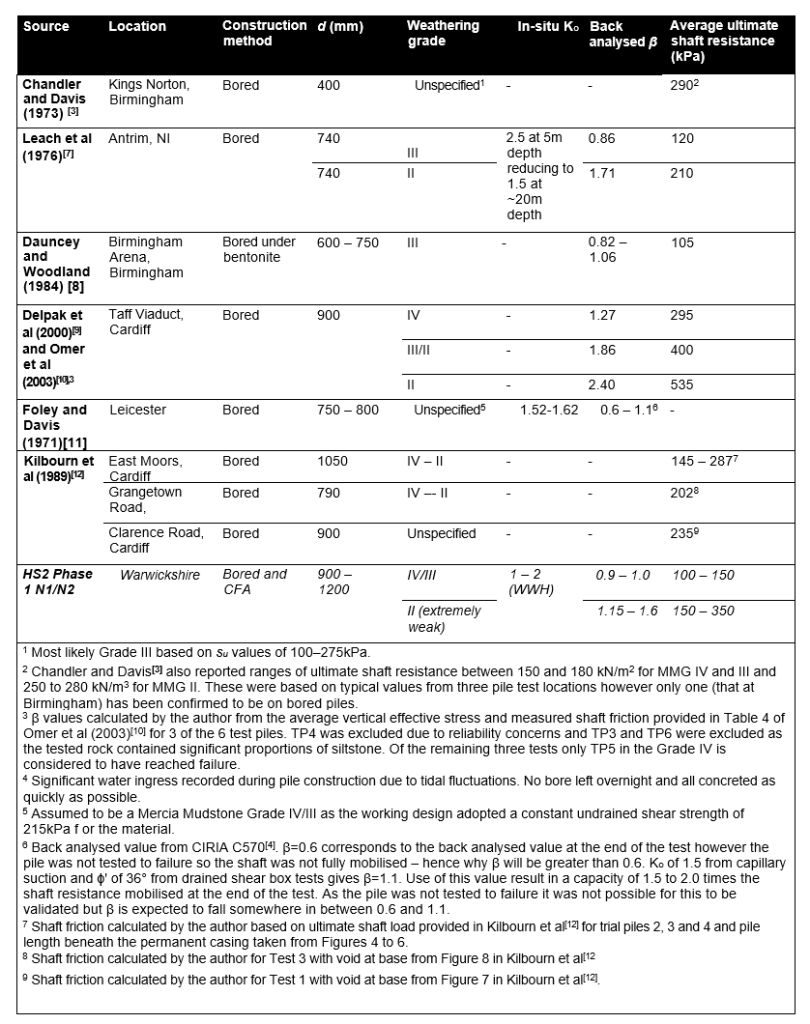
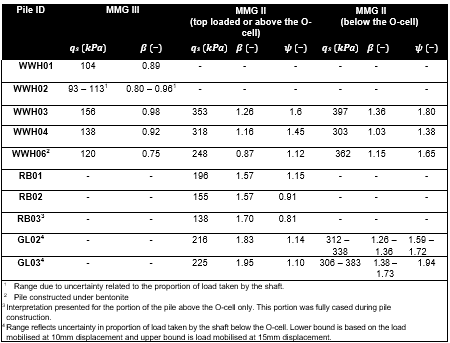
Nearly 50 years ago, Chandler and Davis (1973)[3] noted that use of the effective stress method for determining shaft friction in Mercia Mudstone was most appropriate, but further testing was required to derive suitable parameters for design. CIRIA 570[4] presents several values of 𝛽 in Mercia Mudstone that have been used in design across the UK but there is still limited guidance on how to use the method more widely. Table 1 presents a summary of average ultimate shaft resistance, in-situ 𝐾0
and 𝛽 values reported in literature for test piles in Mercia Mudstone constructed using similar techniques as the HS2 tests.
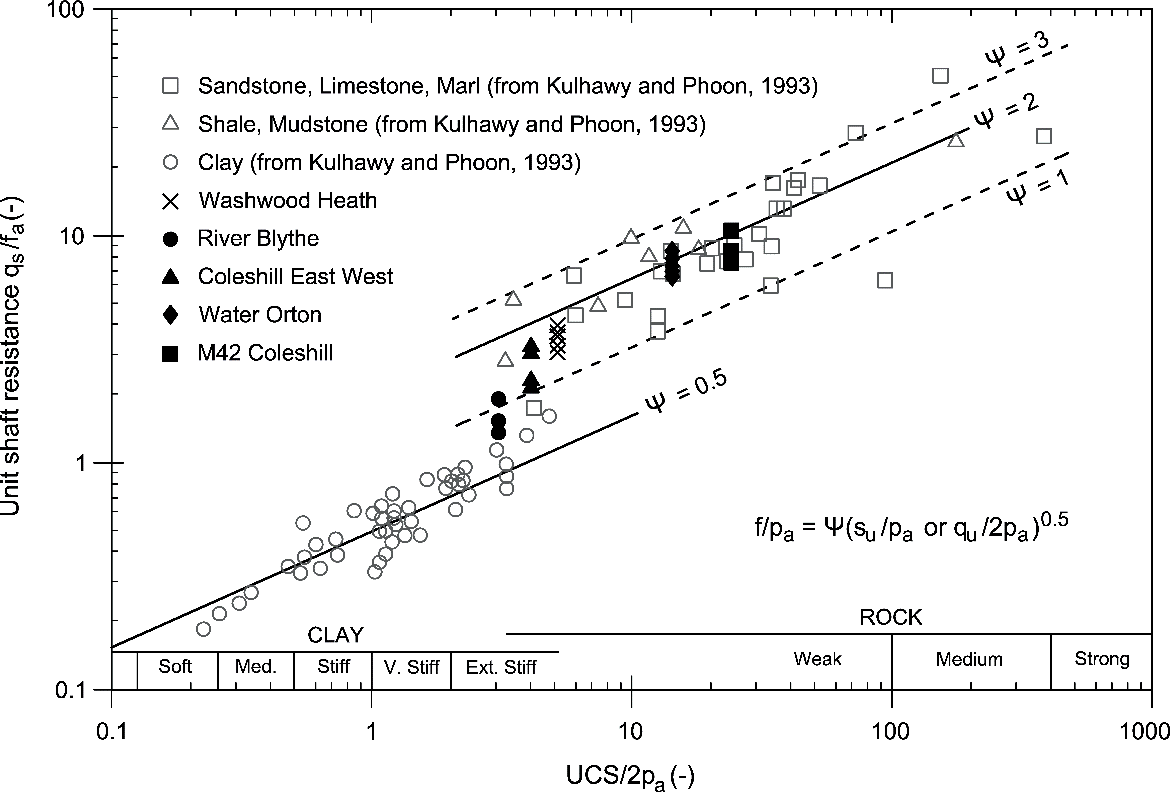
Alternatively, shaft resistance in rock can be calculated from UCS (𝜎𝑐). Several empirical correlations have been proposed (CIRIA R181[5]), the majority of which can be simplified into the following form where 𝜎𝑐 is in MPa and 𝜓 is a dimensionless coefficient, typically equal to 1 but ranging between 0.9 and 2 (Equation 2).
𝑞𝑠(𝑘𝑃𝑎) = 220𝜓√𝜎𝑐 (2)
Kulwahy and Phoon[6] proposed a value of 𝜓 = 0.5 for clays and a lower bound value of 𝜓 = 1 for weak rocks based on load test data in shale, mudstones, sandstone, limestone and marl. Values up to 𝜓 = 3 were recorded as an upper bound for rough sockets. The values of 𝜓 for shale and mudstone tend to fall between 1.5 and 2.5.
Summary of test piles
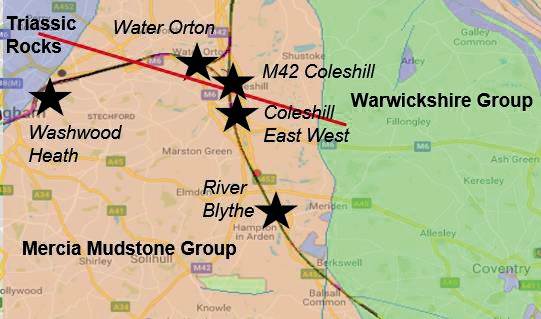
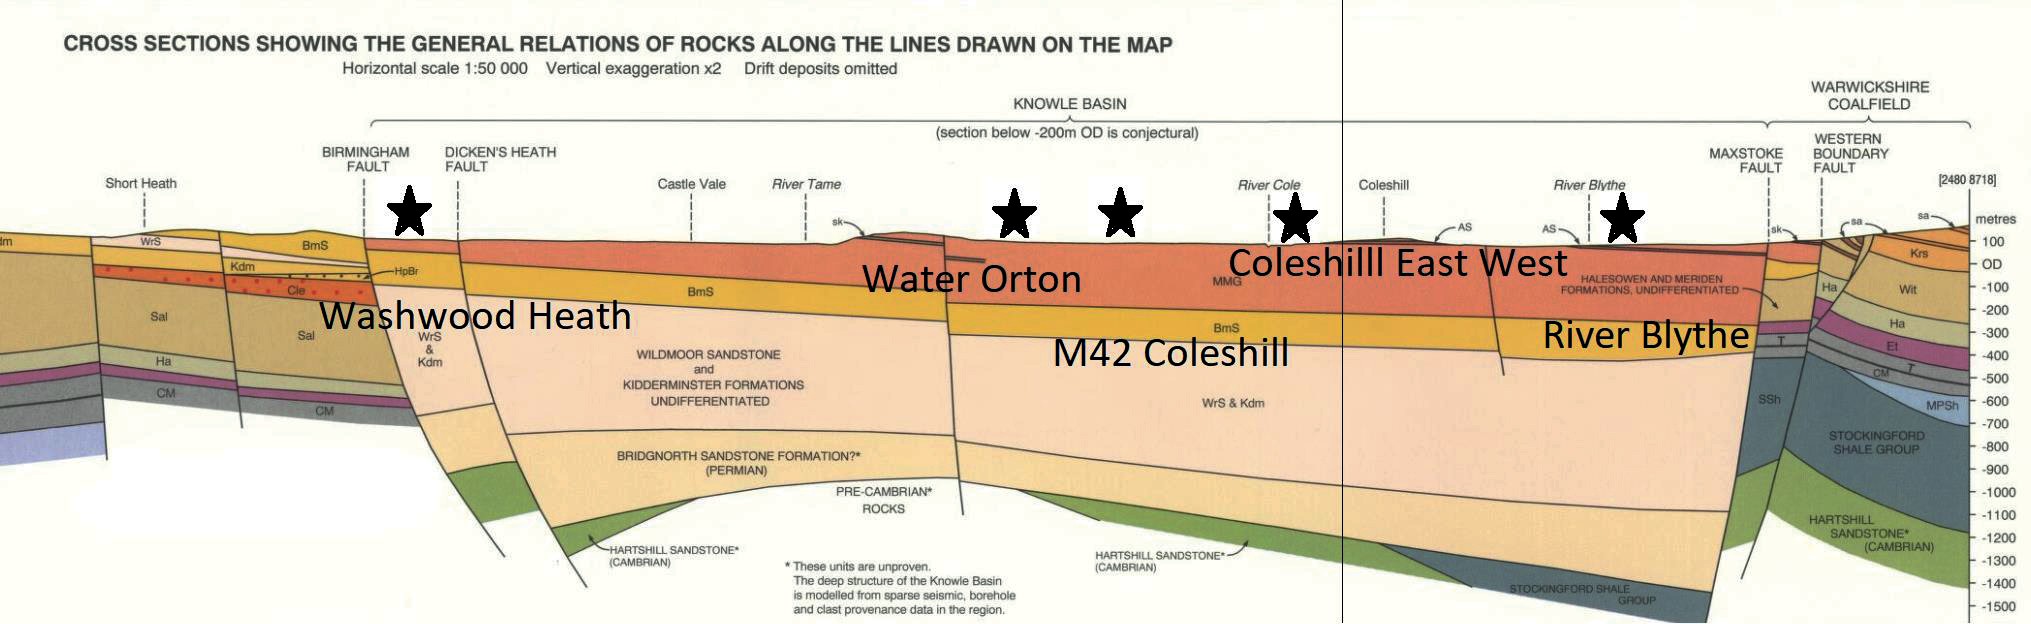
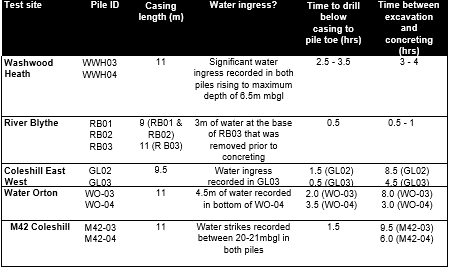
Figure 2 shows the approximate location of all five pile test sites along the HS2 route and Table 2 provides a summary of the tests carried out at each location.
The Mercia Mudstone at the five sites varied between stiff clay and extremely weak to weak mudstone, corresponding to weathering Grades IV, III and II as defined in accordance with the simplified weathering scheme in CIRIA 570[4].
This paper will focus on the tests at Washwood Heath, River Blythe and Coleshill East West, where the Mercia Mudstone was encountered near surface and the Grade II mudstone is extremely weak to very weak. In comparison, at Water Orton and M42 Coleshill the Grade II mudstone is described as very weak to weak and was overlain by >15 m glacial deposits.
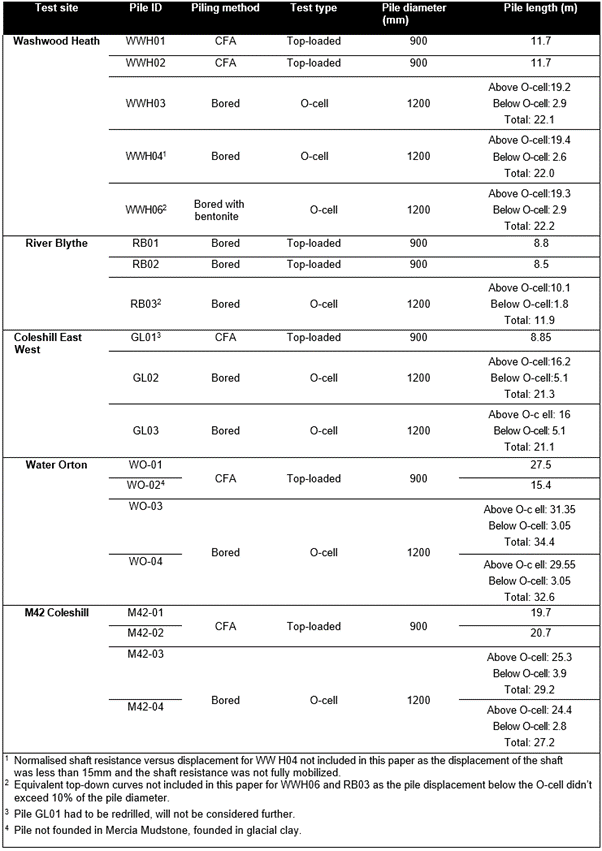
The test piles were constructed either using a BG30 rig with thin wall casing or a B200XP-2 continuous flight auger (CFA) rig. Apart from one pile bored under bentonite (WWH06), all the bored piles were initially drilled dry. Table 3 provides further details on the dry bored pile construction.
A combination of thermal integrity testing (TIP) and cross hole sonic logging (CSL) was carried out to check pile integrity apart from WWH06 where a sonic caliper was used. Both the TIP and CSL testing picked up a potential anomaly at the pile toe in WWH04, otherwise the testing in all other piles indicated no anomalies.
The piles were either tested bi-directionally by means of a single O-cell or were top loaded. Maintained compression load tests were carried out on all test piles in accordance with the ICE Specification for Piling and Embedded Retaining Walls (3rd Edition)[14].
Multiple levels of strain gauges and rod extensometers were installed in all test piles apart from the two top loaded tests at River Blythe where the rod extensometers were omitted.
Geological setting, ground models and geotechnical parameters
Geological setting
All five sites are situated within the Knowle Basin (Figure 3) – a fault bounded basin that developed as part of regional crustal extension and rifting during the late Permian prior to deposition during the Triassic[15].
The basin is infilled by the Mercia Mudstone Group which was deposited through the settling out of clay and silt sized particles in temporary lakes, as sheets of silts/sands from flash floods and as wind-blown dust sticking to mud-flats[4]. These climatic conditions were mainly unchanged throughout the Triassic apart from a sudden change during the late Triassic during which the conditions were much wetter with braided rivers and delta systems leading to the deposition of up to 10m of Arden Sandstone. Drier conditions returned for the remainder of the Triassic period before rising sea levels leading to marine transgression and deposition of the Penarth Group.[4]
Pleistocene deposits cover much of the Knowle Basin and are a result of at least two periods of glaciation and recession. The glaciation from the older period (Anglian) extends south of the Knowle Basin and resulted in widespread glacial cover during the middle Pleistocene that resulted in clay rich tills derived of Mercia Mudstone being deposited. A less cold period followed, leading to retreating ice releasing large volumes of water into high energy rivers and onto flood plains. A later cold phase (Devensian) resulted in glaciers extending to approximately the latitude of Birmingham. For the test pile sites, the Devensian deposits are likely to consist of periglacial soils of reworked sands and gravels deposited during the subsequent water release in warmer climate periods.
Holocene deposits are found along the current drainage network, which feed into the Rivers Tame, Rea, Cole and Blythe. River Terrace Deposits and Alluvium can be found in the flood plains along the valley corridors. However, Anthropocene activity has removed much of the soft clay and silt soils and left a surface layer of engineering fill and uncompacted rubble across industrialised locations, which is most notable at Washwood Heath.
Ground models
Figure 4 presents a generalised ground model and groundwater table for each of the test sites alongside the approximate pile lengths.
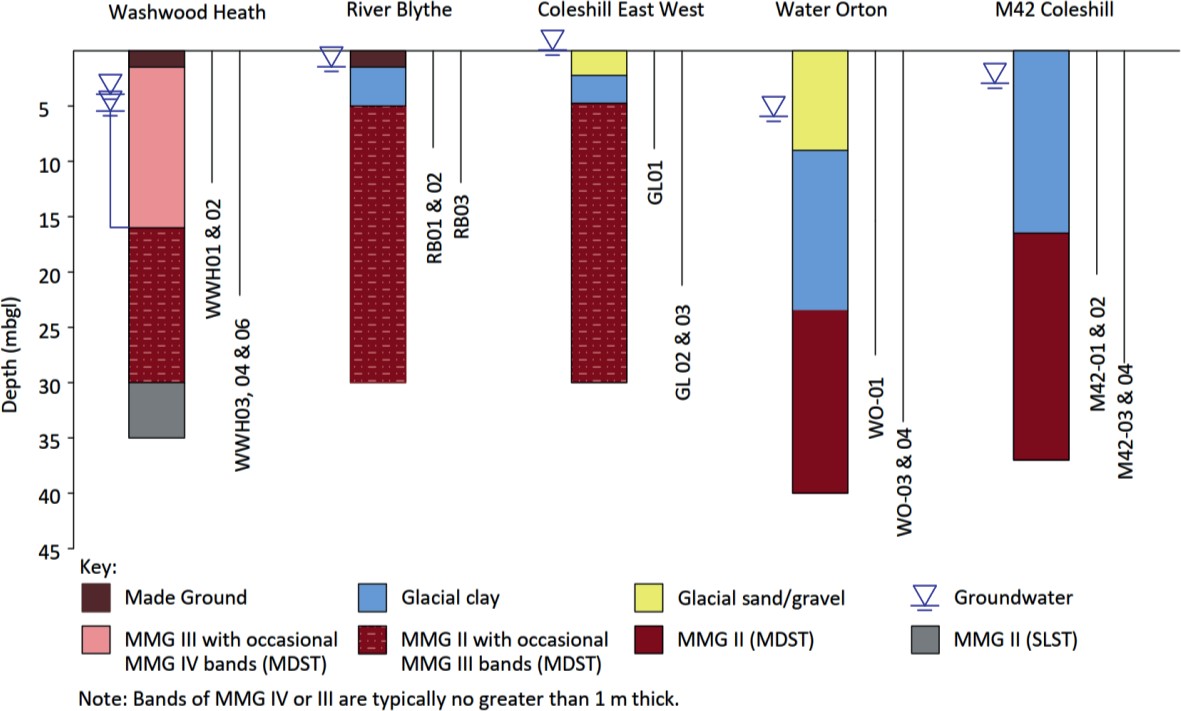
The Washwood Heath site sits at the western edge of the basin in between the Birmingham fault to the west (approx. 500m) and the Dickens Heath fault to the east (approx. 2.8km).[13] Being so close to the basin boundary, the Mercia Mudstone is found to be relatively thin and comprises the lower two units (Sidmouth Formation overlying Tarporley Sandstone).
The Sidmouth Formation here is deeply weathered and borehole logs suggest a sequence of more than 15m of alternating extremely weak weathered rock and firm to stiff clay with gravel sized lithorelicts – a common pattern of alternating Grade II/III and Grade IV Mercia Mudstone.
There are limited glacial deposits, however there is evidence of intense past activity nearby in the form of a 30m deep gravel infilled glacial channel that incises to below the base of the Mercia Mudstone Group. The path of the channel roughly aligns with the Birmingham Fault with the paleo channel likely draining eastwards towards the Proto-Soar/Bytham river valley which drained further eastwards to The Wash[16].
The River Blythe site is on the eastern extremity of the Knowle Basin which is bounded by the Western Boundary Fault. Branscombe Formation is encountered and is similar to Sidmouth Formation in composition. BGS mapping suggests several faults in the area trending SW – NE and a perpendicular set SE – NW. It is likely that additional faults will be present along the paths of streams and tributaries to the River Blythe.
No glacial soils remain present at the site, however extensive deep glacial fluvial deposits are located to the east of River Blythe. On site, there is up to 3m of alluvial deposits associated with Shadow Brook (a tributary of the river at the north of the site) and some Engineered Fill.
Coleshill East West, M42 Coleshill and Water Orton sites – these three sites sit roughly in the centre of the basin and are entirely made up of mud rocks of the Sidmouth Formation. They are all in the topographical low area near to the confluence of the Rivers Cole, Tame and Blythe.
At Water Orton and M42 Coleshill there are very thick (>12m) glacial soils present, which are described as very stiff clay based Tills derived from Mercia Mudstone rocks, which are overlain by fine sands and silts. At M42 Colehill the silts and sands are only 3m thick whereas at Water Orton, they are 5m thick and are further overlain by 4m of recent River Deposits of sands and gravels.
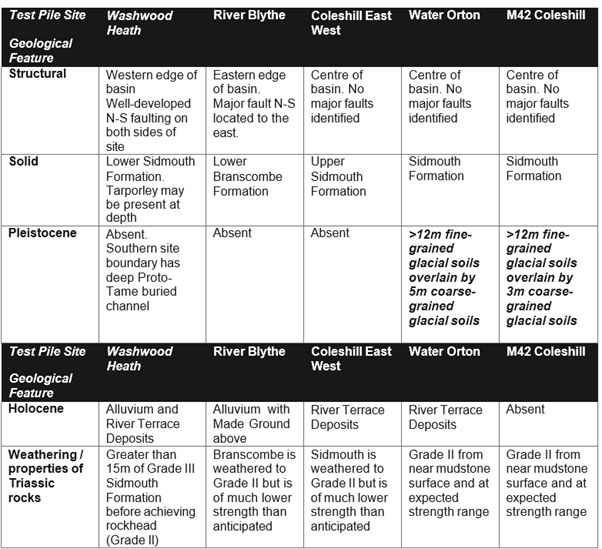
Variation in geological setting
The three sites selected for analysis (Washwood Heath, River Blythe and Coleshill East West) are influenced to varying degrees by different geological processes, summarised in Table 4. Washwood Heath has been stripped of all traces of glaciation – probably due to Holocene erosion along the path of the River Tame. Despite this, the nearby deep channel gives an indication of the high energy fluvial system that was likely to impact much of the region. With all the glacial soils removed, it is likely that upper units of the Mercia Mudstone were also eroded prior to deposition of superficial alluvial soils and that the weathering from glaciation still applies. Similarly, Coleshill East West and River Blythe have no remaining glacial soils present.
This is in stark contrast to Water Orton and M42 Coleshill, which have deep deposits of stiff Triassic sourced glacial clays with additional cover of coarse-grained soils. These two sites with deep glacial cover are also the locations where rock quality is much improved, and weathering is far less pervasive.
Geotechnical parameters
Table 5 summarises the bulk unit weights and values of UCS in the Mercia Mudstone used to back analyse the pile load tests.
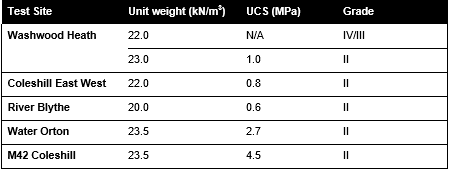
The direct UCS tests and the UCS values from correlation with point load testing (PLT) are plotted in Figure 5 for Washwood Heath, River Blythe and Coleshill East West over the depths where the piles are socketed into the rock. The material at these three sites is described as extremely weak and would be expected to have a UCS between 0.6 and 1MPa.
Only two UCS tests were carried out between the top of rock and the pile toe levels at Washwood Heath and no samples suitable for UCS testing were available at either River Blythe or Coleshill East West.
At River Blythe, due to the spacing of bedding discontinuities (often <60mm) and the low strength, drilling tended to result in significant drilling induced disturbance in the recovered core which made logging and sampling very difficult. Whilst other sites also experienced difficult drilling, the recovery here was especially challenging.
Due to short fracture spacing and variability of the material it also proved difficult to get appropriate samples to test, as intact samples of 2.5 times the length to width are required. This leads to inherent sampling bias in the UCS testing, as the more competent bands tend to provide the most suitable samples, as is seen at Washwood Heath. In 6 of 14 UCS tests across the three reported sites, testing was undertaken on samples with dimension ratios of less than 2.5 as the alternative would have been a lack of any UCS test results.
A correlation factor 𝐼𝑠,50 = 10 was derived at Washwood Heath to convert point load test to UCS which is in line with guidance from Wilson (1976) who suggests a correction of around 8 for weak mudstones and Bowden et al. (1998) who suggest correction factors of <10 for materials of UCS strength < 5MPa.[17][18]
A correlation factor of 10 has also been applied at the other two sites. However, it appears too low for Coleshill East West as it indicates a UCS less than 0.6MPa, contrary to the material descriptions. 54 PLT’s were carried out at this site but only 18 were conducted within the calibration limits of the apparatus. Whilst this is not directly an indicator that the correlation is unreliable, it adds uncertainty to the assessment.
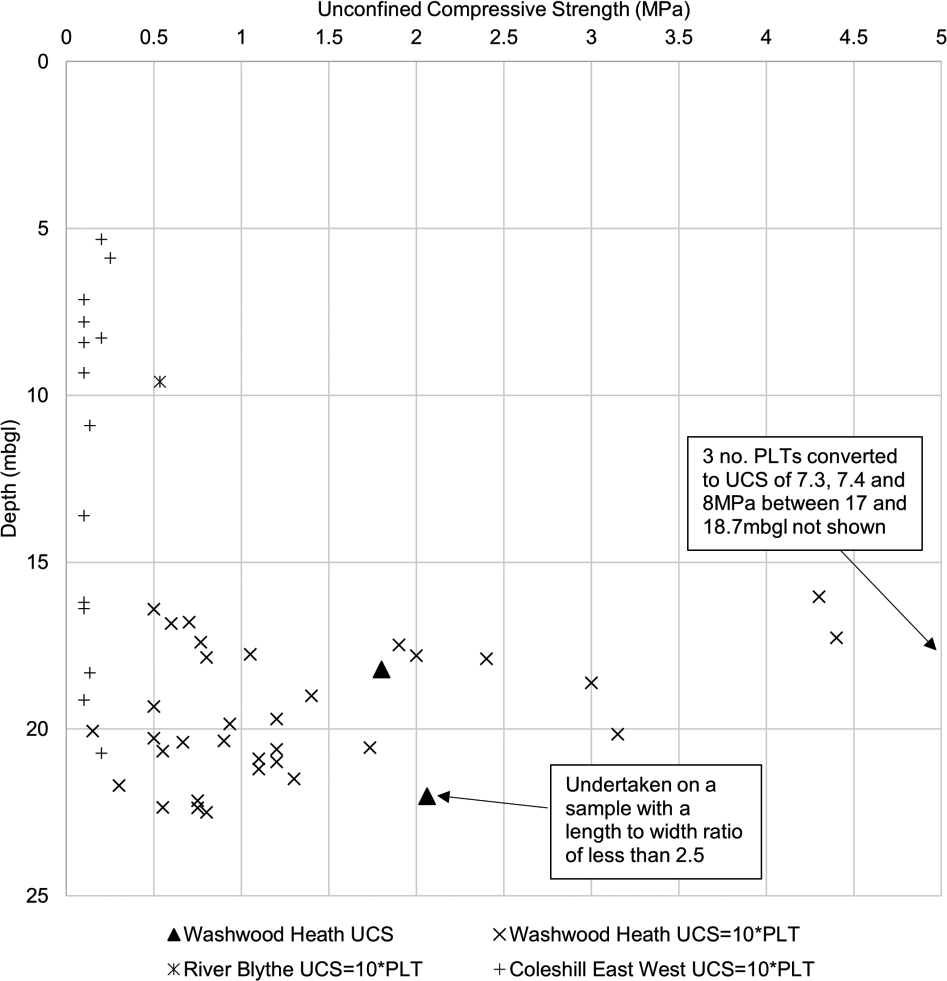
In addition to the sampling difficulties, the derivation of UCS can be significantly influenced by the test method. These combined effects result in highly variable test data with a large coefficient of variation. For example, the coefficient of variation (standard deviation/mean) is 1.06 for the Washwood Heath data shown in Figure 4, which compares with published COV values for 𝑠𝑢 between 0.2 and 0.4 (noting that for London Clay COV is typically less than 0.2)[19]. A COV of close to 1 means the data is not suitable for engineering design.
Similar issues occur when deriving undrained shear strength. At Washwood Heath an undrained shear strength profile in the MMG IV/III was derived from consolidated undrained triaxial tests, SPTs, CPTs, cross-hole seismic and HPD testing. However, depending on the testing considered, the 𝑠𝑢 profile varied significantly, see Figure 6. For this reason, a total stress approach is not proposed in this paper as the 𝑠𝑢 profile tends to rely heavily on empirical correlations with ground investigation tests compounded with an 𝛼 value which has also been empirically determined from case histories where different types of tests have been used to derive 𝑠𝑢. The authors recommend the methods listed in this paper should be considered in lieu of a conventional total stress approach in these intermediate geomaterials.
Pile Test Load displacement behaviour
Top loaded tests
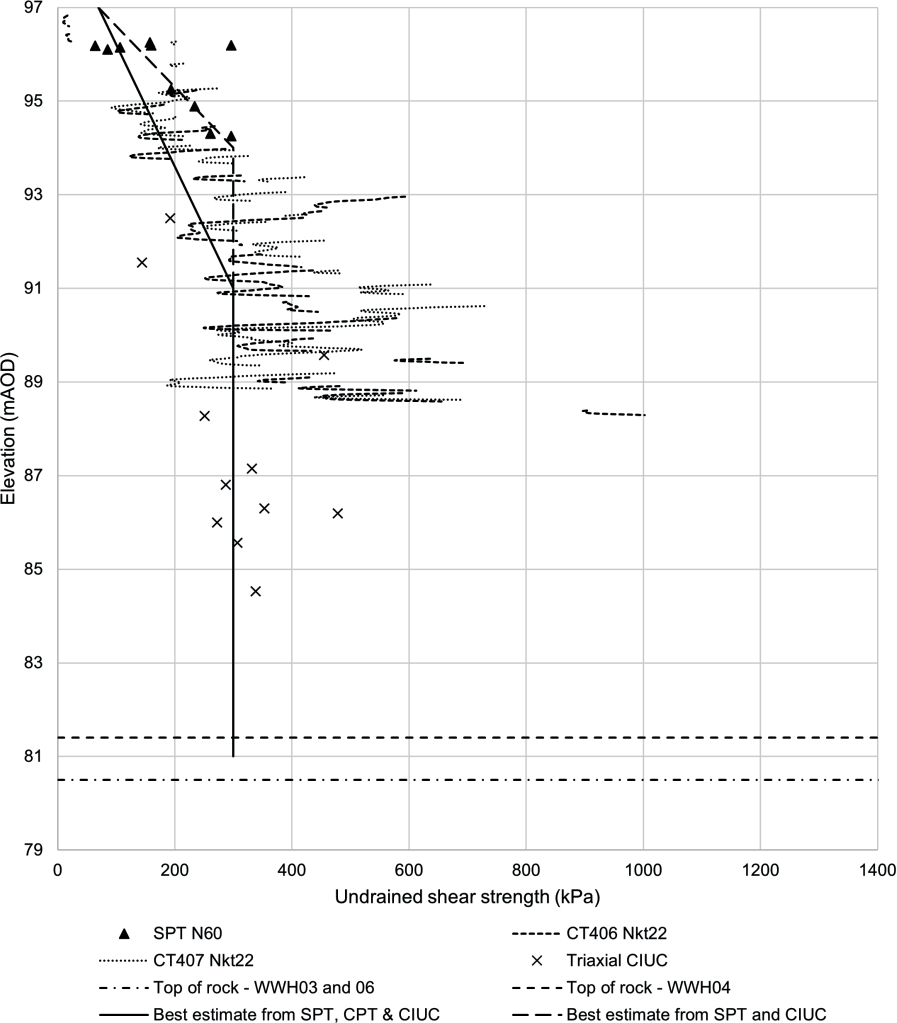
Figure 7 presents the load displacement curves for the top-loaded tests. Both WWH01, WWH02 and RB01 exhibit similar behaviour up to approximately 15mm displacement at which point the shaft friction is practically fully mobilised (as discussed later).
RB01 exhibits a stiffer response than RB02 and 33% higher ultimate capacity at 90mm displacement (10% of pile diameter). The difference in capacity is thought to be due to local variability in the weathering and rock quality as 60% of the Mercia Mudstone material in the top 20m of the borehole nearest to RB02 was not recovered in comparison to between 0 and 15% elsewhere.
Bi-directional tests
Figure 8 shows the load-displacement curves for all bi-directional test piles. WWH04 was unable to be tested to failure above the O-cell as the O-cell expansion limit was reached due to significant movement at the base, however, the failure load is likely to be similar to that for WWH03. WWH06 fails at a lower load due to the bentonite reducing the roughness of the shaft interface leading to lower shaft friction. There are significant differences in the base response of the three piles due to differences in construction methodology, water ingress, the variability in the founding material and anomalies picked up from the integrity testing at the pile base in WWH04. Further discussion about pile base resistance is outside the scope of this paper.
RB03 failed in shaft friction above the O-cell before mobilising significant base resistance whereas GL02 and GL03 have not. However, the piles are starting to exhibit non-linear behaviour and as pile displacement exceeds 10-15 mm displacement, the majority (circa 80% to 90%) of the shaft resistance is expected to have been mobilised.
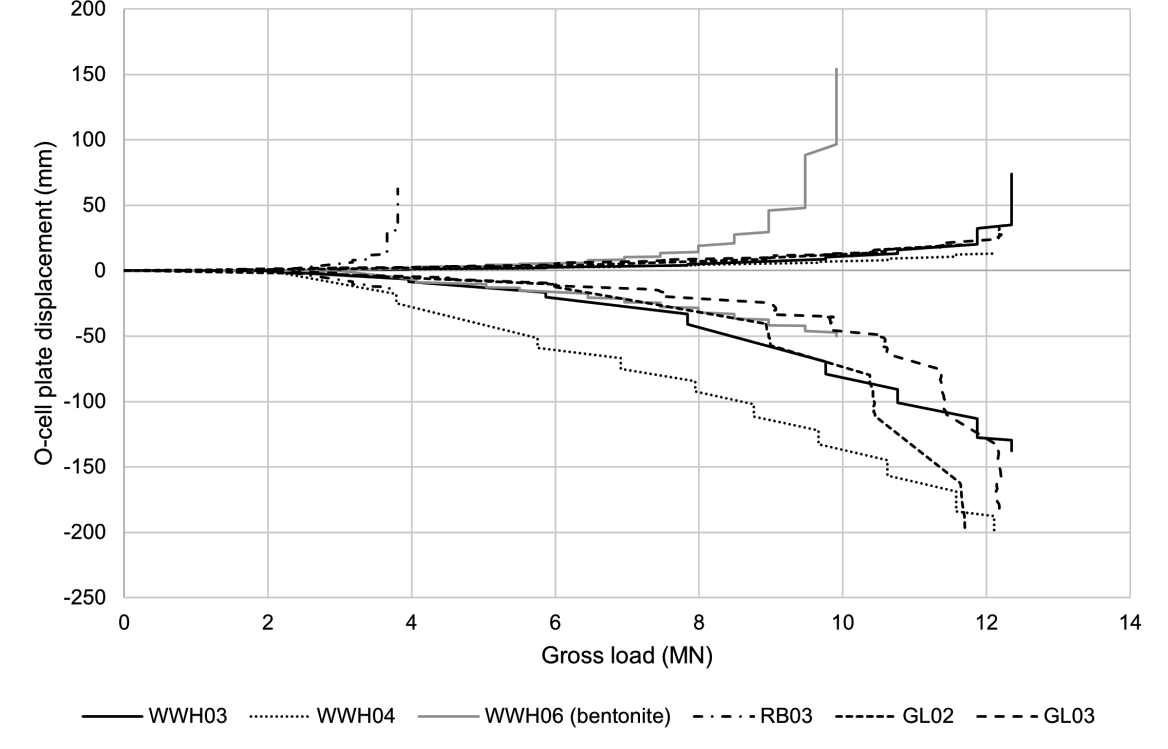
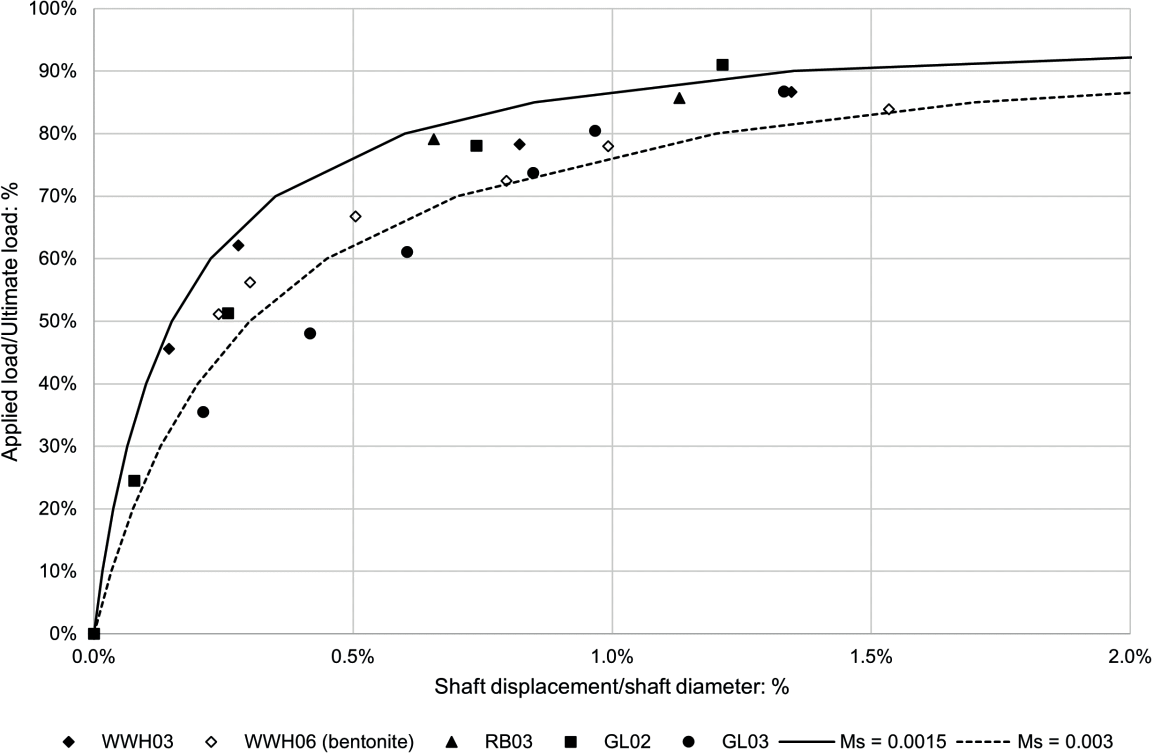
Figure 9 shows the normalised shaft resistance versus normalised displacement; the resistance is extrapolated to infinite time for the portion of the bi-directional tests above the O-cell using the method outlined in England (2005)[20]. The shaft displacement has been adjusted to remove the elastic shortening component in accordance with Fleming (1992)[19].
The test data has been compared to curves of 𝑀𝑠, where 𝑀𝑠 is the shaft flexibility factor as defined by Fleming[21]. 𝑀𝑠 is typically 0.001 for back analysed top-loaded pile tests (England, 1999)[22] however higher values have been observed for bi-directional tests[20]. This agrees with what is shown here, where 𝑀𝑠 typically falls between 0.0015 and 0.003.
At displacements exceeding 1 to 1.5% of the shaft diameter (i.e. a displacement of 12- 18mm) between 80 and 90% of the shaft resistance is mobilised. It is interesting to note that there is no obvious difference in shaft stiffness behaviour between WWH06 constructed under bentonite and the other piles.
Comparison of top-loaded and bi-directional tests
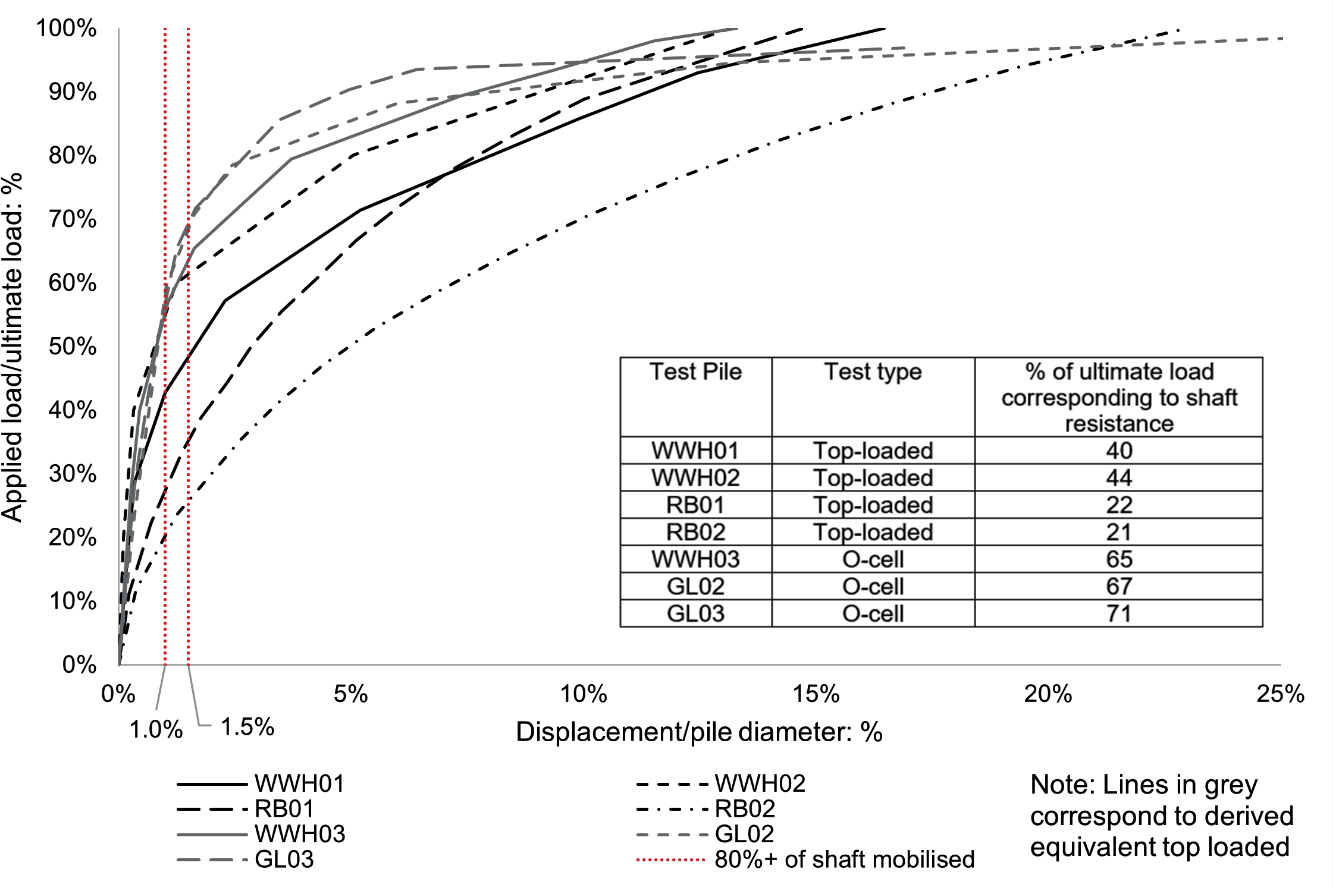
Figure 10 plots the normalised load-displacement curves at infinite time for both the top- loaded and bi-directional test piles. The bi-directional curves have been converted to equivalent top-down curves using the method in Fellenius[23], indicated by grey lines on the figure. Displacements of 1-1.5% of the pile diameter have been indicated on the plot by which point more than 80% of the shaft resistance would have been mobilised (as shown in Figure 9).
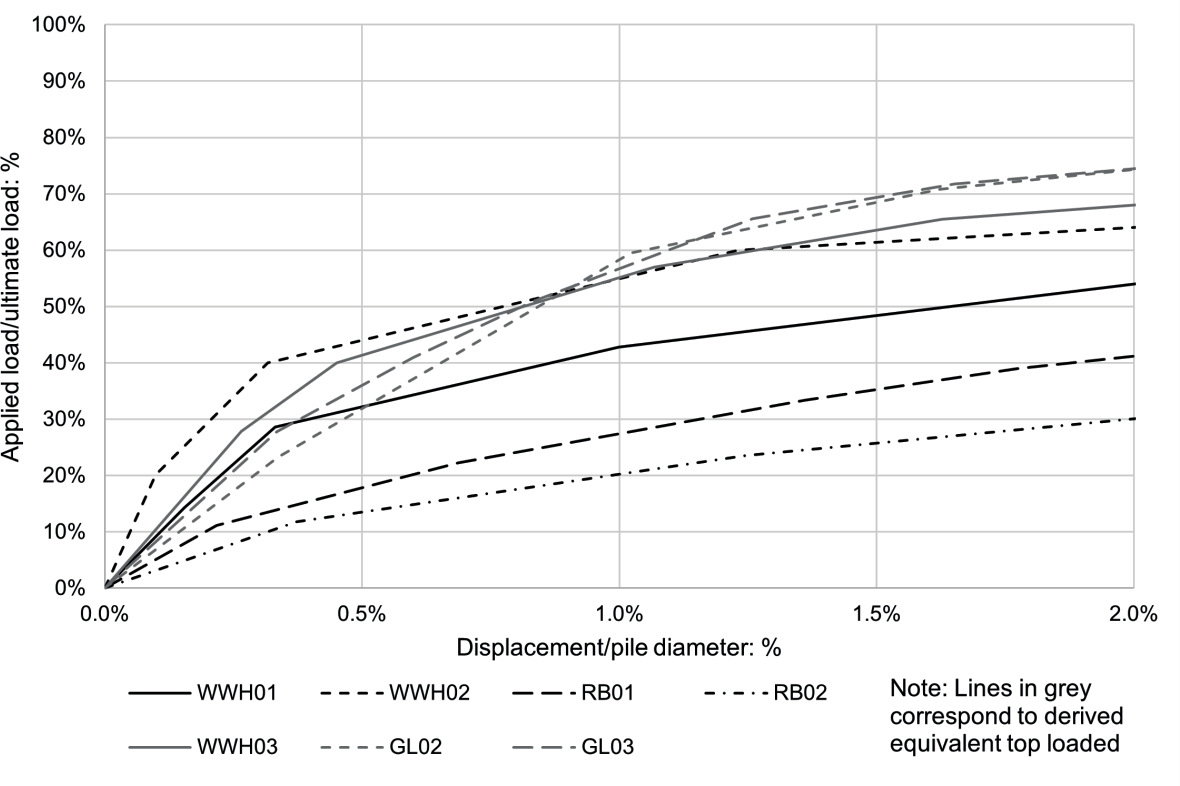
Figure 11 zooms in on the behaviour at small, normalised displacement (<2%), which is important for SLS checks. The initial secant stiffness at 0.5% normalised displacement is very similar at Washwood Heath and Coleshill East West, however at River Blythe the piles show a softer response. This is because the proportion of the ultimate load mobilised by shaft resistance is significantly lower (approximately 20% at River Blythe compared to 40- 45% for the other top-loaded tests and 65-70% for the O-cell tests).
Back analysis
Load distribution along the piles was derived from both the strain gauges and telltale data. This required knowledge of the pile’s stiffness (𝐸𝑐𝐴𝑠). The pile concrete secant stiffness was estimated from the strain gauges located immediately either side of the O-cell or at the top of the top loaded piles using the method outlined in Fellinius (2020)[23] which removes the requirement to accurately know the as-built cross-sectional area. This was cross-checked against 𝐸𝑐𝐴𝑠 estimated from the Young’s Modulus derived from concrete cube tests, multiplied by the theoretical pile cross-sectional area.
Ultimate shaft friction was then calculated from the load distribution curves at the final load step. At River Blythe, where the strain gauge data was unreliable and no telltales were installed, ultimate shaft resistance was estimated by assuming that the total resistance mobilised at 15mm displacement less the mobilised base resistance corresponded to 8090% of the ultimate shaft resistance.
The back analysis of the shaft resistance has been split by Grade of Mercia Mudstone as well as into the portion of the piles above and below the O-cell for the bi-directional tests. Table 6 summarises average ultimate shaft friction, in each portion as well as the back analysed 𝛽 value and back analysed 𝜓 for each test pile.
Effective stress approach
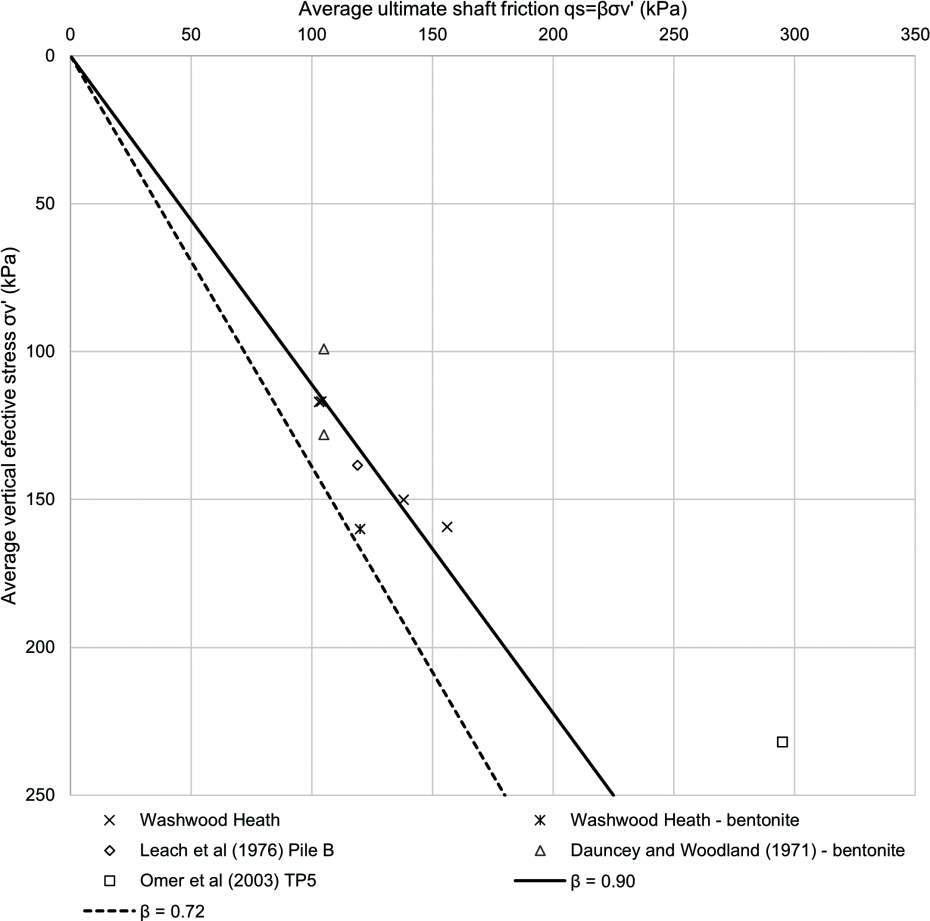
Significant thicknesses of Mercia Mudstone Grade IV/III were only encountered at the Washwood Heath test site. 𝛽 broadly falls within the range of 0.9 – 1.0 and there is no noticeable difference between the bored and CFA piles. Figure 12 presents the average ultimate shaft friction mobilised against average effective stress along the portion of the shaft in MMG IV/III. Published data from pile tests in MMG III and lines with an equivalent 𝛽 = 0.9 and 0.72 (80% of 0.9) are shown for reference.
𝛽 is a function of the horizontal stress in the ground allowing for pile installation. In granular materials Tomlinson[24] proposes an installation factor of 0.7 – 1 for bored and cast in place piles to convert from 𝐾0 to 𝐾𝑠. A similar approach could be considered to estimate 𝛽 from 𝐾0 in the MMG IV/III. Typical values of 𝐾0 between 1.5 and 2.0 have been reported in literature for the Mercia Mudstone at shallow depths[4]. At Washwood Heath the derived 𝐾0 from a pre-bored pressuremeter ranges from 1 to 2 in the MMG IV/III. Taking 𝐾0 = 1.5, the installation factor would be 0.6 for CFA piles or piles bored without support fluid.
A similar plot of average shaft friction vs average effective stress is shown in Figure 13 for the portion of the piles in the MMG II for the three test sites where the mudstone is extremely weak. Values of 𝛽 in the MMG II are higher than in the MMG IV/III and are typically greater than 1.15. In WWH06, which was bored under bentonite, the back analysed values of 𝛽 and 𝜓 are approximately 80% of those bored dry. Published data from pile tests in MMG II and lines with an equivalent 𝛽 = 1.6, 𝛽 = 1.15 and 𝛽 = 0.92 (80% of 1.15) are shown for reference.
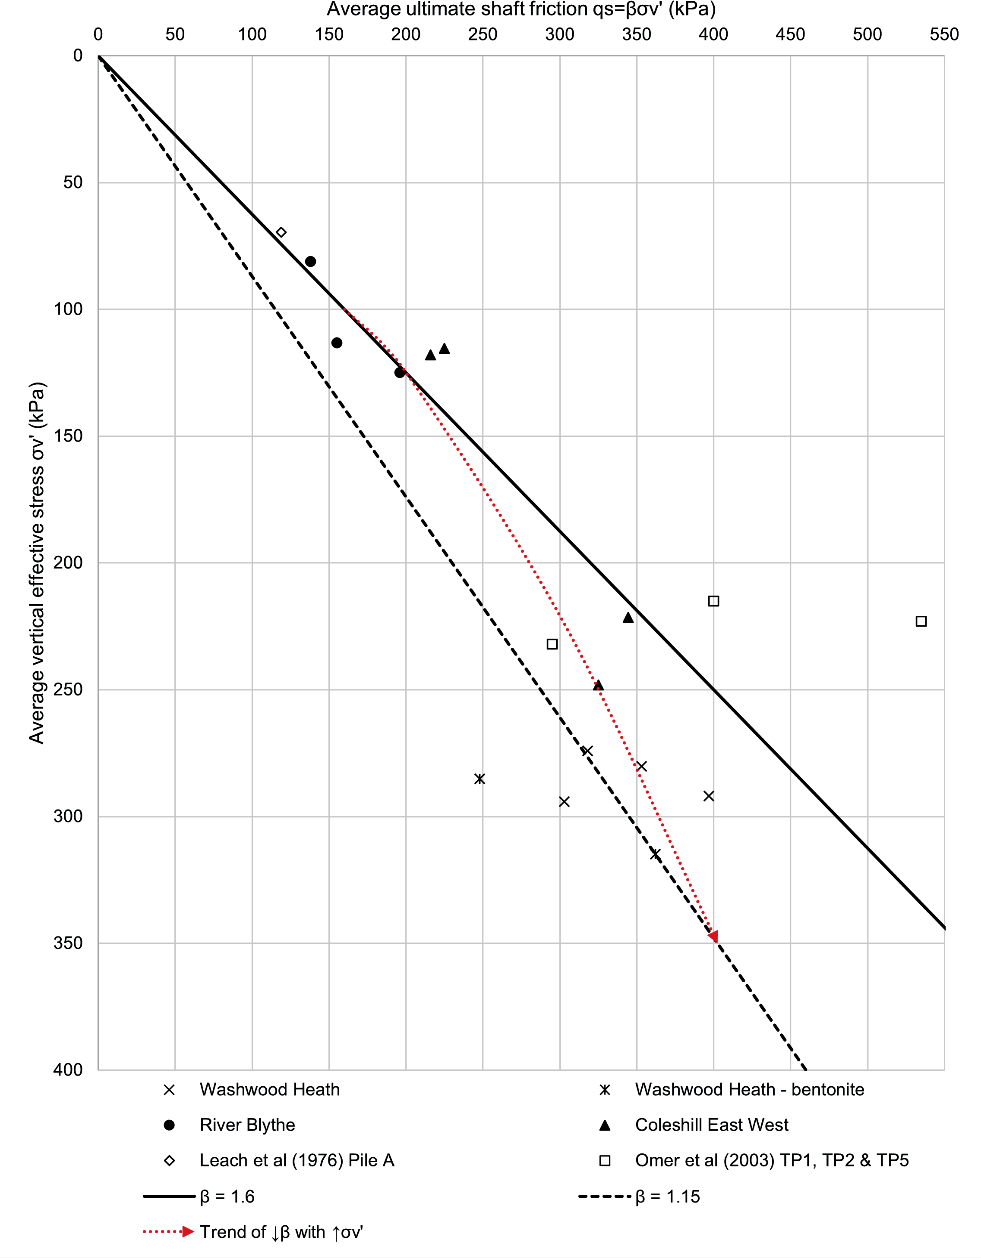
The back analysed values of 𝛽 are greater at River Blythe and Coleshill East West than Washwood Heath (1.6 vs 1.15) and there is an overall trend of decreasing 𝛽 with increasing effective stress as illustrated by the dashed red line. The reason for this reduction could be due to a combination of two inter-related factors: firstly, reduced dilation at greater confining stress (at greater depth), which is an ubiquitous pile shaft behaviour phenomenon observed in a range of geologies (e.g. Mandolini, 2019)[25]; secondly, intrinsically lower lateral stiffness (which would reduce the dilation component of shaft friction) of the grade II material at Washwood Heath, reflected in lower pressuremeter limit pressures, as noted below.
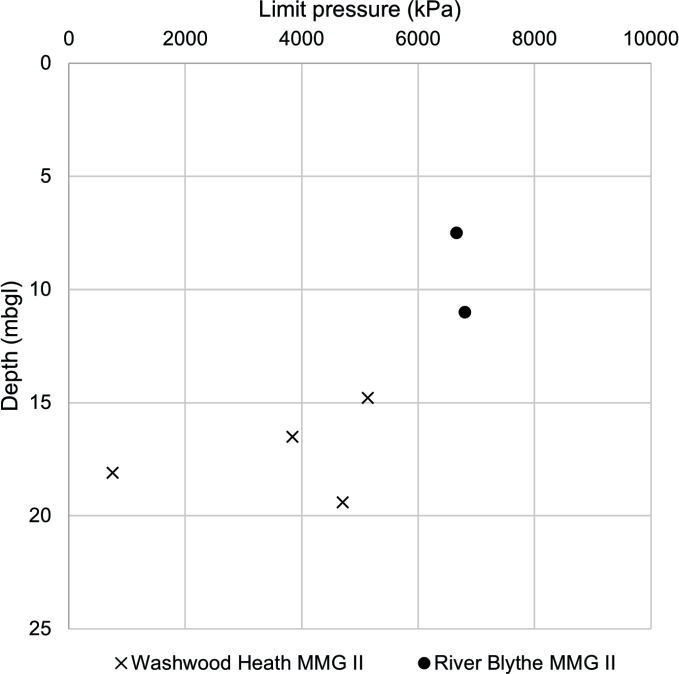
Pressuremeter tests were carried out at Washwood Heath and River Blythe and Figure 14 compares the limit pressures at both locations. Limit pressures have been used to compare the two sites as opposed to 𝐾0 as pre-bored pressuremeter tests don’t measure in-situ horizontal stress directly and the assumptions that are required to derive 𝐾0 from the test results are not considered appropriate for weak rocks such as the Mercia Mudstone. In addition, limit pressures are less impacted by installation disturbance.
The ratio of the limit pressures in the MMG II is approximately 1.5, which is similar to the ratio between the values of 𝛽. The lower values of limit pressure at Washwood Heath are thought to be due to horizontal stress relaxation from localised faulting and the nearby glacial channel.
UCS approach
Figure 15 presents the pile test data plotted with the Kulhawy and Phoon database. The test results complement the existing database as there is very limited data for extremely weak rocks. There is a trend of increasing shaft resistance and 𝜓 with increasing UCS. It is important to note the rapid change in 𝜓, from about 0.75 to 2 across a small change in UCS (from 0.6 to 1 MPa). This effect, together with the intrinsically low reliability of any UCS measurement in Mercia Mudstone, means that the UCS approach for determining shaft resistance will, inevitably, have a very low reliability.
At River Blythe, values of 𝜓 below 1 have been back analysed, below the lower bound suggested for weak rocks (Kulhawy and Phoon 1993). If a 𝜓 = 1 was used in design, there is a risk that the shaft friction would be overestimated.
As discussed earlier, significant difficulties were encountered when sampling and testing the extremely weak Mercia Mudstone resulting in little confidence in deriving an appropriate UCS for design purposes. Therefore, it is suggested that 𝜓 is determined based on a correlation with the characteristic Geological Strength Index (GSI) of the material.
Geological Strength Index assesses rock quality in a holistic manner and is mainly governed by Rock Quality Designation (RQD), discontinuity spacing and discontinuity condition, reducing the reliance on UCS when determining 𝜓. GSI values at each site have been determined by using an assessment of Rock Mass Rating (RMR, after Bieniawski 1989) from the borehole logs, core photographs and discontinuity logs[26]. Figure 16 presents the derived GSI profile with depth at each test site for the portion of the pile in Mercia Mudstone. It’s noted that the coefficient of variation is approximately 20% of that for UCS at Washwood Heath.
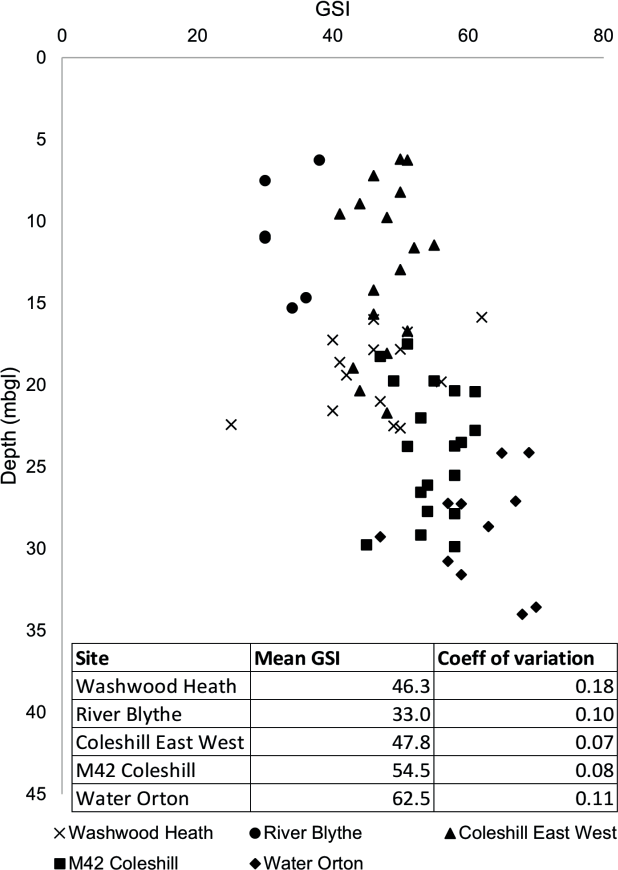
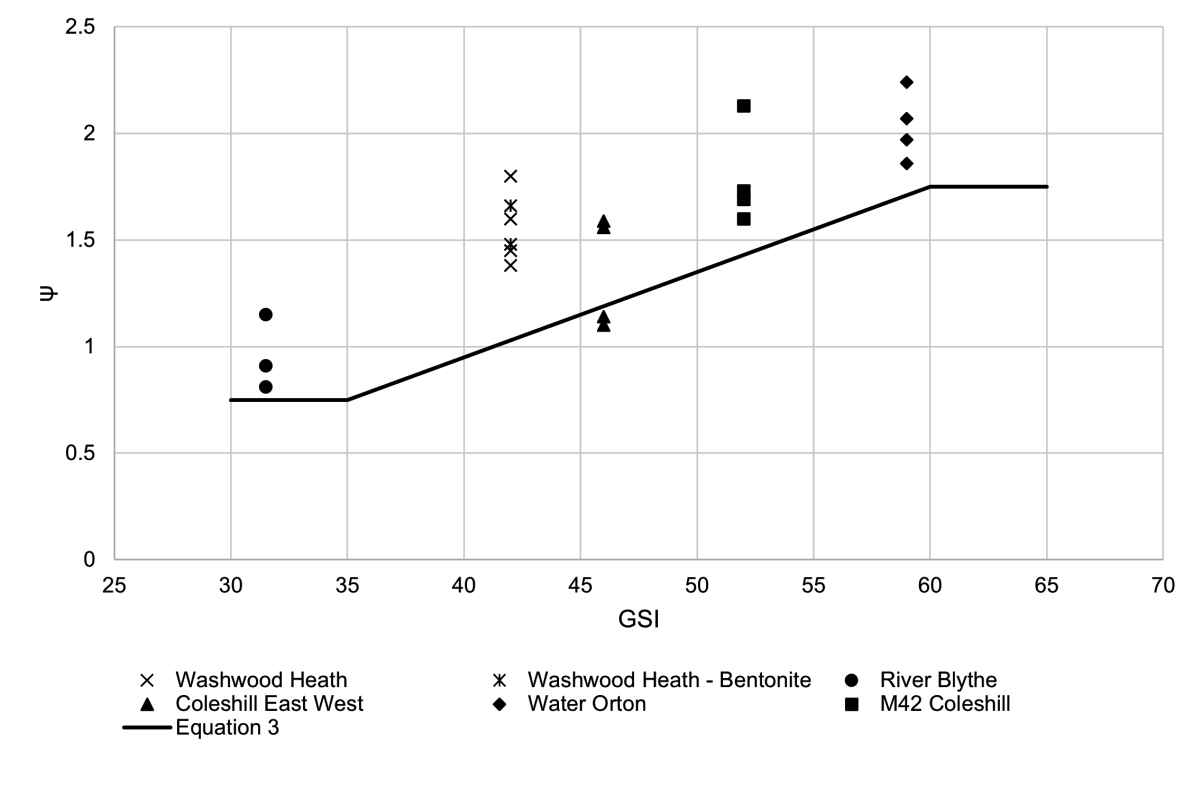
Figure 17 plots the mean GSI minus half a standard deviation at each site against the back analysed 𝜓. There is no noticeable difference between the dry piles and the one bored under bentonite. The following lower bound relationship between GSI and 𝜓 is proposed for use in extremely weak to weak Mercia Mudstone:
𝐺𝑆𝐼 < 35; 𝜓 = 0.75
35 < 𝐺𝑆𝐼 < 60; 𝜓 = 0.75 + 0.04(𝐺𝑆𝐼 − 35)
𝐺𝑆𝐼 > 60; 𝜓 = 1.75
(3)
Wider application
The methods for calculating shaft resistance above have been used on HS2 Phase One Area North with reduced R4 factors in the Mercia Mudstone on the shaft where appropriate (when 1% percent of production piles are tested). A reduction in model factor from 1.4 to 1.2 has also been used on the basis of carrying out preliminary pile tests.
It is considered that taken with previously published pile load test case histories these methods have wider applicability for bored and CFA piles in extremely weak to very weak Mercia Mudstone provided the following are taken into account: the wider geological setting and local stress history; impact of rock strength on the interface friction/socket roughness; pile diameter on constrained dilation (Seidel and Haberfield, 1995[2]); and construction techniques e.g. the potential for machining if hard bands are present or underpowered rigs are used and the potential for softening of the pile shaft if the bore is left open for extended periods.
Conclusions
• The largest known pile test programme of bored and CFA piles in extremely weak Mercia Mudstone has been carried out as part of HS2 Phase One Area North.
• Both, an effective stress approach and empirical correlation with UCS and GSI have been proposed, for calculating shaft friction.
• For the effective stress approach – the following values of 𝛽 are suggested for bored piles (without bentonite) and CFA piles where piles are bored and concreted on the same day on the basis of the test piles and published literature data:
o MMG IV/III 𝛽 = 0.9 − 1
o MMG II (extremely weak) 𝛽 = 1.15 − 1.6, reducing with depth, refer to Figure 13
• The following relationship between GSI and 𝜓 is proposed when calculating shaft friction from UCS:
o 𝐺𝑆𝐼 < 35; 𝜓 = 0.75
o 35 < 𝐺𝑆𝐼 < 60; 𝜓 = 0.75 + 0.04(𝐺𝑆𝐼 − 35)
o 𝐺𝑆𝐼 > 60; 𝜓 = 1.75
• An 20% reduction in shaft friction has been observed in the pile bored under bentonite.
• The effective stress approach offers significantly improved reliability, since the COV (less than 20%) associated with this approach is about 5 times lower than the COV (close to 1.0) associated with conventional total stress methods (based on 𝑠𝑢 and UCS), due to the considerable practical difficulties in sampling and testing the Mercia Mudstone.
• The UCS approach using GSI to determine 𝜓 offers some improvement to reliability but is still limited by the accuracy of the derived UCS.
• The mobilisation of shaft friction, taking into account the variability of the Mercia Mudstone, has been shown to be remarkably consistent (in contrast to base resistance) and develops at small shaft displacements (more than 80% at 10-15mm settlement). Hence, designers can be confident that pile behaviour at SLS will be consistent and result in small displacements, provided the shaft resistance is higher than the applied SLS load.
Acknowledgments
The authors would like to thank the wider IPT team (as there are many people from HS2, BBV and SB3 who have contributed) for their collaboration and support to allow the successful completion of the pile testing programme. Special thanks to our colleagues Loth Lay, Christian Gilbert and Wael Sabra from Systra for their input in assessing the pile testing.
References
- BS 5930 (2015) Code of practice for ground investigations. BSI Standards Publication
- Seidel, J.P, and Haberfield, C.M. (1996) The axial capacity of pile sockets in rocks and hard soils. Ground Engineering
- Chandler R.J, and Davis A.G. (1973) Further work on the engineering properties of Keuper Marl (CIRIA Report 47), Construction Industry Research and Information Association
- Chandler, R.J, and Forster, A. (2001) Engineering in Mercia Mudstone (CIRIA Report 570), Construction Industry Research and Information Association
- Gannon J.A et al, (1999) Piled foundations in weak rock (CIRIA Report 181),Construction Industry Research and Information Association
- Kulhawy, F.H, and Phoon, K. (1993) Drilled shaft side resistance in clay soil to rock. Proceedings of the Design and Performance of Deep Foundations: Pile and Piers in Soil and Soft Rock, (GSP38), ASCE, 172-183
- Leach B.A, et al (1976) The ultimate bearing capacity of bored piles in weathered Keuper Marl. Proceedings of the 7th European Conference on Soil mechanics and Foundation Engineering 3, Brighton, 101-108
- Dauncey, P.C, and Woodland, A.R (1984), Bored cast in-situ piled foundations in Keuper Marl for the Birmingham International Arena. Proceedings of the International Conference on Advances in Piling and Ground Treatment for Foundations, Thomas Telford, 139-146
- Delpak, R. et al (2000) Load/settlement prediction for large-diameter bored piles in Mercia mudstone. Proceeding of the Institution of Civil Engineers Geotechnical Engineering 143(4), 201-224
- Omer, J.R, et al (2003) Large-scale pile tests in Mercia mudstone: Data analysis and evaluation of current design methods. Geotechnical and Geological Engineering 21, 167-200
- Foley, G, and Davis, A.G, (1971) Piling in Keuper Marl at Leicester. Civil Engineering and Public Works Review 66, 987-991
- Kilbourn, N.S, et al (1989) The use of the standard penetration test for the design of bored piles in the Keuper Marl of Cardiff. Proceedings of the Conference on Penetration Testing in the UK, Thomas Telford, 87-92.
- British Geological Survey, 1996. Birmingham, England and Wales Sheet 168. Solid and Drift Geology 1:50 000. (Keyworth, Nottingham British Geological Survey).
- ICE Specification for Piling and Embedded Retaining Walls, Third Edition (2016), ICE Publishing
- Gibbard, P.L. Turner, C. and West, R.G. (2013) The Bytham River Reconsidered, Quaternary International, Vol. 292, p15-32
- A.J. Newell, Rifts, rivers and climate recovery: A new model for the Triassic of England, Proc. Geol. Assoc. (2017)
- Wilson, L. (1976) Tests of bored and driven piles in Cretaceous mudstone at Port Elizabeth, South Africa. Géotechnique Vol 26
- Bowden, A.J. Lamont-Black, J. and Ullyott, S. (1998) Point load testing of weak rocks with particular reference to chalk. Quarterly Journal of Engineering Geology and Hydrogeology, 31, 95-103
- Uzielli, Lacasse, Nadim, Phoon (2007) Soil variability analysis for geotechnical practice. Proc of Characterisation and engineering properties of natural soils, vol 3, p1653 – 1752.
- England, M. (2005) A Conservative Method of Analysis of test results for bi- directional static load tests. Loadtest.
- Fleming, W.G.K (1992) A new method of single pile settlement prediction and analysis. Géotechnique Vol 42, 411-425
- England, M. (1999). A pile behaviour model, Thesis (PhD), Imperial College London
- Fellenius, B. H. (2020) Basics of Foundation Design, Electronic Edition, 527
- Tomlinson, M.J. (2004) Pile Design and Construction Practice (4th edition). Spon Press
- Mandolini, A. (2019) Lessons learned from experimental researches on piles. The Bengt Fellenius lecture. Proc of the 2nd International conference on Deep Foundations, TC212 (ISSMGE), Santa Cruz, May 2019.
- Bieniawski, Z.T. (1989) Engineering Rock Mass Classifications. Wiley- Interscience, New York.
Peer review
- Anurag KushwahaHS2 Ltd
- Pete BojczukHS2 Ltd