Simplification and automation of design process for HS2 viaducts drainage elements
Viaducts structures are assets adopted in High Speed Two (HS2) to minimise the impact of the railway on the existing motorways, watercourses, and other low-lying developments. The design of surface water drainage systems on high-speed rail viaducts can be a challenge for drainage engineers due to the limited specific research and available design manuals. Yet, surface water management has been a major factor affecting the long-term performance and maintenance of these assets with impacts on its durability and integrity as well as safety of the operators and end users.
In Area North of HS2 Phase One, the surface water on viaducts is managed through a system of ballast, gullies, channels, suspended pipes and downpipes. This system is then designed for a reasonable number of outfalls depending on the system’s capacity in order to sustain the events up to the 0.1% annual exceedance rainfall event. The flow through the ballast medium is a complex hydraulic phenomenon during the low and high flow events which in turn impacts the fluid dynamics in the gullies, channels, and its outlets.
There is a lack of specific software tools to analyse the overall hydraulic performance of the multiple features used in the viaduct drainage system. This paper will cover a review of the relevant hydraulic behaviours and flow equations applicable to each viaduct drainage element and the hydraulic tool that was developed in Area North using Visual Basic for Applications (VBA) to undertake the hydraulic analysis of the overall viaduct drainage systems. The tool enabled the simplification and automation of the viaduct design process in the Scheme Design Consolidation as well as the standardisation of products which would benefit construction and operational phases.


Notation
is the effective opening of the grating
A0 is the Effective opening of the grating
ABallast is the Cross-sectional area of Ballast Media (m2)
C is the non-dimensional runoff co-efficient which is dependent on the catchment characteristics
C1 is the empirical constant depending on fluid viscosity and mean particle hydraulic radius, considering clean ballast = 15.86 (this value is assumed as representative based on the ballast grading and cleanliness specification confirmed by HS2)
Cd is the Orifice Discharge Coefficient (0.8)
Cr is the dimensionless routing co-efficient = 1 (assumed for the deck drainage) Cv is the volumetric runoff co-efficient = 1 (assumed for the deck drainage)
D is diameter of the downpipe,
E1 is the efficiency of flow interception by gully in-terms of flow width (1 for Check Dam, 0.3 for No Check Dam)
E2 is the efficiency of flow interception by gully in-terms of flow width (0.3)
h1 is the flow depth or head of water (m)
h2 is the flow depth within the check dam (m)
h3 is the required head in the hopper
i is the hydraulic gradient (m/m) assumed as same as deck slope for design purpose K is the coefficient for partial obstruction of grating (0.9)
K is the coefficient for partial obstruction of grating (0.9)
KO is the outlet coefficient (1 for unobstructed and 0.5 for outlets fitted with grating or strainers)
n is the empirical exponent = 0.54 (typical)
n is the portion of slotted opening area or perforated area divided by total surface area of Top Hat Gully to intercept the water from the Ballast media
Q is the design event peak rate runoff (L/s)
QCheckDam is the capacity of the check dam (m3/s)
Q1 is the Capacity of gully (m3/s)
QBallast is the Peak flow within the Ballast Media (m3/s) QD is the peak runoff rate (m3/s)
QD is the total designed flow rate,
QiA is the actual flow intercepted by the gully (m3/s)
QiG is the capacity of the gully (m3/s)
VBallast is the flow velocity through Ballast Media (m/s), will be determined by below empirical equation
z is the flow depth over ballast media (m)
g is the acceleration due to gravity (m2/s)
Introduction
The authors were part of the team responsible for the drainage design on the northern section of High Speed Two (HS2) Phase One – Lots N1 and N2 (Area North) of the Main Works Civils Contract (MWCC). Area North includes Long Itchington Wood Green Tunnel to Delta Junction and Birmingham Spur and the Delta Junction to the West Coast Main Line (WCML) tie-in. The main civil works in Area North are delivered by the BBV (Balfour Beaty Vinci Joint Venture) Integrated Project Team (IPT).
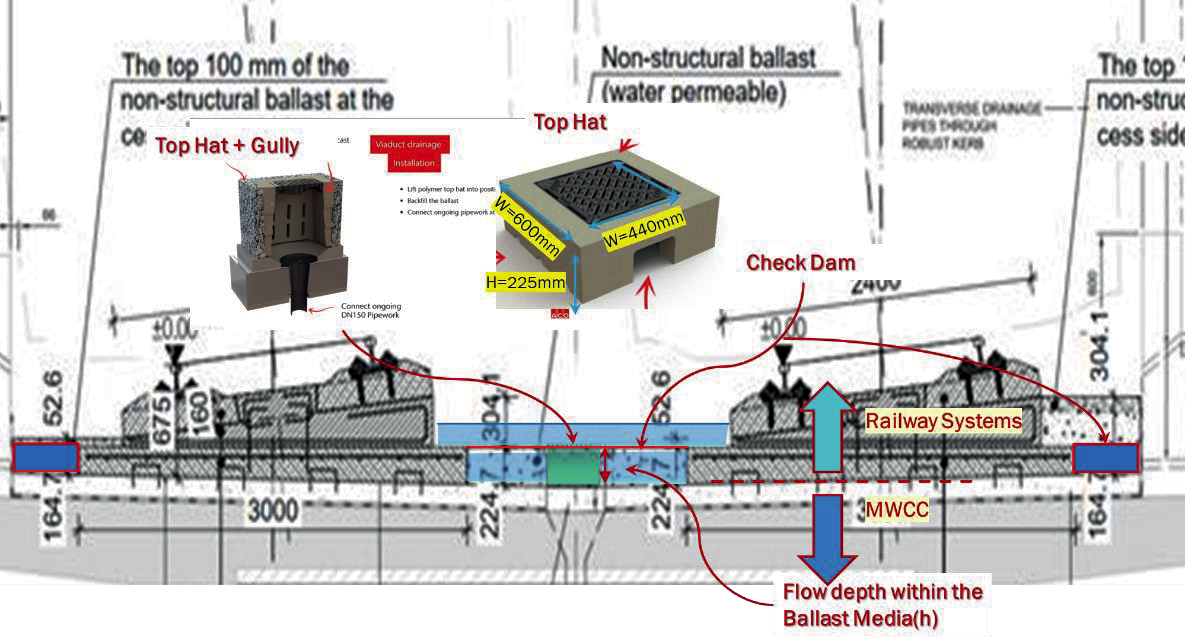
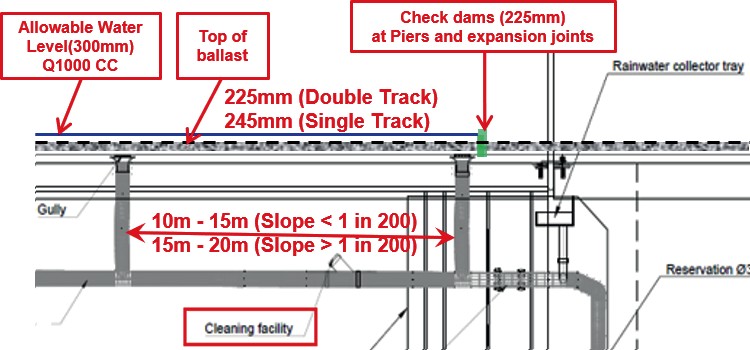
The main objective of the railway viaduct drainage system is to manage surface water to the level of service required to ensure the continual and safe operation of the HS2 trains. The HS2 slab-track system will go through 44 separate viaducts across Area North. The typical components used in railways viaduct drainage involve ballast, gullies, channels, check dams, suspended pipes and downpipes.
Infrastructure owners, research organisations and other bodies in the industry have invested in the research and development of simplified approaches for the design, construction and maintenance of drainage assets in rail and road infrastructure. Design Manual for Roads and Bridges [1] have proposed the design tables by simplifying the hydraulic flow behaviour of the open channel flow in kerb and gully drainage systems.
The predominant flow of surface water runoff in the HS2 viaduct is the flow through ballast on the deck which may be assumed to be linear. The linear relationship between the discharge velocity and hydraulic gradient is determined by Darcy’s law [2]. Research by Schmidt et al (2017) [2] indicates that flow through clean ballast can be transitional or turbulent. Under these conditions, there is a non-linear relationship between the discharge velocity and hydraulic gradient that follows a power curve and depends on the hydraulic conductivity. The conductivity depends on the grading of the material and the fouling index. The downstream conditions of these deck drainage systems are controlled by the outlet parameters such as check dams and gullies. Check dams are small concrete walls designed to reduce the velocity and utilise the full capacity of the ballast. The selection of check dam and gully capacity is dictated by the requirements of the HS2 Technical Note 1MC08- BBV_MSD-DR-NOT-N001-101007[3] to keep water level 60mm below the top of rail for the exceedance rainfall events with 0.1% annual probability of occurrence. The open channel flows from the top of the viaduct decks can be further restricted by elements under the deck including hoppers, the suspended pipes and the downpipes.
This technical paper indicates that the general principles of drainage design can be applied to drainage in viaducts. However, there is no record of specific standards for high-speed railway viaduct drainage designs. The research reviewed by the authors covers the hydraulic behaviour of each element but not the interface between the different viaduct drainage elements up to the outfall. Typical hydraulic design and simulation software packages used for drainage design do not provide stable results due to nature of the devices employed in the viaduct drainage. Therefore, a new simplified design process combining all the principles in a tool was developed.
This paper presents and describes the approach and the tool that was adopted by the BBV ITP in the design of viaduct drainage systems during the completed phase of the Scheme Design Consolidation. The structure of the paper is as follows: The next section reviews the hydraulic behaviour and the flow equations in each type of viaduct drainage element. In the last section, the tool developed by the BBV IPT is presented together with the results of the hydraulic sensitivity analysis undertaken. In conclusion an overall summary of the results is presented. The wider implementation of the tool for the detailed design phase of the HS2 and the wider industry is also identified.
Hydraulic behaviours and flow equations
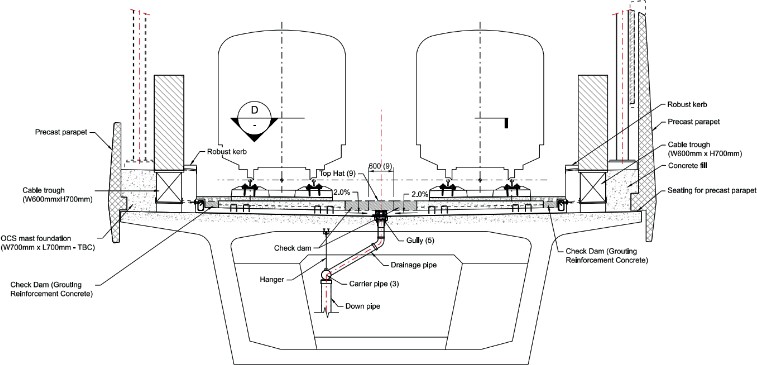
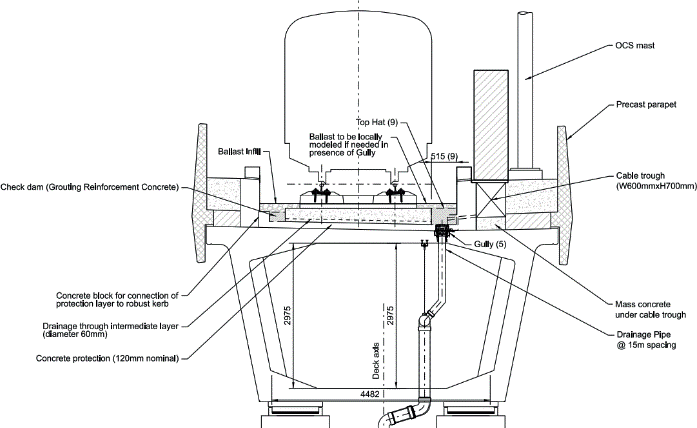
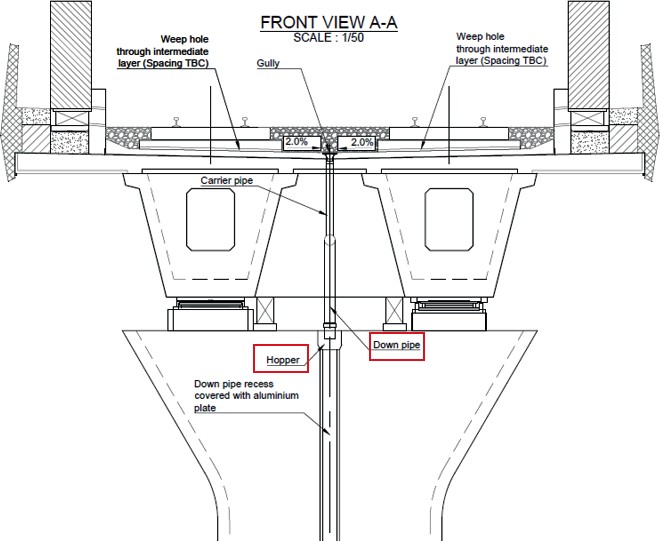
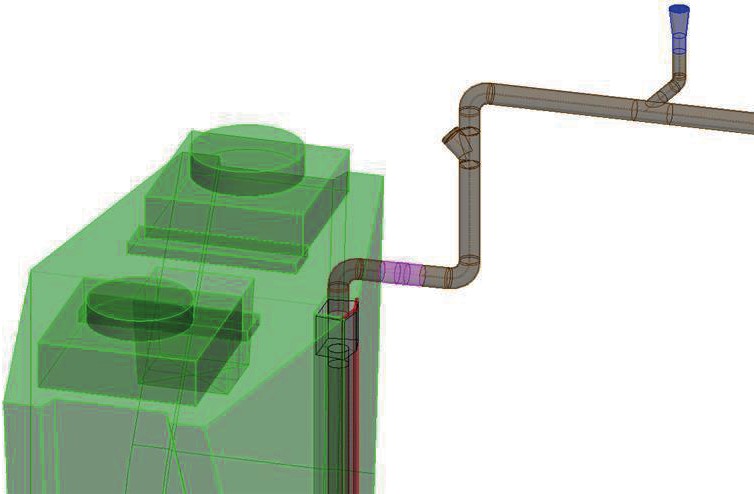
In a typical viaduct drainage system in HS2 Area North, the discharge from the viaduct deck is through gullies. The presence of ballast infill in-between tracks in a double track section (where the runoff is conveyed before discharge via gullies) restricts the flow capacity. To reduce the risk of runoff by-passing at gullies and potential increase of water levels along the deck, check dams are provided at terminal gullies in each span (and optionally at intermediate gullies). Each gully is connected to a vertical pipe through the deck. A longitudinal carrier pipe suspended under the deck then intercepts the gully connections and discharges via downpipes located at the abutments or piers. The provisions of downpipes at piers depends on the drainage strategy which means some viaducts need to have a suspended pipe along more than one span to manage flows before discharge. To limit the amount of runoff directed towards the expansion joint of the downhill abutment, the last gully is placed as close as possible to the expansion joint and ballast walls can be used as a check dam to control the by-pass flow to avoid flooding the expansion joint.
Four typical scenarios have been considered and standardised in the viaduct drainage design in the Area North:
- Single track in straight alignment without cant
- Single track in horizonal curve with cant of 160mm
- Double track in straight alignment without cant
- Double track in horizonal curve with cant of 160mm
Figure 1 and Figure 2 show the general arrangement of the viaducts with double track in a straight alignment and in cant respectively. Both arrangements are evaluated based on a minimum ballast depth of 225mm. The ballast thickness in the viaducts with single track is 20mm more compared to double track system.
The hydraulic gradient of the flow through the ballast media is assumed as parallel to the longitudinal gradient of the viaduct. This means that not all the available storage in the ballast media is fully utilised in the low flow events. Similarly, the flow will enter the transitional or turbulent behaviour during the extreme storm events.
The following principles have been used in the gully spacing for viaducts:
- Peak Runoff is calculated using the Rational Method
(1)
(2)
i = rainfall intensity for the design return period (N in mm/hr) and for a duration equal to the time of concentration T of the network. Using the rainfall intensities based on the CD 526 equation for rainfall intensities up to 50-year return period and FEH 2013 method for the storm events beyond
(3)
2min M5 rainfall depth = 4 mm for the HS2 Area North
(4)
A = total catchment area being drained (ha). The width is 6.75m and 12.35m in single and twin track configurations respectively. So, for double track assuming spacing S in m, the area is represented by the equation in (5)
(5)
- Gully capacity is based on the Bourrier Equation[2] which is similar to the Orifice equation with only difference in the coefficient of discharge. Difference in Cd between Orifice and Bourrier equation is 30% (Bourrier: 0.9*0.6 = 0.54 and Orifice 0.8)
(6)
Standard drainage arrangement on top of the viaducts along with the top hat gully proposed by ACO one of the potential supplier shown in Figure 3. Gully efficiency is assumed 100% if check dam is used, otherwise it is assumed that a flow vortex influence width of gully grating/top width of ballast (i.e., reducing it to 30%). Gully accessibility is via the perforated chamber up to top and perforations should ensure that the water flow is not restricted and grating must be provided at the top. Based on these assumptions the following two performances were assessed.
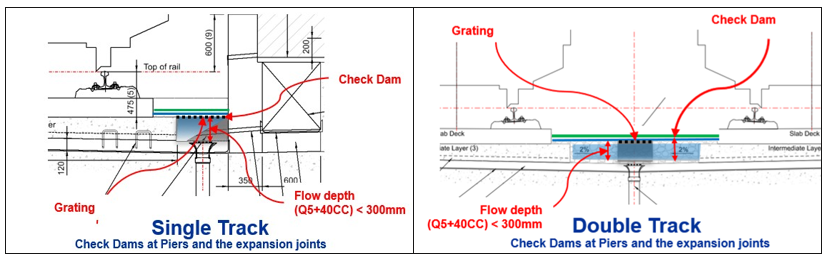
- Performance in the 1-in-5 years storm return period with 40% climate change allowance is evaluated such that peak flow is not restricted by the gully capacity and ballast provides sufficient capacity or an allowable flow depth of 300mm (the water level is 150mm below the slab track) as shown in Figure 4
- Performance in the 1-in-1000 years storm return period is evaluated such that allowable flow depth of 300mm (the water level is 60mm below the lowest top of rail) as shown in Figure 5
configuration at extreme events
- Capacity of ballast is estimated based on Schmidt et al 2017 [2]. This paper describes flow through ballast media as turbulent flow rather than laminar flow, therefore Darcy’s law is not applicable. The following equation is used to determine the flow capacity.
(7)
(8)
To standardise the flow conditions, two cases of flow patterns with and without check dams are evaluated for both double- and single-track configurations (See figures 7 and 8). The flow influence area is the extent of total flow width divided by flow vertex zone (i.e., grating opening plus flow depth x 2).
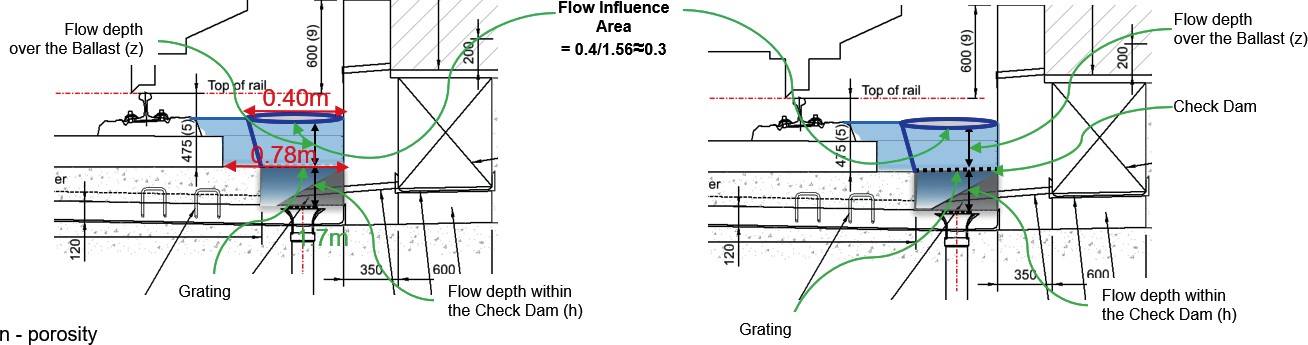
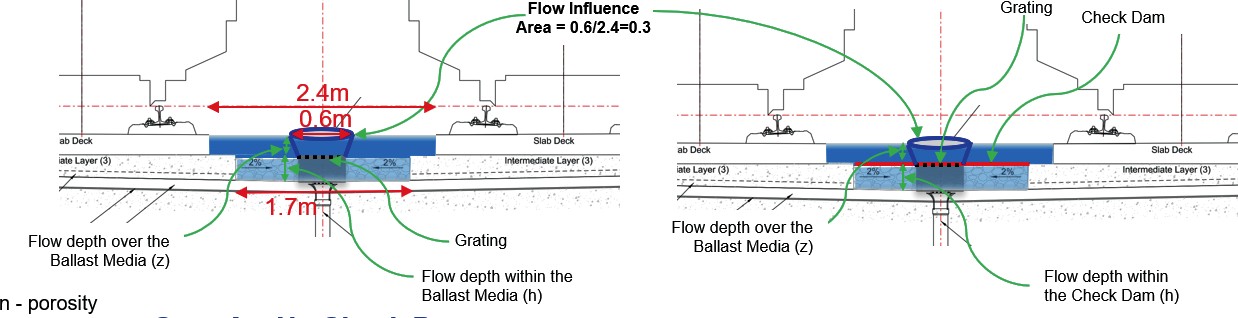
Case A – No Check Dam
(8) By-pass flow = QD – QiA for (QiA ≤ QiG)
(9) By-pass flow = QD – QiG for (QiA > QiG)
(10)
(11)
Case B – Check Dam
No By-pass flow for z = 0
(12) By-pass flow = QD – QiA for (QiA ≤ QiG)
(13) By-pass flow = QD – QiG for (QiA > QiG)
(14)
(15)
- Suspended and downpipes
Sizing of flow through Suspended Pipes and down pipes is based on Coolbroke- Whites Equation [4] (min. Ø225mm) and Wyly Eaton’s Equation [5] (min. Ø150mm) respectively. Residual flow will be collected through expansion joints by elastomer membrane or steel tray and will be conveyed to downpipes.
- Hopper depth design
This is based on the largest value derived from following weir and orifice equations[5] such that there is minimum of 25mm freeboard.
(16)
(17)
Hydraulic tool
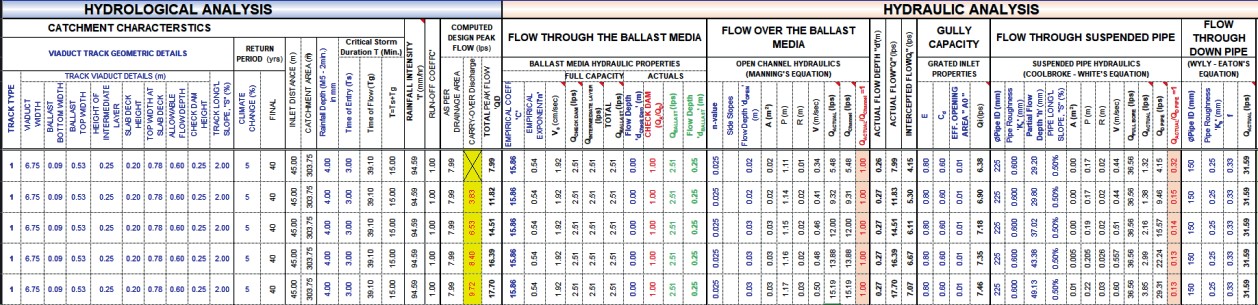
The VBA tool was developed to analyse the hydrological and hydraulic conditions in the viaduct drainage system and standardise the design process. In the hydrological section, the track geometric details are entered to determine the catchment area and intended spacing of gullies for the specific design return period and climate change allowance. The resulting peak flow is used to perform the hydraulic analysis. If the capacity of the ballast media is greater than the estimated design peak flow, then the gully interception is analysed based on both ‘check-dam’ and ‘no check-dam’ scenario. Where the capacity of the ballast media is lower than the estimated design peak flow, the flow exceeding the ballast media is analysed using open channel equations.
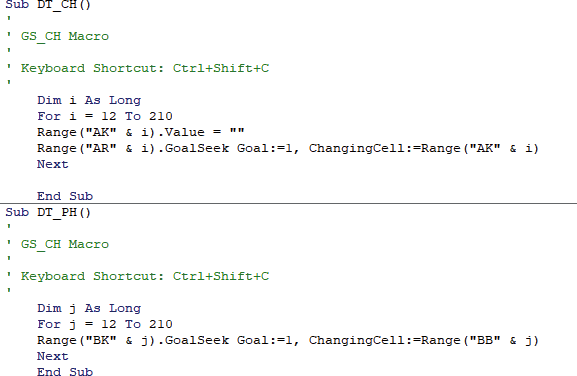
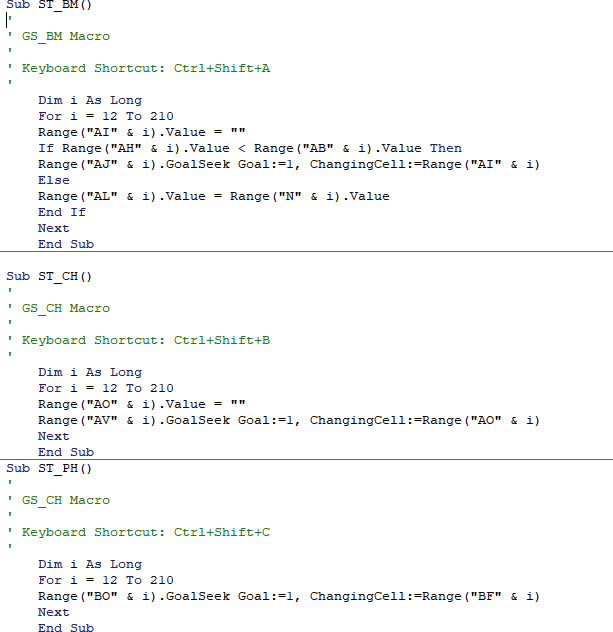
Any by-pass flow from each gully, is added to the incoming peak flows in the downstream gully. The intercepted flow from the gullies is used for the sizing of the suspended/carrier pipes using Colebrook-White’s Equation until the connection to the downpipe. Then, downpipes are sized using Wyly – Eaton’s equation. Where structural movement are envisaged, Hoppers are provided, which are sized using Orifice equation, as referenced in BS EN 12056-3 [5] based on the outfall discharge. All the equations are embedded in the worksheet, from the upstream section in the deck to the outfall into the drainage system at ground level as shown Figure 9. The Excel VBA used for the iteration of Double Track and Single-Track Channel and Pipe Hydraulics are shown in Figure 10 and 11 respectively.
Sensitivity analysis
The following 8 scenarios are tested to check the sensitivity of the gully spacing on flow depths for low flow (1 in 5year return period with 40% climate change i.e., Q5+40%cc) and high flow (1 in 1000year return period i.e., Q1000) events with varying longitudinal viaduct slopes varying between 1/50 to 1/1000 for two critical times of concentration (Tc) of 15 minutes and 30minutes. Each permutation of sensitivity analysis is shown in the following tables
- Double tracks – No check dam and Tc = 15 minutes (Table1)
- Double tracks – No check dam and Tc = 30 minutes (Table2)
- Double tracks – Check dam and Tc = 15 minutes (Table3)
- Double tracks – Check dam and Tc = 30 minutes (Table4)
- Single tracks – No check dam and Tc = 15 minutes (Table5)
- Single tracks – No check dam and Tc = 30 minutes (Table6)
- Single tracks – Check dam and Tc = 15 minutes (Table7)
- Single tracks – Check dam and Tc = 30 minutes (Table8) Key –
Table 1. Sensitivity assessment for double tracks – No check dam and Tc = 15 minutes
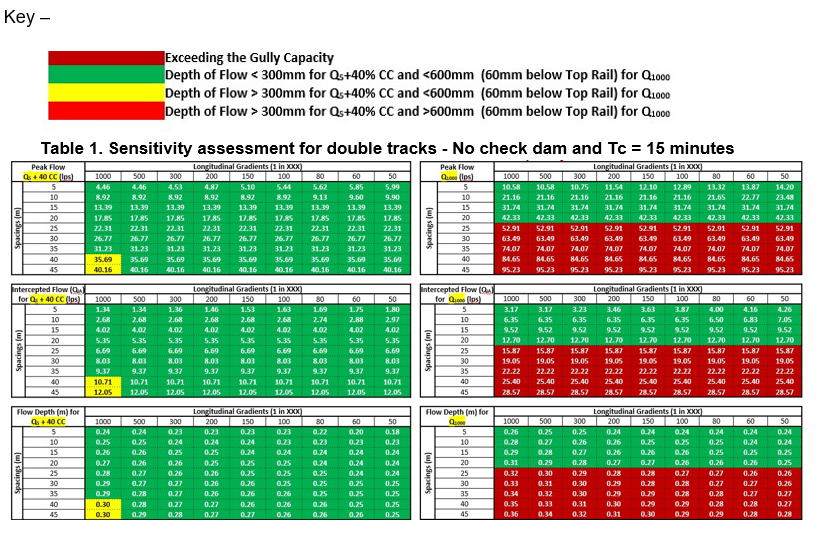
Table 2. Sensitivity assessment for double tracks – No check dam and Tc = 30 minutes
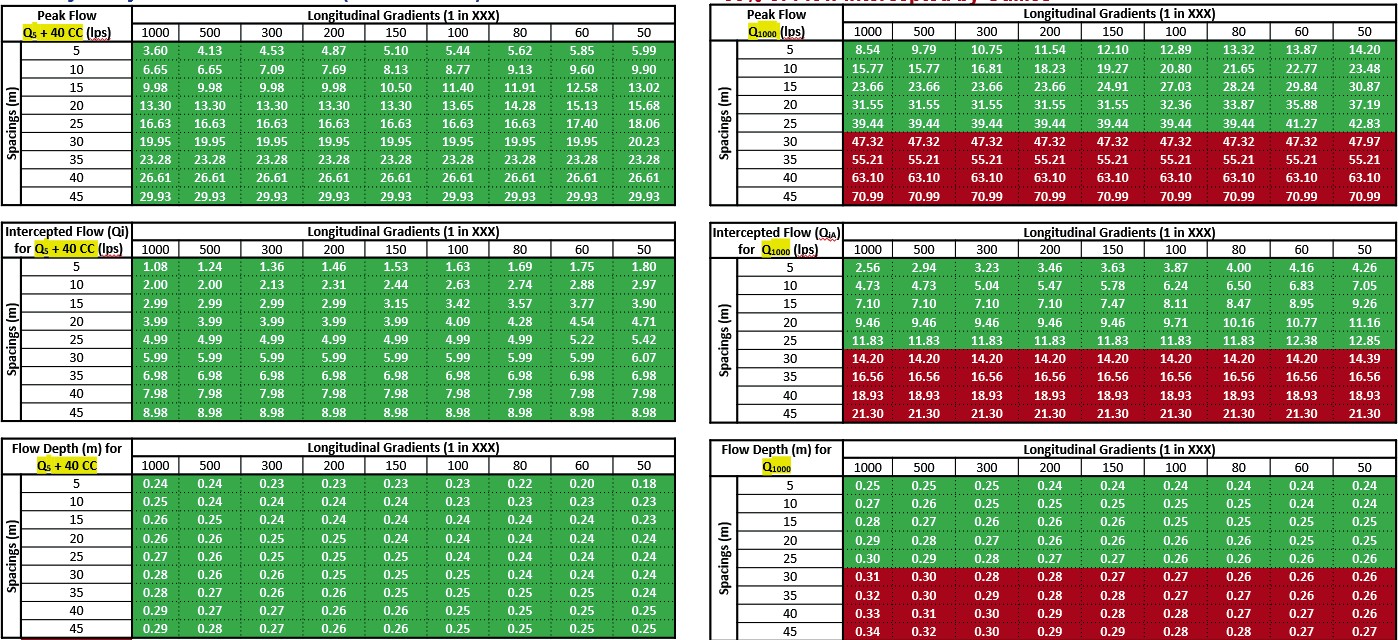
Table 3. Sensitivity assessment for double tracks – Check dam and Tc = 15 minutes
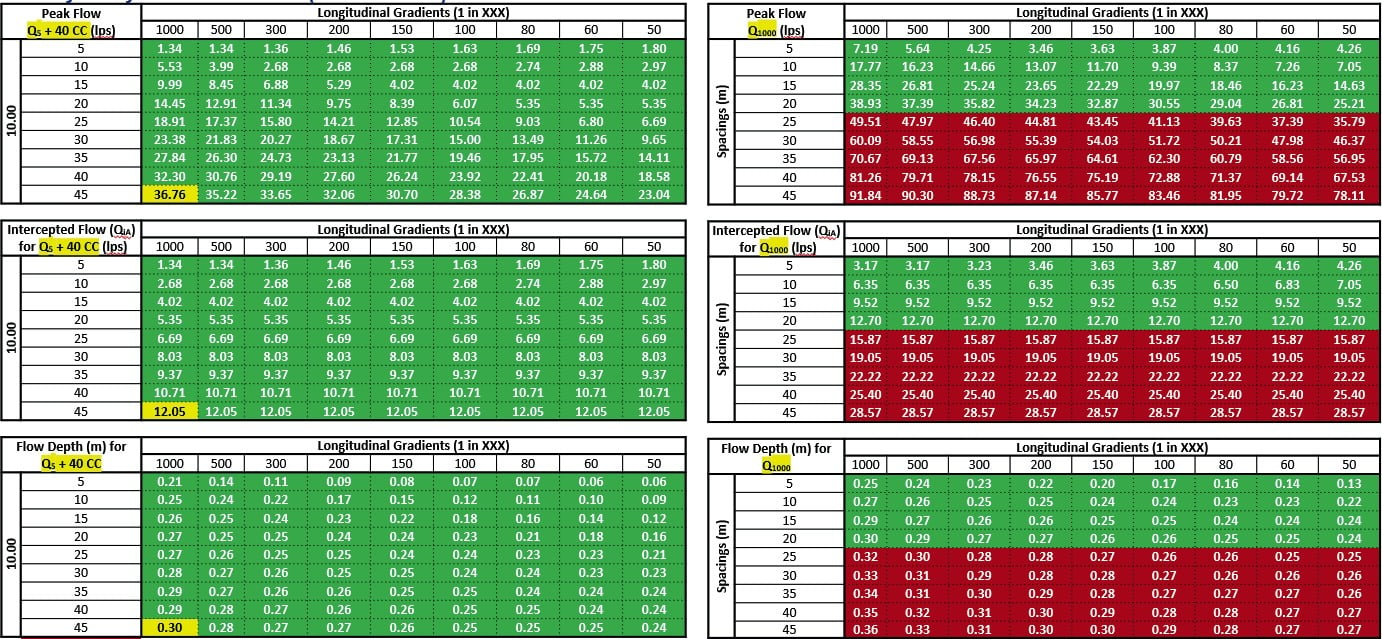
Table 4. Sensitivity assessment for double tracks – Check dam and Tc = 30 minutes
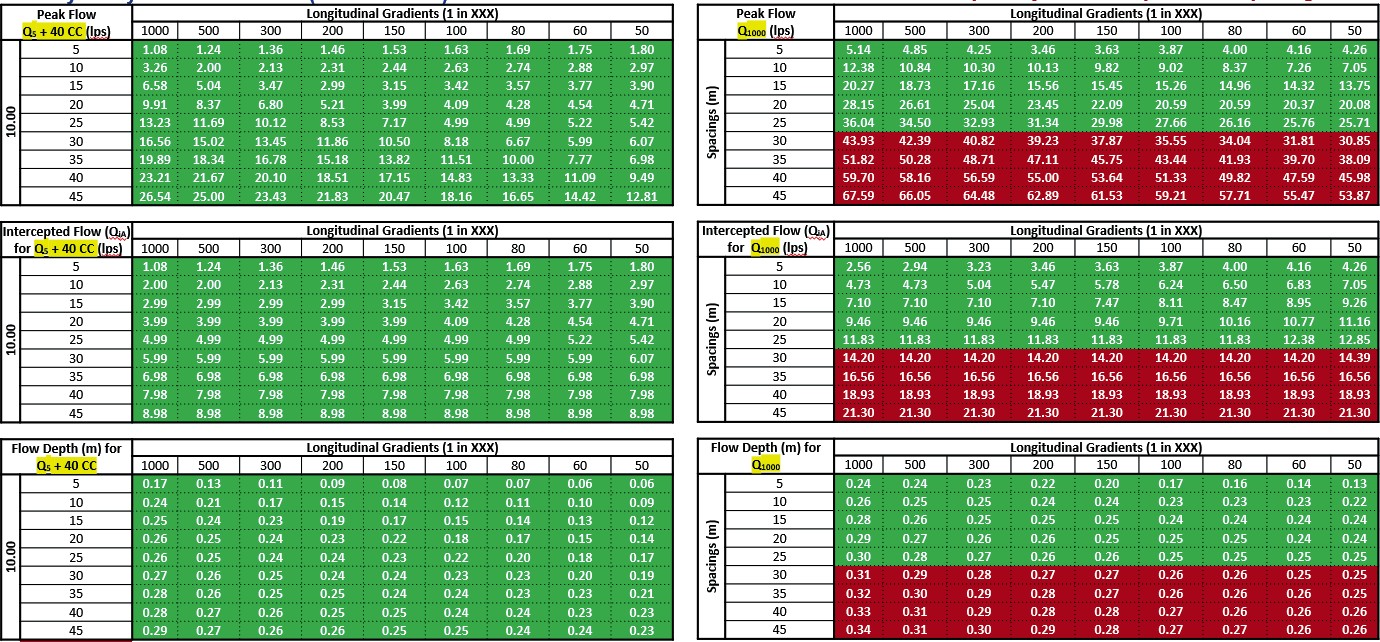
Table 5. Sensitivity assessment for single track – No check dam and Tc = 15 minutes
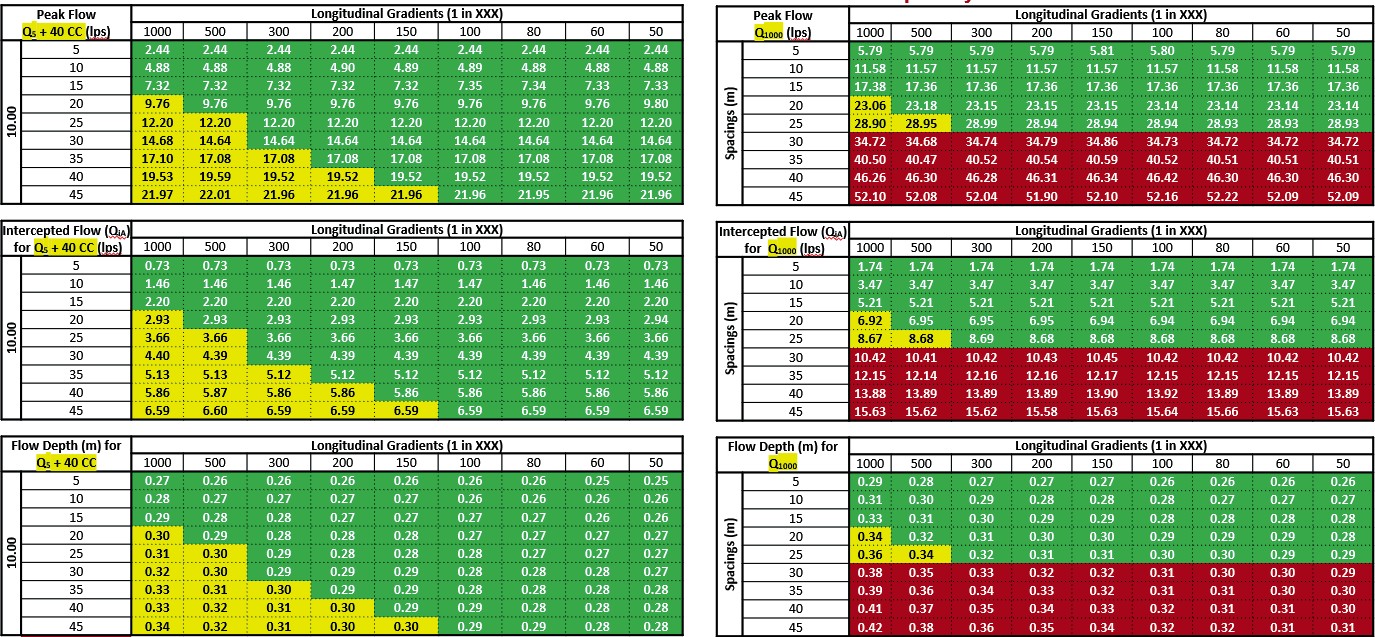
Table 6. Sensitivity assessment for single track – No check dam and Tc = 30 minutes
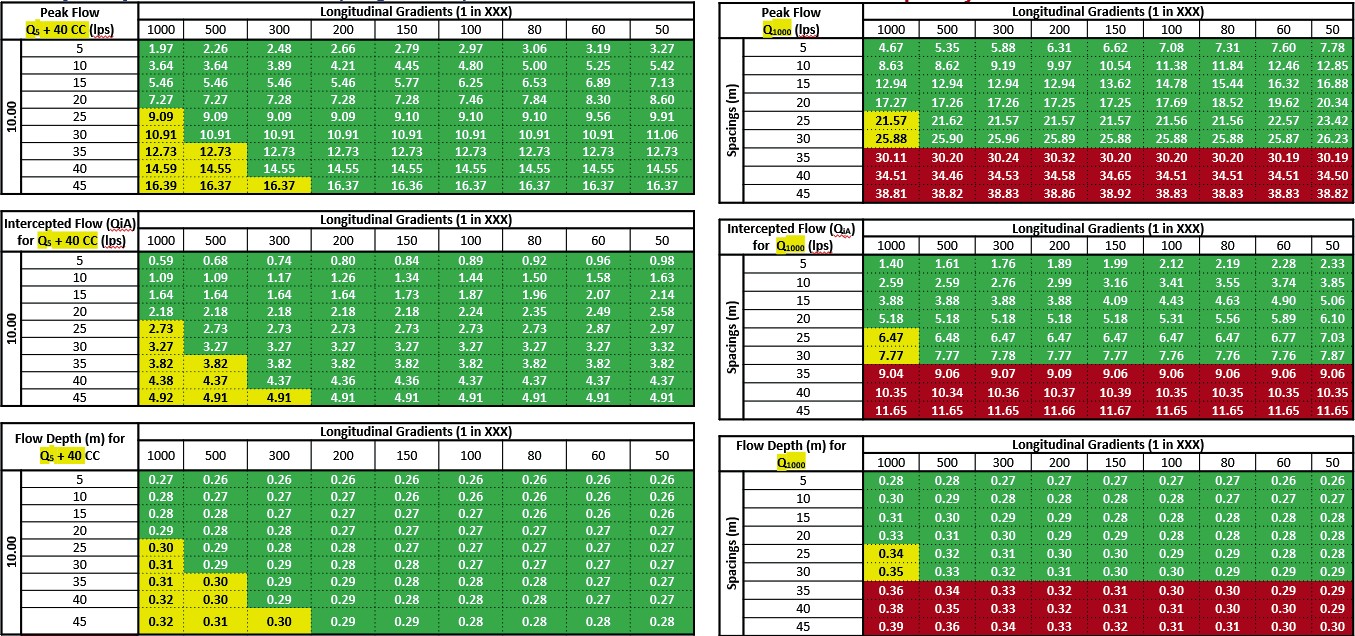
Table 7. Sensitivity assessment for single track – Check dam and Tc = 15 minutes
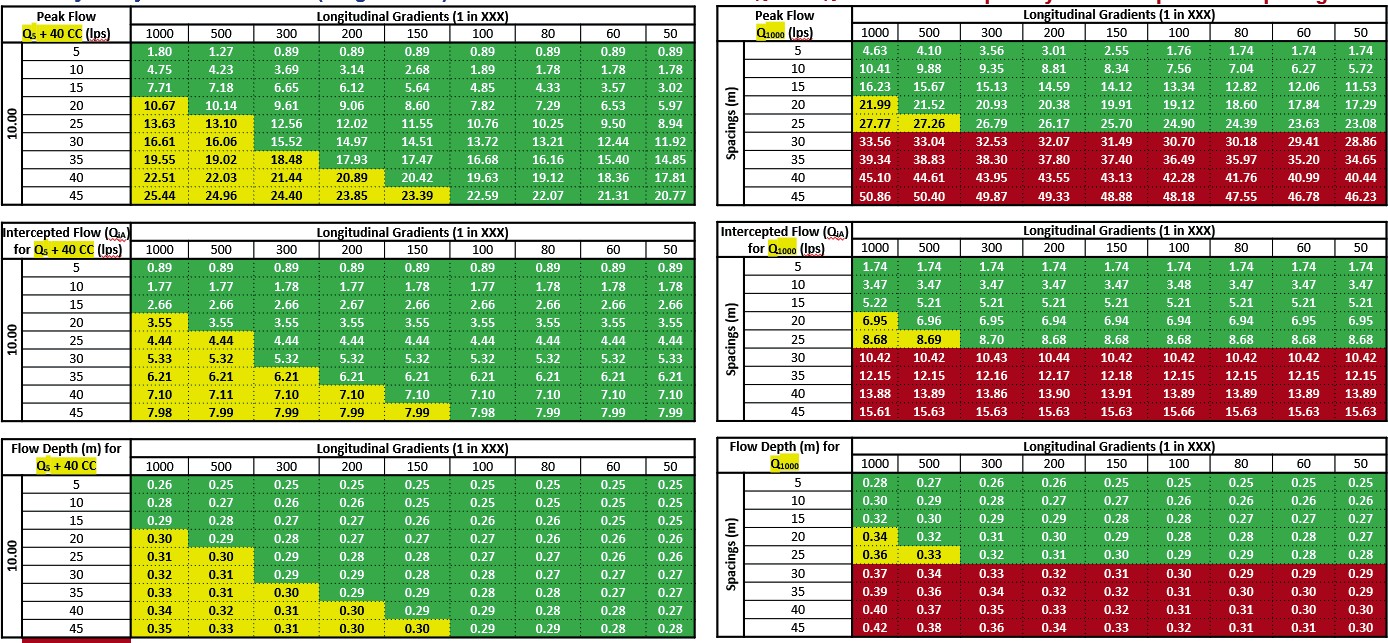
Table 8. Sensitivity assessment for single track – Check dam and Tc = 30 minutes
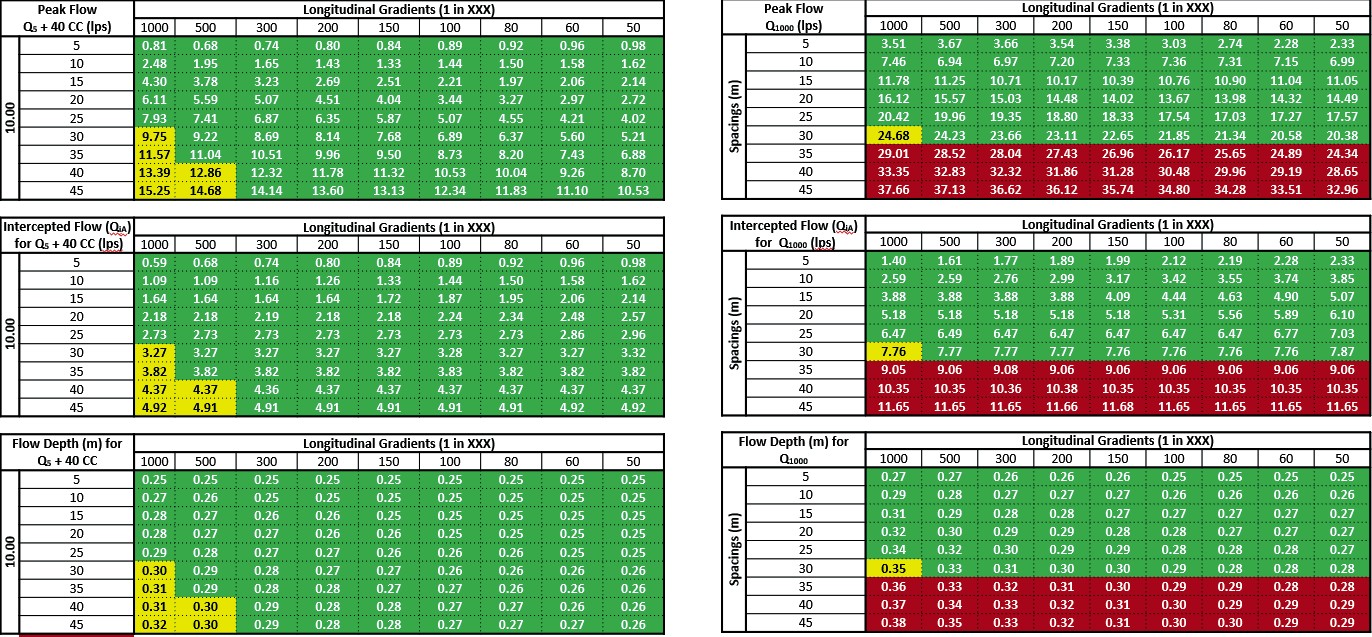
Results
By using the new VBA tool, the authors were able to generate the following results for the HS2 viaducts drainage elements:
- Internal Catchment and By-Pass Flow is reaching uniform flow condition after 10 to 15 intervals in any spacing of gullies
- Ballast media is controlling the spacing of gullies.
- Increase of Interception capacity of gullies; however, the interception flow is based on flow influence area, which may not be greater than 30%.
- Gullies are not having enough capacity to cater for any spacing exceeding 15m for Tc = 10min., 20m for Tc=15min., and 25m for Tc=30min.
- 10 – 15m gully spacing can be applied for any gradients < 1 in 200 (0.5%) for both single and double track
- 15 – 20 m spacing can be applied for any gradients > 1 in 200 (0.5%) for both single and double track
- Effectiveness of Check Dam is 20% in Double Track and 4% in Single Track compare to no check dam scenario.
Check dam (225mm high) should be provided at each pier for better function and must be provided 1m before the expansion joints; critical for limiting overflow to next catchment, ultimately impacting expansion joints
- If one or two gullies are blocked, water level will not rise beyond allowable levels, however higher by-flow at the rate 8 to 12 l/s per gully may be overflowing into expansions joints under these scenarios. Residual flow will be collected through expansion joints by elastomer membrane or steel collector tray.
Conclusions
Historically, there was no rule of thumb for drainage design guidelines that could be reliably used for early scoping and design of the drainage systems for high-speed rail viaducts. This meant that for every project, engineers must go back to first principles when designing the drainage, and that any knock-on impacts in terms of changes to the viaduct’s geometric layout or structural design may lead to iterative, ineffective work for members of the design team. Through this paper, and development of the drainage element tool the authors have aimed to create a learning legacy for HS2 and the wider industry.
The new VBA tool, created and used successfully to produce the design elements for the gully spacing & size, carrier pipes & down pipes and hopper size for HS2 viaducts, can now be used to inform the early design of any high-speed viaduct draining system. By using this system, the authors estimate that around 70 to 80% of time could be saved from the early design process, with additional savings due to the avoidance of re-work on other parts of the design. The longer-term benefits are a more robust and reliable drainage system that functions properly, slowing down the degradation of the concrete structure. This in turn prolongs the structures service life, reduces maintenance and repair cost, and reduces its carbon footprint over its whole lifetime.
Acknowledgments
The authors acknowledge the unwavering support provided by the Area North Drainage team, HS2 and DJV colleagues on constant and continuous feedback on the use of Viaduct tool.
References
- Design Manual for Roads and Bridges Drainage Design (2020). CD526 Spacing of Road Gullies. Revision 3 – Highways England
- Scott Schmidt, Sagar Shah, Maziar Moaveni, Blake J. Landry, Erol Tutumluer, Colin Basye, and Dingqing Li (2017). Principles and Calculation for flow through Ballast: Railway Ballast Permeability and Cleaning Considerations – Transportation Research Record Journal of the Transportation Research Board 2607(1):24-32 and DOI:10.3141/2607-05.
- HS2 (2016-2021). Basis of Design Addendum Structures Drainage Technical Note for Viaducts and Underbridges/Boxes Drainage Principles – Document number: 1MC08-BBV_MSD-DR-NOT-N001-101007.
- BSI Standard Publications (2017). BS EN 752 Drain and Sewer Systems Outside Buildings – Sewer System Management
- BSI Standard Publications (2000). BS EN 12056-3 Gravity Drainage Systems inside buildings – Part 3: Roof drainage, layout and calculation.
Peer review
- Ruby KitchingInstitution of Civil Engineers ( ICE)