Technical process improvement through a systems based approach
This paper focuses on a novel process maturity framework developed during the targeted improvement to the Integrated Design Review and Assurance (IDR&A) Process, by the Skanska Costain STRABAG (SCS) Joint Venture, for the delivery of HS2’s Main Works Civil Contract Southern (the Project).
The Project has written processes and procedures for each discipline, with over 40 key technical procedures covering topics such as Design Management, Engineering Management and Quality Management.
The project operates within HS2’s Technical Lifecycle Stages, such as Design, Construction and Handover, with all technical and environmental aspects of the Works passing through this lifecycle.
The Lifecycle Stages weave together the activities from each technical process, which, if poorly integrated, will lead to inefficiencies. In the case of IDR&A Process, these delays were vocalised to be in region of £1M per day for unplanned overruns that prolonged the start of Construction.
Adopting an Agile approach[1], and combining experience and good practice from other industries, the team developed a novel process improvement methodology to address the need for efficient procedures to reduce programme delays. The first iteration of this initiative removed 32 days from the IDR&A process. If that is repeated across all Detailed Design work packages it provides potential savings of 4200 days.
This piece of work analysed the end-to-end process, from the perspective of the Lifecycle, to bring together activities from each single discipline process and will cover the methods and tools used to analyse the IDR&A process, focusing on our novel Multi-Dimensional Maturity Framework. Engagement with practitioners was critical to this activity and provided value across all technical process analyses. The analysis of the task maturity through a custom designed framework enabled the project to implement simple changes to processes, technology, and behaviours, subsequently opening the door to bigger tool and process enhancements.


Introduction
Delays in construction programmes are expensive. Systemic delays, due to process inefficiencies, can be avoided through careful design. Delays due to probable events can be minimised with process design. Delays due to unexpected, unforeseeable events will always remain in some form.
Analysis of the technical processes as a connected ecosystem can identify the causes of delay and can highlight improvements in technology, process and behaviours that will reduce the systemic delays of the end-to-end process, and therefore the associated overbudget expenditure.
This paper focuses on a novel process maturity framework developed on the Main Works Civils Contract (MWCC) for the southern section of High Speed Two (HS2) Phase One (which includes the Northolt Tunnels and the Euston Tunnel and Approaches), delivered by the SCS Integrated Project Team.
The authors developed a framework for measuring process maturity to identify the causes of process inefficiencies and assess the required steps to improve the process, both in the short term and in the longer term.
This work looks at all three sides of the People – Process – Technology triangle[2] and recognises that change in one will affect the other two. The Process is the nominal focus of the analysis, but the maturity assessment brings in the Technology (or tools) very clearly. The work also looks at the People aspect and can identify the need for additional training, or behavioural management interventions.
The Multi-Dimensional Maturity Framework facilitated the development of a systematic, integrated approach to adopting continuous improvement to technical processes on the Project. The methodology ensures there is systematic analysis of processes, which identifies inconsistencies and aids the understanding of interactions between actors, tasks and other processes within the organisation.
The use of formalised systems modelling techniques such as Systems Modelling Language (SysML) and Unified Modelling Language (UML), within the methodology enables the creation of consistent visualisation of the processes and their elements. This allows the process modelling team to view data from different perspectives, as well as assess impact of any changes. Combining these with the Multi-Dimensional Maturity Framework allowed the team to make an assessment of current processes and task maturity against the Project’s needs.
This effort sits alongside a programme of work to bring all the project systems into a Common Data Environment (CDE). This process improvement effort worked in parallel with the CDE work, identifying necessary interactions that had not previously been uncovered, and helping to prioritise not just the long term CDE plan, but also short-term enhancements. The end-to-end IDR&A process was redesigned to reduce the overall time. The workshops uncovered people interactions as well as tool interactions, and the improved understanding of the upstream and downstream needs of other roles has made significant improvements in the information flows.
Problem and context
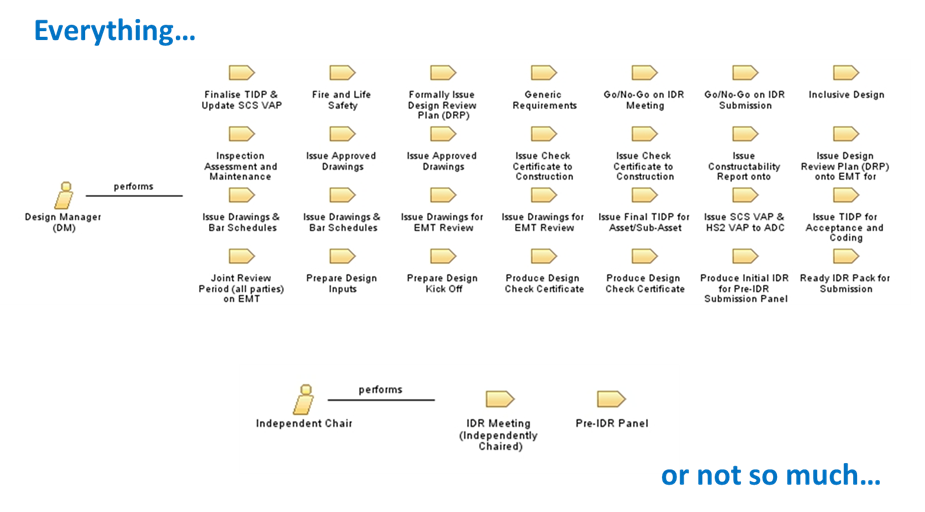
Technical processes are necessarily inter-related. They differ in this respect from many business processes, which can stand alone in their analysis. The process for a discipline or silo can be defined, but a lifecycle process can only be truly defined when the discipline processes are interwoven correctly. This connectedness leads to complexity in managing technical processes. This complexity and how the lifecycle processes are formed is demonstrated in Figure 1.
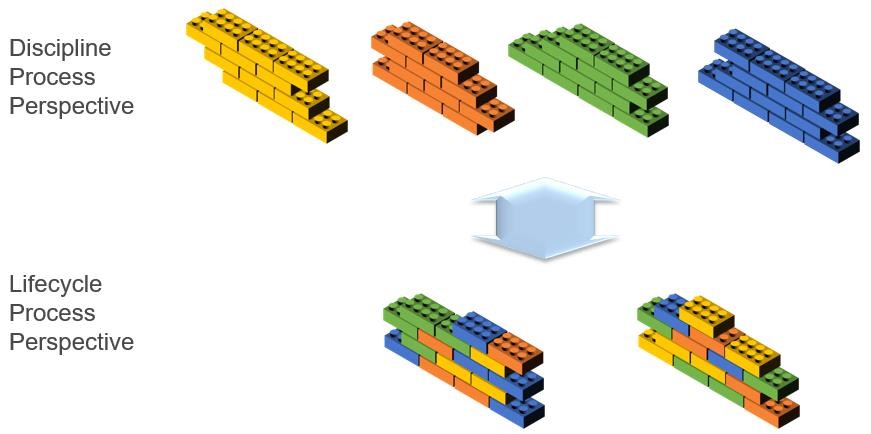
Each process will typically require some tool support to effectively implement. Looking at single discipline processes as isolated entities leads to implementing tool support in an isolated manner; each discipline with its own version of data, unconnected to other disciplines.
The situation in the organisation was not the extreme of unrelated, private spreadsheets, but was not yet a fully integrated Common Data Environment. In an effort to move closer to a true Common Data Environment, with a single source of truth, and federated, connected databases, the authors noted the need to assess and improve process alongside the tool support improvements.
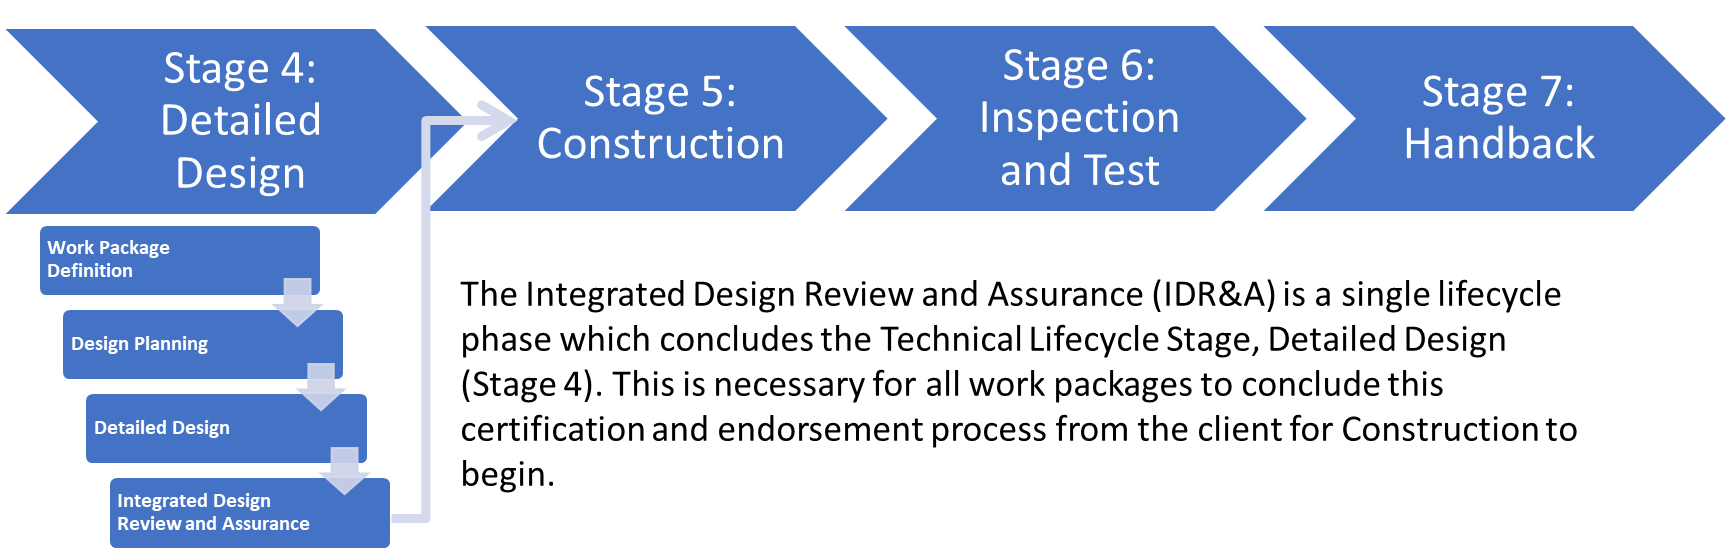
Scope
The scope for this work was a single lifecycle phase – the Integrated Design Review and Assurance (IDR&A) process. This process concludes the certification and client endorsement of the detailed design before the construction can begin. This lifecycle phase is planned in the contract at 12 weeks, with any delay causing significant cost to the delivery programme. It presents the final design of the Works, its assurance certification and the endorsement of that certification by the client. The goal is to conclude the technical lifecycle stage (Stage 4), allowing the Works to progress to construction. In the project under discussion there was a best-case plan of 22 weeks for this phase, before any process modelling, and improvement work begun.
The team looked at the existing process, modelled this as-is, applied the maturity framework to identify candidate areas to reduce the timescales, and defined the new, to-be process at 15 weeks. This 15-week duration is an intermediary step towards the contractual 12-week timeframe. The initial reduction is on the first iteration of the process modelling and improvement work.
Multi-Dimensional Maturity Framework
The core of the improvement work was the Multi-Dimensional Maturity Framework. The Maturity Framework used within the methodology has taken the key concepts from the maturity levels defined in the Capability Maturity Model Integration (CMMI®)[3] process level improvement and combined with techniques such as empathy mapping[4] to provide a framework that not only assesses the characteristics of a process but the users within. The framework was developed to assess individual tasks within a process but has since been successfully applied to whole processes.
The assessment levels developed from the CMMI staged maturity model, are on a 1-5 scale with a sixth, Level 0, added from the Capability Im-maturity Model[5]. CMMI takes a defined set of process areas and defines the activities necessary for each level. The levels are:
- 5 Optimising – improvement fed back into process
- 4 Quantitively Managed – quantitively measured process
- 3 Defined – qualitatively defined and institutionalised
- 2 Repeatable – dependent on individuals
- 1 Initial – ad hoc or chaotic
- 0 Negligent – failure to allow success or counterproductive
A set of definable dimensions was developed to address all technical processes and how they are supported. These Dimensions are.
- My-Process – how consistently is the task or process applied
- My-Tools – what tool support exists for the task or process
- My-Work – how easily can the individual see their highest priority work items
- My-Team – how well can a team-lead see the progress of work
- My-Value-Add – what is the effect of the task or process not being done
Each Dimension was then given a short description for each maturity level. Objective criteria were developed to support the assessment process based on Empathy Mapping, which is a key element of Design Thinking[6]. How and why these Dimensions were conceived is to be found below.
A summary table of the Maturity Assessment Dimensions and Levels is shown in Table 1
| Maturity Level | My-Processes | My-Tools | My-Work | My-Team | My-Value-Add |
|---|---|---|---|---|---|
|
Overview/Example Metrics |
Consistency | System & Enforcement |
Notifications, visibility, accountability |
Reporting, dashboard, veracity of data |
What if we don’t do it? |
|
Level 5: Optimising |
Reviewed for performance |
Automated checking |
Workflow automation |
Live dashboard progress |
Not on critical path, easy to implement |
|
Level 4: Quantitatively Managed |
Monitored & measured |
Connected integrated CDE |
Multiple dashboards |
Metrics dashboards |
Critical path, easy to implement |
|
Level 3: Defined |
Consistently applied |
Standard set of tools used in same way |
Email notifications |
Regular standardised reporting |
Not on critical path, hard to implement |
|
Level 2: Managed |
Written procedure not always executed in the same way |
Shared documents, inconsistently implemented |
Manual emails or conversations |
Manual reporting on schedule |
Critical path, hard to implement |
|
Level 1: Initial |
Folklore |
Locally held information |
Folklore |
Individual conversations |
Necessary but non-value adding |
|
Level 0: Negligent |
No defined process, not understood |
Information not to standard, no notifications of completion |
Not sure who to hand over to |
Unable to find current status |
Non-value adding |
The five dimensions explained
Maturity Assessment Dimensions: To create the Maturity Assessment Dimensions, the key concepts of numerous frameworks and models were combined and developed, a key source behind this is a development of the commonly known People, Process and Technology, Golden Triangle, Framework, which is based off a diamond model developed in the 1960s by Harold Leavitt to apply organisational change in industry[2].This was developed further to adapt it to reflect the complex needs of projects and organisations specifically in the areas where people are involved. The ‘People’ aspect of the framework was separated into two further Dimensions: ‘My-Work’, which reflects the day-to-day activities of the individual, and ‘My-Team’, which reflects the combination of individuals work towards a common goal. These will be expanded upon below.
The fifth Dimension is ‘My-Value-Add’ and the concept behind this Dimension is built upon a combination of the well-established critical path analysis[7] technique and a measure of the task difficulty. For this framework the authors have viewed task difficulty as a combination of the time taken and the cognitive effort spent to complete a task. Factoring in the cognitive effort spent on a task as well as time taken, enables a deeper understanding of the overall process and aids with the prioritisation of process improvement efforts that do not solely increase process efficiency but include the realisation of benefits to the processes’ stakeholders; i.e. reduced stress and frustrations.
Having evaluated CMMI in respect to the scope of the project the team has moved beyond the existing frameworks by formulating and subsequently adding five additional criteria, namely the Maturity Assessment Dimensions, to provide us with the robust MultiDimensional Maturity Framework.
These Maturity Assessment Dimensions are further explained below:
My-Processes: This Dimension is concerned with the written procedure and how it is executed and managed. The score of this Dimension can provide insight into many aspects of the process that may need to be evaluated such as elements that make the written process difficult to understand, the completeness of the process, redundancies and bottlenecks. Analysing a process with a focus on how the process is written and implemented can aid the documentation of implicit knowledge, identifying opportunities for improvement and problematic areas and offers a more detailed picture of an existing process.
My-Tools: Analysing the tools used within a project and process is useful to identify how the current software suite available is helping or hindering our process, whether the tools and systems in place are enforcing the defined procedure. A score in this Dimension will provide insight into how data and information are stored and shared, and whether tools are creating or alleviating bottlenecks and pain points. This is an important area to evaluate to ensure the organisation is progressing towards a Common Data Environment, and when developed alongside the other maturity assessment Dimensions can lead to large improvements in efficiency, and cost savings.
My-Work: The ‘My-Work’ Dimension assesses the routine operations of the individual where the focus is around the notifications, visibility and accountability of those who are stakeholders of the process. A score in this Dimension demystifies how these activities are planned and undertaken, whether roles have clear direction of their tasks and how each individual finds out when something is required of them within a process. Key benefits to this analysis revolve around the removal of bottlenecks, improving the daily working of individuals, and making the task handovers of the process more efficient and effective.
My-Team: This Dimension concerns the bigger picture of the team’s progress and aims to provide an answer to the questions of ‘what are other people doing?’ on a team or can be expanded to a project level. A score in this Dimension provides insight into how task and process progress is reported and the veracity of the reported data. Improvements in this Dimension are important for preventing duplication of work, ensuring there is a single source of truth, providing real-time reporting and aiding the continuous improvement of all processes and procedures.
My-Value-Add: The anomaly is ‘My-Value-Add’, where the levels are based on binary criteria of whether value is added, whether the task or process under assessment is on the critical path, and whether it is hard to implement or easy to implement. These measures of ‘hard’ or ‘easy’ to implement are based on the time taken for the task to be completed and the cognitive effort required by the individual carrying out the task.
Objective assessment criteria
Within the Multi-Dimensional Maturity Framework empathy mapping has been used to determine what people ‘might’ do, what people ‘might’ say, what people ‘might’ think and what people ‘might’ feel against the levels of maturity in the framework. This enables us to highlight issues more accurately but also to extract greater benefits of this work not just in terms of process efficiency and financial gains but also satisfaction and happiness across the business. For example, a process that has been assessed to be at maturity level 0 ‘Negligent’; the effect of this on an individual’s feelings may leave that individual feeling stressed and demotivated, in comparison to a process at maturity level ‘5’; the individual may feel happy or content with their role within a process.
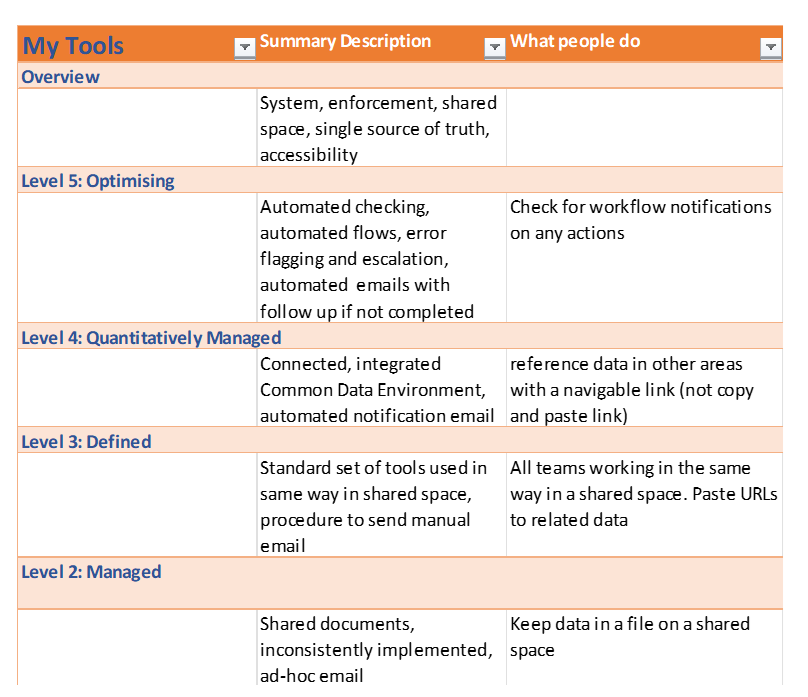
When assessing the IDR&A process, the team interviewed practitioners for the individual tasks to identify the current as-is maturity levels. The grids of objective criteria enabled consistent scoring across the tasks. Figure 3 shows part of the assessment grid for the MyTools Dimension, focusing on What People Do. This column is our easiest reference, and the What people Say, Think, and Feel is required to give clarity in more ambiguous situations.
Having used empathy mapping to develop the framework it ensures that it is commonplace throughout the assessment of not only processes but all aspects of the business or project such as tools, work, team and value-added activities, to identify pain points across the business ranging from identifying and recording frustration in the operation of an unoptimised tool to identifying knowledge and information that is not easily accessible to those who require it.
Implementation
Initial as-is state
The starting point for the as-is model was a Gantt chart view of the lifecycle process. This provided the set of tasks to be analysed. Each task was then looked at to find its input and output work products and the primary and secondary roles performing the task.
Stakeholder engagement is a crucial part of the methodology. It starts with an ‘as-is assessment’ of the process with its key stakeholder, or in this case the process owner, to evaluate the current process steps and to how well it is being adhered to in the ‘real world’. These sessions are undertaken through workshop or interview-based settings to ensure a true reflection of the process and accurate ‘as-is’ scoring is obtained.
Another aspect that requires stakeholder engagement is the task handover assessment, this looks at how the process moves from one step to another focusing on the triggers and actions that may or may not be in place. The aim of this type of analysis is to identify and eliminate time loss in handovers between individuals, teams, or systems. This can highlight missing handover triggers and information content or format issues with the handover.
An open and high-trust discussion with the stakeholders is essential. The team uncovered inefficiencies due to missing information on the task handover, and when challenging that in the previous task, the team uncovered inefficiencies caused by the ‘need’ to remove or reformat data. Both parties benefit from a change, but the existing process documentation in the discipline silos leads to an un-integrated lifecycle process.
Similar to the ‘as-is’ workshops and interviews, the ‘to-be’ assessment with the key stakeholders or process owners is to ascertain the maturity levels the process should be functioning at, first looking at the high level, overall process scores then a deeper investigation into the individual tasks. With this understanding, low value steps can be removed from the critical path to increase the efficiency of the process.
The ideal ‘to-be’ maturity score is not always 5. An increase in maturity typically adds cost, often in the form of tool support or additional reviews. The team found that a level of 3, 4, or
5 was desirable, depending on the task. A task associated with a KPI might need a My-Team maturity of 5, many tasks are brief and from a management reporting perspective unremarkable. The ability to find out where a work package is stuck is important, but that may be accomplished with a My-Team maturity of 3 for some of the tasks.
Systems modelling
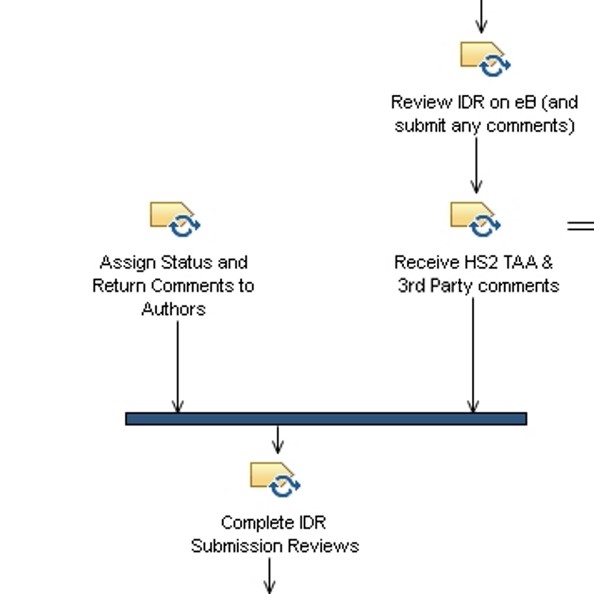
The end-to-end process was modelled using formalised modelling techniques (SysML, and UML), including the input and output artifacts (work products) and the key roles. Sequence Diagrams were generated to analyse the task handoffs, highlighting a need for increased automation and tool support. The process model in IBM Method Composer showed long chains of tasks in the critical path, it showed ‘magic starts’, as in Figure 4, where a task has no causal trigger, it showed tasks that were a ‘dead end’, which is not necessarily a fault, but needs to be assessed.
The value of incorporating these aspects into the methodology is as follows: role analysis highlights that some roles were at risk of being over-committed due to activity on multiple work packages causing conflict, while others were involved on only one work package, with many tasks to schedule. The task information requirements for these roles would be very different. In being able to identify this through the objective evidence provided by the model, actions can be taken to redistribute tasks appropriately to alleviate strain on resource or time, which aids process efficiency but also the stress levels of the individuals involved. In the example shown in Figure 5, our Design manager needs to be able to see where they are in the progress of their work package, our Review Coordinator by contrast has very little to do for each individual work package but needs to know which, of many work packages is the highest priority to work on next.
The ability to model the work products ensures the capture of implicit information from the project, which enables the identification of who is responsible for a work product and the tasks that require the work product, ensuring clear traceability and accountability throughout the organisation.
Modelling the task handovers using Sequence Diagrams highlights the need for increased automation and tool support and identifies the missing links between tasks and actors, which in turn strongly links to the ‘My-Work’, ‘My-Team’ and ‘My-Value-Add’ Maturity Dimensions.
Assessment
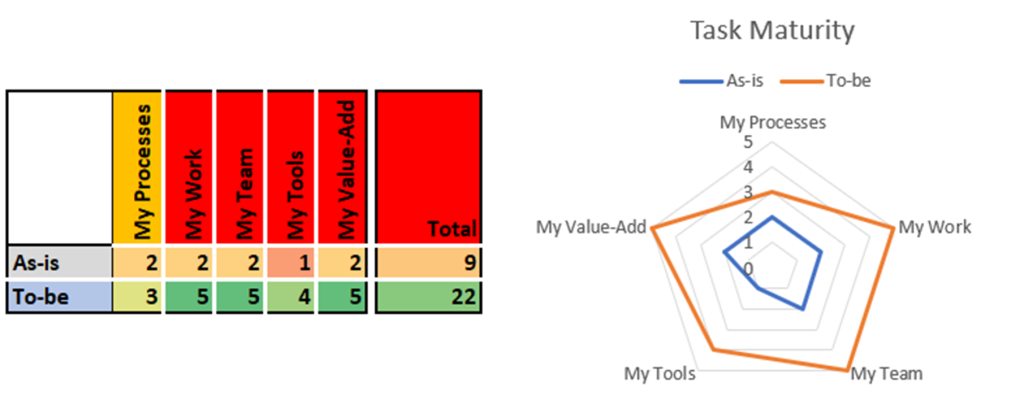
After compiling the scores obtained during the assessments of the ‘as-is’ and ‘to-be’ states of the process, the data is used to provide metrics for prioritisation at either a wider project level: ‘which process should I target first to improve’, or within a process: ‘which Maturity Dimension should I target improvements around’. The output for the Maturity Dimensions is represented visually using Radar Charts due to the multivariate data, which provides the assessor with the differences between what the process maturity is currently and where the process needs to be. Priorities can then be determined based on the differences between the ‘as-is’ and ‘to-be’ values of each Maturity Dimension.
It should be noted that the five Dimensions are not independent. The My-Work and My-Team maturity cannot be improved independently of the My-Tools maturity. Process should be refined to take advantage of tool support and tools should be put in place to support the process. The My-Value-Add Dimension is also dependent on My-Process and My-Tools.
Tool improvements typically take significant effort. A short-term improvement can be gained by allowing read-only access to a spreadsheet, or by changing approval signatures from a linear handoff to a review meeting. While a longer-term change may be desirable, an interim short-term change has value.
The sample scores and radar chart in Figure 6 show the difference between the ‘as-is’ and ‘to-be’ scores. By summing the numbers and assessing the overall difference, a very simplistic prioritisation can be carried out. The example shows a large difference in the My-Tools scores, which will influence the discrepancies in the other Dimensions. A long-term change to a Common Data Environment tool with process support and notifications is the likely need, but a shorter-term fix to push My-Tools out to a level 2 or 3 could ease the My-Work and My-Tools differences.
When expanding this analysis across an organisation, larger trends can be identified by overlaying all task/process maturity radar charts to see if there is a common trend across the business/project. For example, tool development or support is low across the board in comparison to where it should be. Within the model every task within a process is tagged with its current Maturity Assessment Level, this is used to visibly track progress and to highlight remaining areas of improvement for all stakeholders involved. This Maturity Assessment Level is not an absolute but is a measure of the difference between the ‘as-is’ and ‘to-be’. It is easy to highlight the biggest problem areas from the tag. When looking at the individual tasks the score grid and radar charts are shown.
Tools
Data was captured and sorted for input to the model in Microsoft Excel; this was a staging area. The model was created in IBM Method Composer, using the IBM DOORS Next integration to allow multi-user concurrent editing with staged delivery. Work Breakdown Structures were created to model the task dependencies, and task durations were added to give visibility of end-to-end timing improvements. The model included additional data to describe the work products, the roles and the detail of the tasks. Guidance notes were included in the model.
IBM Rhapsody was used to model task interactions in the form of Sequence Diagrams.
Moving to the ‘to-be’ state
The modelling enabled the team to focus efforts on the areas of greatest need. Changes were needed for a mix of People, Process, and Technology and some of these are highlighted here.
People: During the implementation of the methodology, the team identified some issues with people omitting required information when submitting items for review. Behavioural Management Theory [8] tells us that with no reinforcement, this is an expected outcome. The most robust method to ensure the behavioural change is to enforce rules in the tools. These requests were routed to the team leading the Common Data Environment improvements. Some issues involved one role actively removing data and the next role in the process having to search out the missing data. This was easily resolved with improved understanding of the downstream needs. Behavioural Management Theory tells us that there is no need for additional controls in this case, as the desired behaviour is easier than the undesired behaviour.
Process: The IDR&A process was redesigned, allowing some of the critical path activities to happen in parallel, improving use of the time between review start and review end, and adding pre-IDR&A quality thresholds. Some of the process changes are tied to Technology changes, including the introduction of a new tool with improved governance. This roll out of a new tool requires training for the users. One step was removed from the customer involvement, reducing the workload for the customer, and reducing the overall time, without impacting governance or quality. This can only be achieved with a full understanding of all the dependencies.
Technology: The Common Data Environment (CDE) was being actively developed during this work. There was a good understanding of the needs of the individual teams within their work, with some gaps in understanding of the needs between teams. The CDE brings together data, integrating tools, to reduce or remove duplication. This requires development of new tool integrations and introduction of new tools. These changes can take significant development time, and while one such new tool was already in progress and added great value to the IDR&A process, others are many months away. Tool configuration changes are much quicker to implement and can deliver short-term value. The process can be further refined once the technology is deployed.
Future work
The success of the process improvement in the IDR&A process has led to a programme of work to address our other technical processes. The team has created a capability to assess and model all the current documented, single discipline processes owned by teams, such as materials handling, change management and information management. The elements of these processes work together to form the lifecycle processes and once in the model, the reuse ensures consistency. It is then possible to view the tasks in the context of the team or role, and in the context of the lifecycle. The Multi-Dimensional Maturity Framework is a key part of this modelling and analysis activity.
Having brought together ideas from Software Development (CMMI), Design Thinking (Empathy Maps) and Systems Modelling (Sequence Diagrams), efforts are continuing to expand our use of ideas from other areas. The current process improvement work is running on a modified Agile programme and have a pool of ideas to shape to our needs.
The RACI (Responsible, Accountable, Consulted, Informed) assignments are being integrated into the model, and the model is being published to an intranet website to complement the formal approved document views of the processes.
Conclusion
Through its five Dimensions, the Multi-Dimensional Maturity Framework provided an objective assessment of technical processes and procedures on the Project, reducing the IDR&A process by approximately 32 days, taking the duration of the IDR&A process from 22 weeks to 15.6 weeks for each time the process is followed. Further iterations are required to reduce this duration to the contractual 12-week duration for this process.
It sets the groundwork for targeted organisational, behavioural, and cultural change identifying issues with current ‘as-is’ process and practices and saving time and effort on the programme delivery.
The modelling of processes combined with the Multi-Dimensional Maturity Framework provides a comprehensive assessment of the tasks and task interactions to ensure that all proposed changes do not inject undesirable emergent consequences. Inconsistencies and issues in processes such as ‘magic starts’ and long critical path chains can easily be identified to improve their integration and mitigate potential risk to programme activities.
Stakeholders engaged enthusiastically as many of the found issues were causing stress and frustration, in some cases to both parties on a data transaction interface. Previous analysis attempts had not taken a cross discipline, rigorous view, and had not uncovered these interaction dependencies.
Improvement of IDR&A process reduced delay to the client sign-off of Detailed Design and aiding the start of construction. The modelling activities and the use of the Multi-Dimensional Maturity Framework is being applied to the remaining processes on the project and we recommend the use of this framework across other large infrastructure contracts.
References
- K. Beck, M. Beedle, A. van Bennekum, A. Cockburn (2001) Manifesto for Agile Software Development.
- H. Leavitt, (1964). Applied Organization Change in Industry: structural, technical and human approaches. In W. Cooper, H. J. Leavitt & M. W. I. Shelly (Eds.), New Perspectives in Organization Research (pp. 55-71). New York: John Wiley.
- CMMI Product Team (2010) CMMI® for Development, Version 1.3. Software Engineering Institute.
- Sarah Gibbons (2018) Empathy Mapping: The first step in Design Thinking. Nielsen Norman Group.
- A. Finkelstein (1992) A Software Process Immaturity Model. SIGSOFT. Software Engineering Notes.
- Teo Yu Siang and Interaction Design Foundation (2021) Design Thinking
- James E. Kelley and Morgan R. Walker. (1959) Critical-path planning and scheduling. In Papers presented at the December 1-3, 1959, eastern joint IRE-AIEEACM computer conference (IRE-AIEE-ACM ’59 (Eastern)). Association for Computing Machinery, New York, NY, USA, 160–173.
- Aubrey C. Daniels (2007) Other People’s Habits. Performance Management Publications
Peer review
- Barry ConnollyHS2 Ltd