Test pile design, construction and testing – maximising the benefits of preliminary pile test results in pile design and construction at Euston Approaches
A 450m long retained excavation to a maximum depth of 18m close to sensitive 3rd party assets will be constructed to house future HS2 tracks north of Euston station. Approximately 1700 bored piles between 1.2 to 1.8m in diameter, with over 700 located beneath the base slab and founded primarily in the Thanet Sand Formation, were designed to resist both tensile axial heave and compressive over-site development (OSD) loads. This paper presents the design thinking behind the testing of two preliminary test piles, as a part of the verification of the contract pile design with lower factors of safety as permitted by Eurocode 7. The tests addressed project geotechnical risks and allowed an efficient design.
Collaborative discussions were carried out between design and construction teams, including the specialist piling contractor, to provide confidence from both design and construction viewpoints. The piling contractor’s preference for recent innovations such as polymer support fluid and distributed fibre optic sensing gave an opportunity to develop industry best practices. Clear communication channels between the parties responsible for analysis/design, management and testing and construction were maintained throughout the site works.
Built-in instrumentation with automated live data transfer proved critical for rapid analyses during the first test. The construction programme was configured to allow adjustments to the second pile test to be made based on the preliminary results of the first test. Final load- settlement results were comparable between the two preliminary test piles. An allowance of 56 hours for the pile bore open time was established and the removal of base grouting for contract piles was achieved. Overall, the pile testing programme at Euston demonstrated its effectiveness on multiple fronts: sustainability, construction programming, geotechnical risk management and design validation.
- Written by
-
Paul Bailie (SCS/Arup)

- Resource type
- Resource type: Technical Paper
- Intended audience
- Consultants
Introduction
A 450 metre long retained excavation to a maximum depth of 18 metres close to sensitive third-party assets is currently being constructed to house future HS2 tracks to the north of Euston station in the Euston Approaches area. This is being delivered by the SCS Integrated Project Team as a part of the Main Works Civils Contract (MWCC) for the southern section of High Speed Two (HS2) Phase One. The integrated and collaborative delivery process allowed for a representative from the design team (SCS Design House) to be co-located on site with main contractor (SCS JV) and specialist sub-contractor (Cementation Skanska).
This was effective in providing real time feedback and solutions to design requirements, programming requirements and construction constraints between all parties involved.
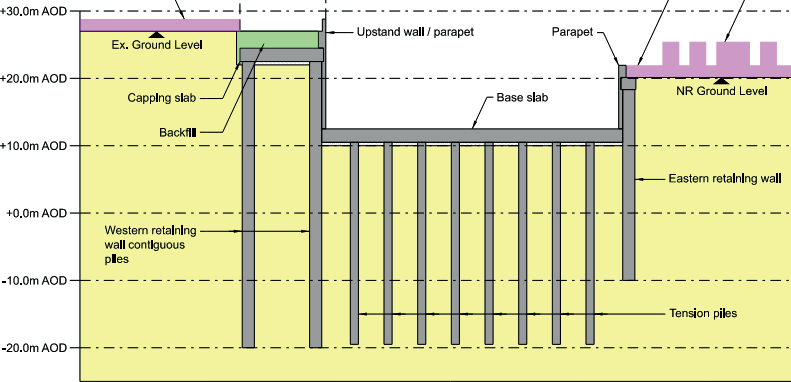
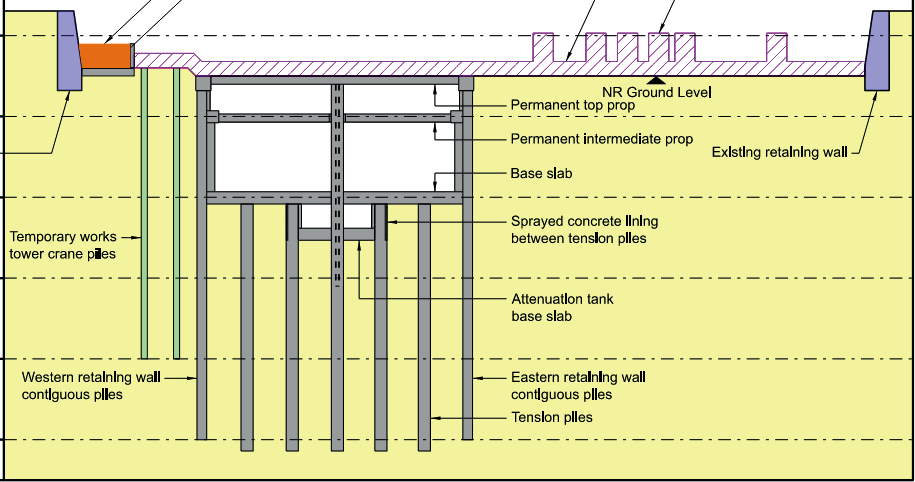
From south to north, the retaining structure transitions from a cantilever contiguous piled wall to one with permanent lateral support in the form of a semi-enclosed box structure. A piled slab foundation system sits below the high-speed rail tracks. This has been designed to resist both downwards compressive loads from future over-site development and upwards heave pressures resulting from the deep excavation in London Clay.
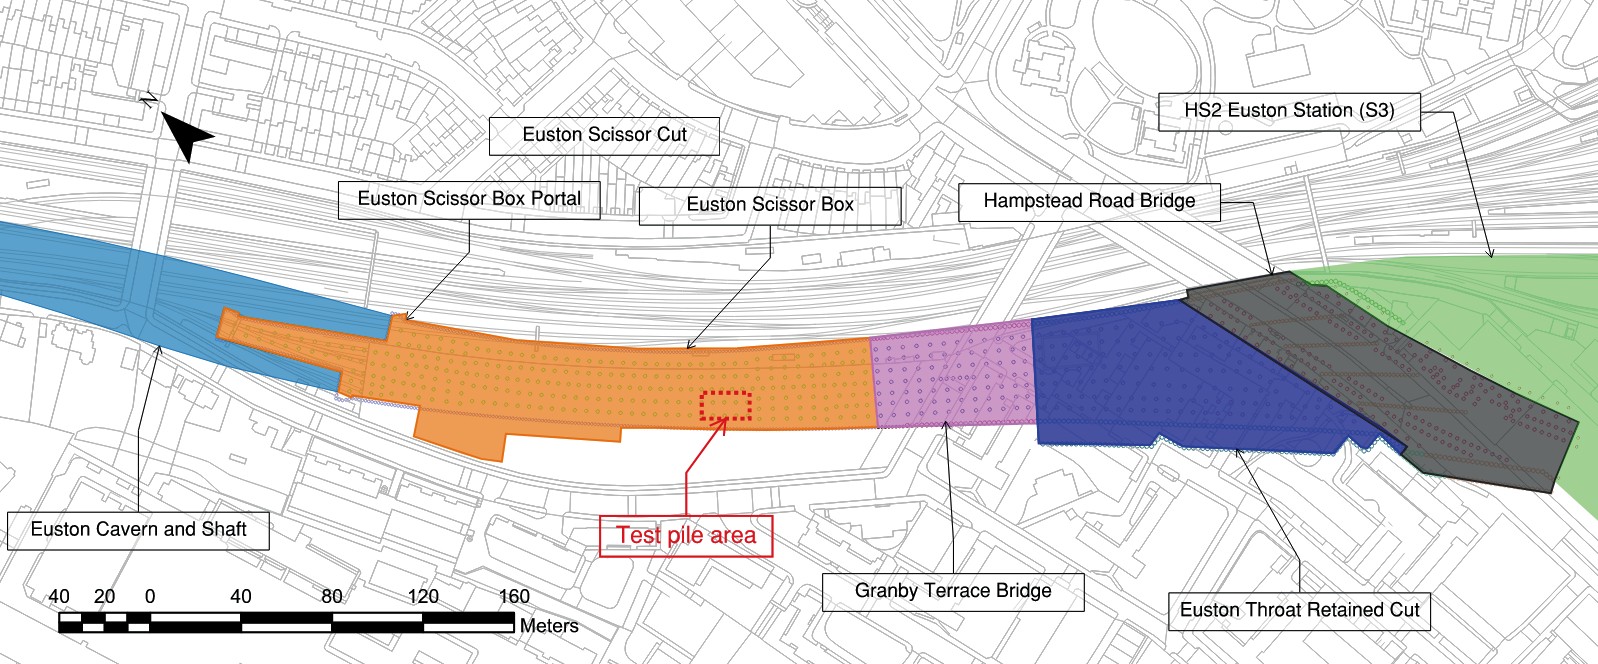
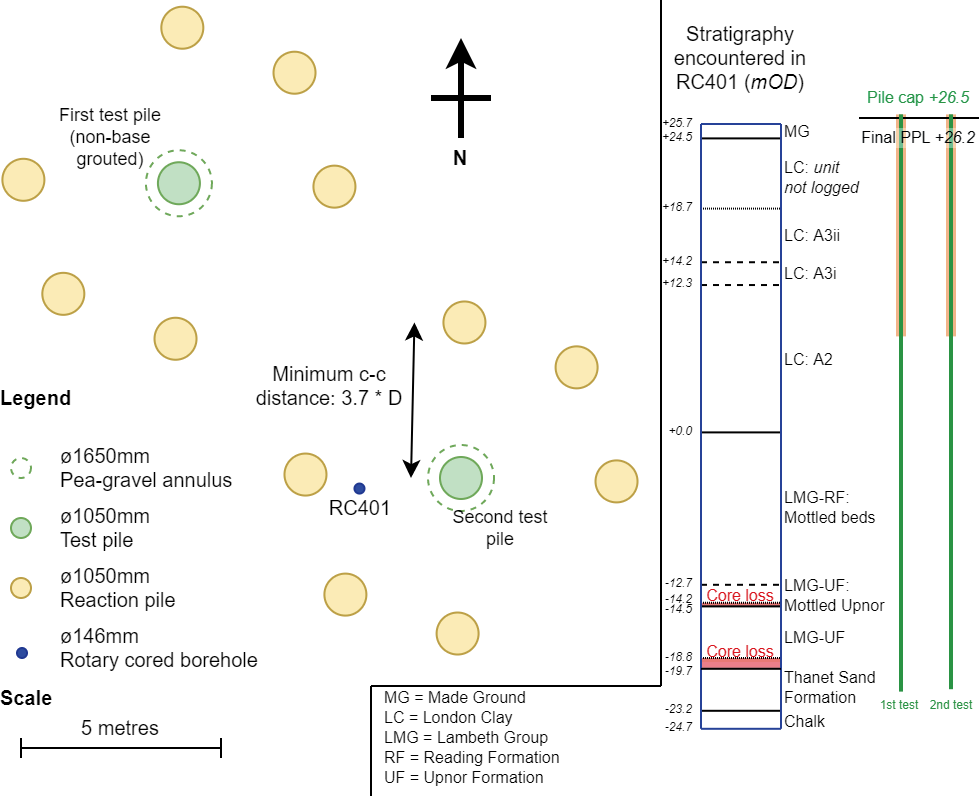
The category 3 structure [1] consists of approximately 1700 bored piles ranging from 1.2 to 1.8 metres in diameter. Over 700 are located beneath the base slab and founded primarily in the Thanet Sand Formation. Two maintained load preliminary pile tests were undertaken on representative piles, and their plan locations are show relative to the contract piling works in Figure 1. Representative structural sections at the Euston Throat Retained Cut (ETRC) and Euston Scissor Box (ESB) are shown in Figure 2. The preliminary pile tests, along with ongoing contract pile working load tests fulfil Eurocode 7 [1] and construction requirements and served to de-risk geotechnical uncertainties and to validate new piling related innovations and technologies, which were subsequently adopted in the main works piling. The use of test piles also eliminated the widely accepted “business-as-usual” but costly and time-consuming post-piling base grouting of compressively loaded Thanet Sand piles.
The piling works informed by these test piles also served as the first of many significant deep foundation structures constructed as a part of the HS2 Phase One southern section. This brought about the need for a compact design, a careful balancing of various means of design validation amidst a tight construction programme. Design validation activities were not an entirely linear process as these full-scale pile tests were conducted at a stage of the programme with site investigations ongoing.
2a)
2b)
Test pile design philosophy
Geotechnical uncertainties tackled by the preliminary test piles are heavily intertwined with the pile construction process. In addition to providing a more efficient pile design by utilising lower factors of safety (as permitted by the UK National Annex to Eurocode 7 [2]), uncertainties tackled by the test piles included:
- Soil parameters for the various strata underlying the site obtained from in-situ site investigation,
- Pile shaft and base resistance design parameters and limiting values given the specialist contractor’s proposed construction methodology and timescales for pile construction as constrained by site restrictions,
- Load-settlement assumptions for all pile types, and,
- Necessity of base-grouting and the minimisation of construction complexity.
The ramifications and outcomes achieved by the preliminary test pile programme are examined from both design and construction perspectives.
Additionally, a series of innovative construction technologies and processes proposed by the specialist piling contractor were validated by the preliminary piles. The documentation and validation provided by the tests were accepted by the client, main contractor and designer. These included:
- A site-specific base cleaning procedure for deep Thanet Sand piles,
- The use of polymer support fluid through clayey and sandy strata,
- Use of fibre-optic temperature measurements for pile thermal integrity profiling,
- Replacement of cross-hole sonic logging by thermal integrity profiling techniques,
- Use of fibre-optic strain measurements for pile load testing to build robustness for conventional strain monitoring, and,
- Use of a digital “PRAD” surveying tool for pile verticality. [3]
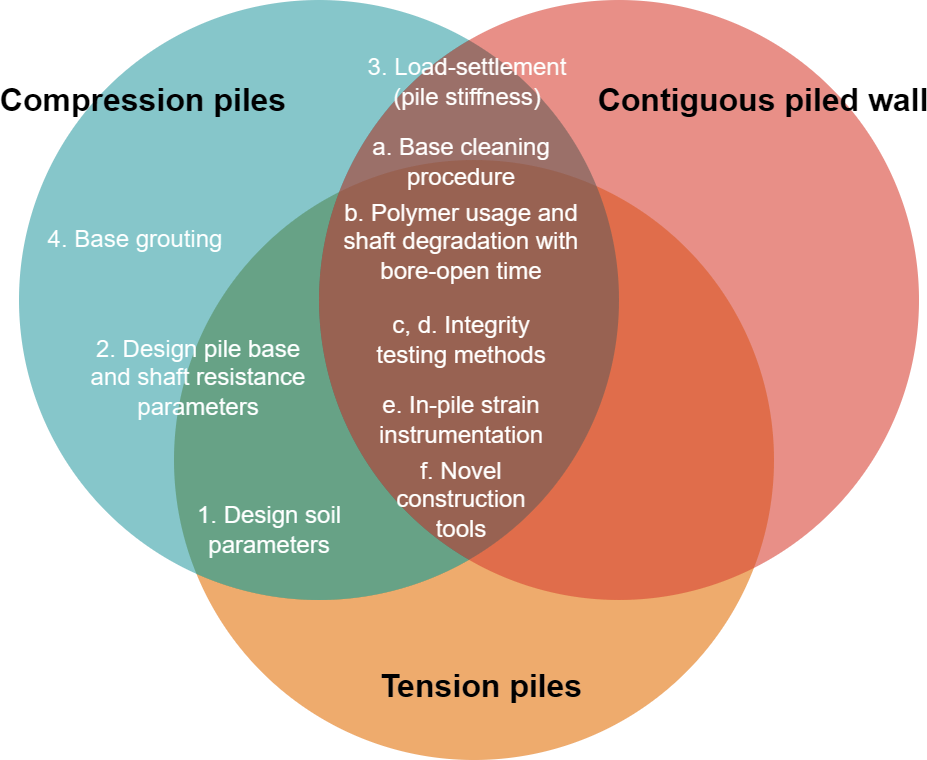
Figure 3 summarises the overlaps of the various elements and uncertainties tackled by the preliminary pile test programme.
Design soil parameters
The ground in the Euston Approaches area was geotechnically characterised by an extensive programme of multiple phases of ground investigation. These include in-situ standard penetration test (SPT) and pressuremeter testing; laboratory testing included triaxial tests, direct shear box tests, particle size distribution (PSD), moisture content and Atterberg limit tests, with vibrating wire piezometers also installed at frequent intervals.
Varying stratigraphy is encountered along the highlighted areas in Figure 1, with the ground (from South to North) rising from +27 mOD to +34 mOD outside of the existing West coast main line cutting, and approximately at +25 mOD in the existing cutting. The changes in soil strength, stiffness and the stratigraphic levels have been extensively scrutinised throughout the design process, as is typical in any code-compliant geotechnical design practice. A full description of this process is outside of the scope of this preliminary test pile paper.
Appropriate scaling and adjustments to pile test derived parameters (e.g. strata-specific skin friction) were made along the length of the cutting. This process examined the relative strengths, stiffnesses and in-situ stress states (related to existing and historical levels) as compared to those specifically found at the location of the test piles.
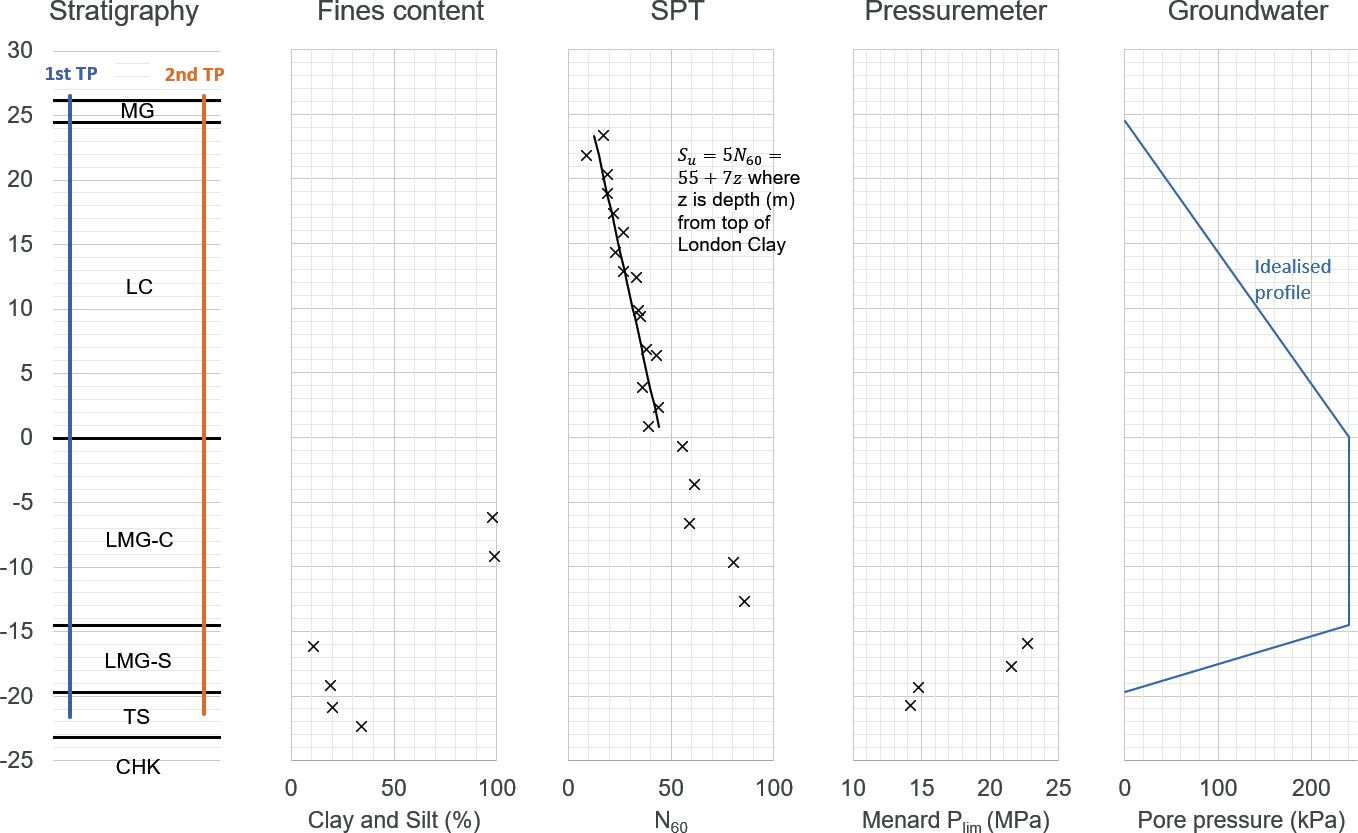
One rotary cored borehole (RC401) was specified and drilled at the location of the pile tests with in-situ SPT testing carried out over the full depth, and pressuremeter testing in the sandy strata in the Lambeth Group and Thanet Sand Formation. U100 samples were initially taken from the London Clay Formation and Lambeth Group Clay for undrained unconsolidated (UU) triaxial tests from RC401, although data have been omitted here as the sampling methodology could not be verified.
Figure 4 presents a summary of the stratigraphy, in-situ and laboratory test results, and assumed groundwater profile at the test pile location.
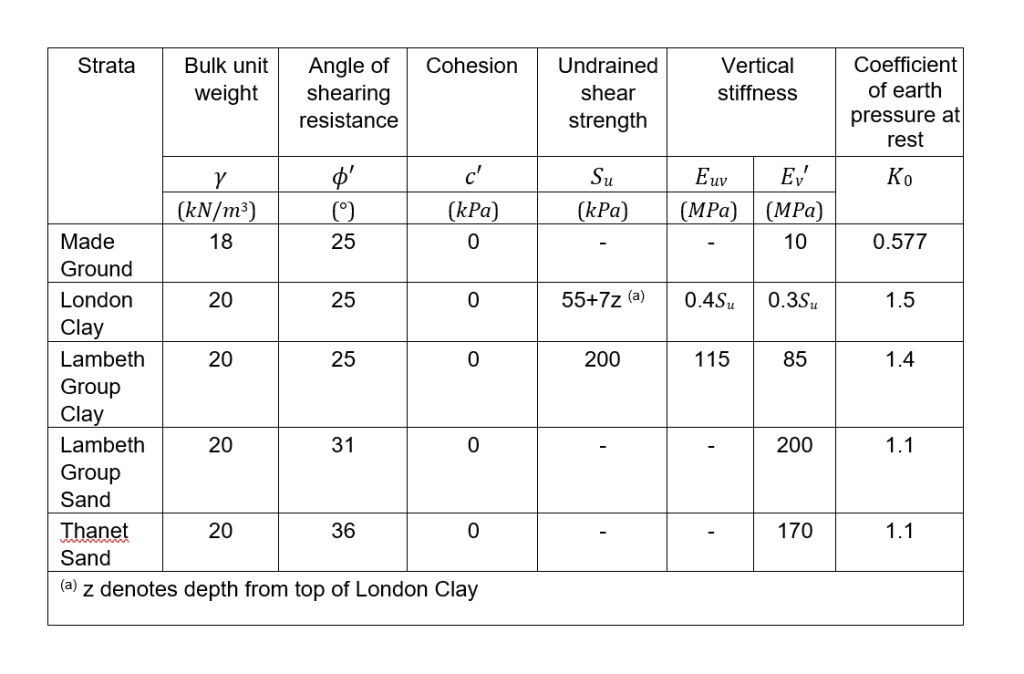
The design soil strength and stiffness parameters are presented in Table 1.
Design pile resistance parameters
As the test pile is constructed and loaded prior to bulk excavation and hence prior to any unloading, total stress friction parameters were used for clayey strata and effective stress parameters for sandy strata to calculate design shaft friction.
Characteristic unit area total stress shaft friction Qs,tot is:
(1)
Where:
ksα is the total adhesion factor allowing for use of support fluid and extended bore open time Su is the soil layer average undrained shear strength
Characteristic unit area effective stress shaft friction qs,eff, is:
(2)
Where:
a is a construction factor due to stress relief and disturbance during pile installation
K0 is the coefficient of earth pressure at rest
̅σv′ is the average vertical effective stress
δ is the soil/concrete interface friction angle (assumed δ = φ′)
Characteristic unit area base resistance is:
(3)
Where:
Nq is the bearing capacity factor determined from nearby case histories and correlations to results from in-situ pressuremeter tests (lower than classically proposed values [4])
σ′v is the vertical effective stress at pile base
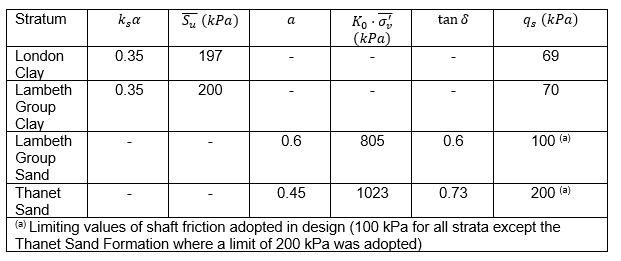
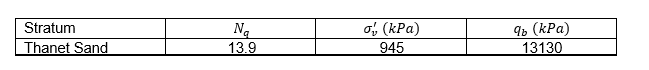
Parameters used to calculate shaft resistances and base resistance are presented in Table 2 and Table 3 respectively.
The verification of points 1 and 2 in the introduction to this section on test pile design philosophy (soil strength and pile-soil frictional/base resistance) are closely related and cannot be concurrently achieved. A pile load test can only validate one or the other, and as strength parameters have been obtained from a large database of in-situ and laboratory testing, the main validation provided by this test was the frictional and base resistance parameters adopted for contract pile design.
Load-settlement assumptions
Simple elastic perfectly plastic soil t-z curves were used in the pile serviceability design. The values of elastic stiffness adopted in the clay strata were determined from several consolidated isotropic and anisotropic undrained triaxial tests at a representative 0.1% axial strain. Values of elastic stiffness in the lower sandy strata were determined from correlations with in-situ testing.
An initial serviceability validation was provided by the pile test at pile head level and the derived average t-z curves using in-pile strain gauges. Further validation will be provided by ongoing working pile load tests.
Base grouting of bored piles founded in sand
Base grouting is the high-pressure injection of grout from pile head to pile base via U- shaped steel tube-a-manchette (TAM) with rubber-sleeved perforations at its base. The tubes are typically connected to the reinforcement cages cast into the concrete pile. This technique is widely used for piles founded in the Thanet Sand Formation in London [5], [6]. The purpose of base grouting is to counteract “soft toes” created due to excessive disturbance of the granular pile base stratum from drilling under polymer support fluid. Although recent case histories of similar Thanet Sand pile tests in central London have also utilised base grouting [7], [8], [9], it has been suggested that a good control over polymer fluid properties and base cleaning procedures can provide good base hardness test results [10] and can eliminate the need for base grouting [11], [12], [13]. A direct like-for-like comparison between two Thanet Sand test piles, one with and one without base grouting at the same site has not been reported previously. The original intention at this site was to carry out such a comparison to validate the elimination of base grouting.
Base grouting as a procedure brings added construction health and safety, sustainability, and programme risks. These include:
- Manual connection of steel tubes within hanging reinforcement cages
- Conformance to a maximum TAM distance from base leading to on-site changes to reinforcement cages if pile is over-bored
- Unsuccessful hydro-fracture of TAMs post-concrete cast and pre-grouting
- Base grouting non-conformances due to stringent pile uplift requirements
- Use of additional cementitious material
- Additional programme, logistics and space constraints due to complex grouting procedure, with a minimum addition of 3 days per pile (2 for concrete setting, 1 for grouting)
- Additional steel tubes to be broken down on bulk excavation
The potential to eliminate base grouting was raised early on by the specialist piling contractor and was adopted into the test pile specification and programme. Several construction savings and allowances were made possible, including:
- The elimination of base grouting, and
- An extension to the allowable bore open time to 56 hours (time between open bore exposed to polymer support fluid and concrete in bore).
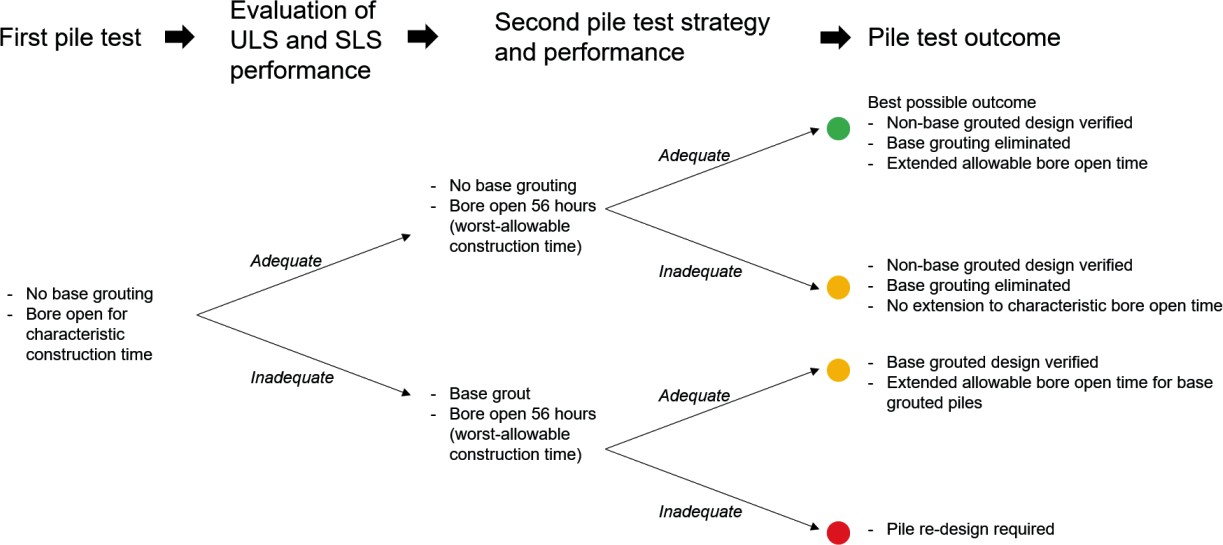
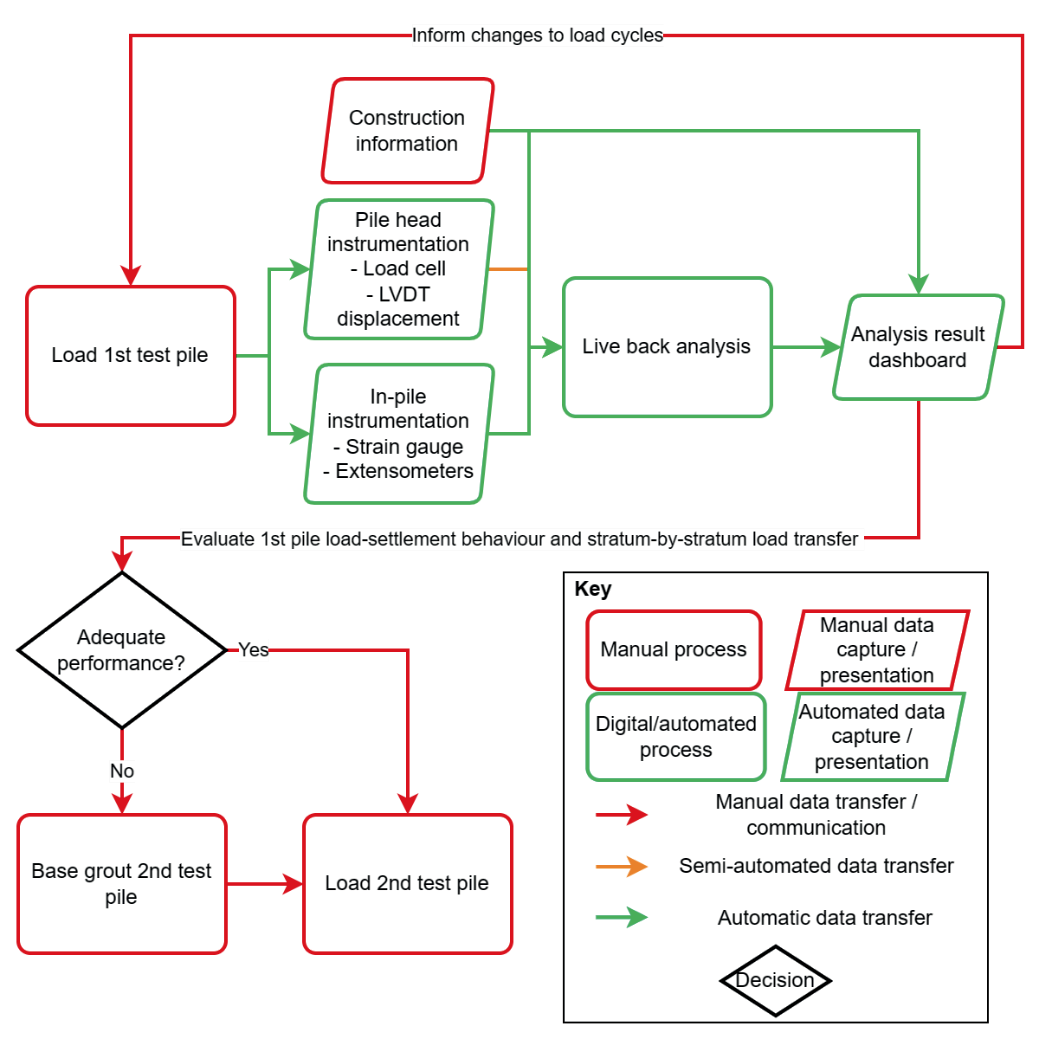
The flexible construction programme relied on this decision tree:
- Construct test and reaction piles sequentially such that a non-grouted first test pile can be load tested before the second test pile (constructed complete with TAMs) is hydro-fractured, grouted and tested
- If,
the real-time analysis of the non-grouted first test pile verified both the single pile serviceability and ultimate limit states, then
- the second test pile is to be tested without base grouting to validate construction repeatability
Else,
- the second test pile shall be base grouted and tested
The decision tree and possible outcomes can be visualised in Figure 5.
Test pile details
The two 1050mm diameter preliminary test piles differed slightly in their construction details to accommodate the multiple verification requirements detailed above. Differences in the geotechnical capacity of the 1st and 2nd test piles are likely affected by the following:
- Bore open time (27 vs 56 hours)
- Pre-concreting base hardness (Grade 2 vs Grade 2/3) [10]
- Slight variation in pile toe level (-21.6mOD vs -21.4mOD)
A plan of their relative location with the RC401 borehole is shown in Figure 6.
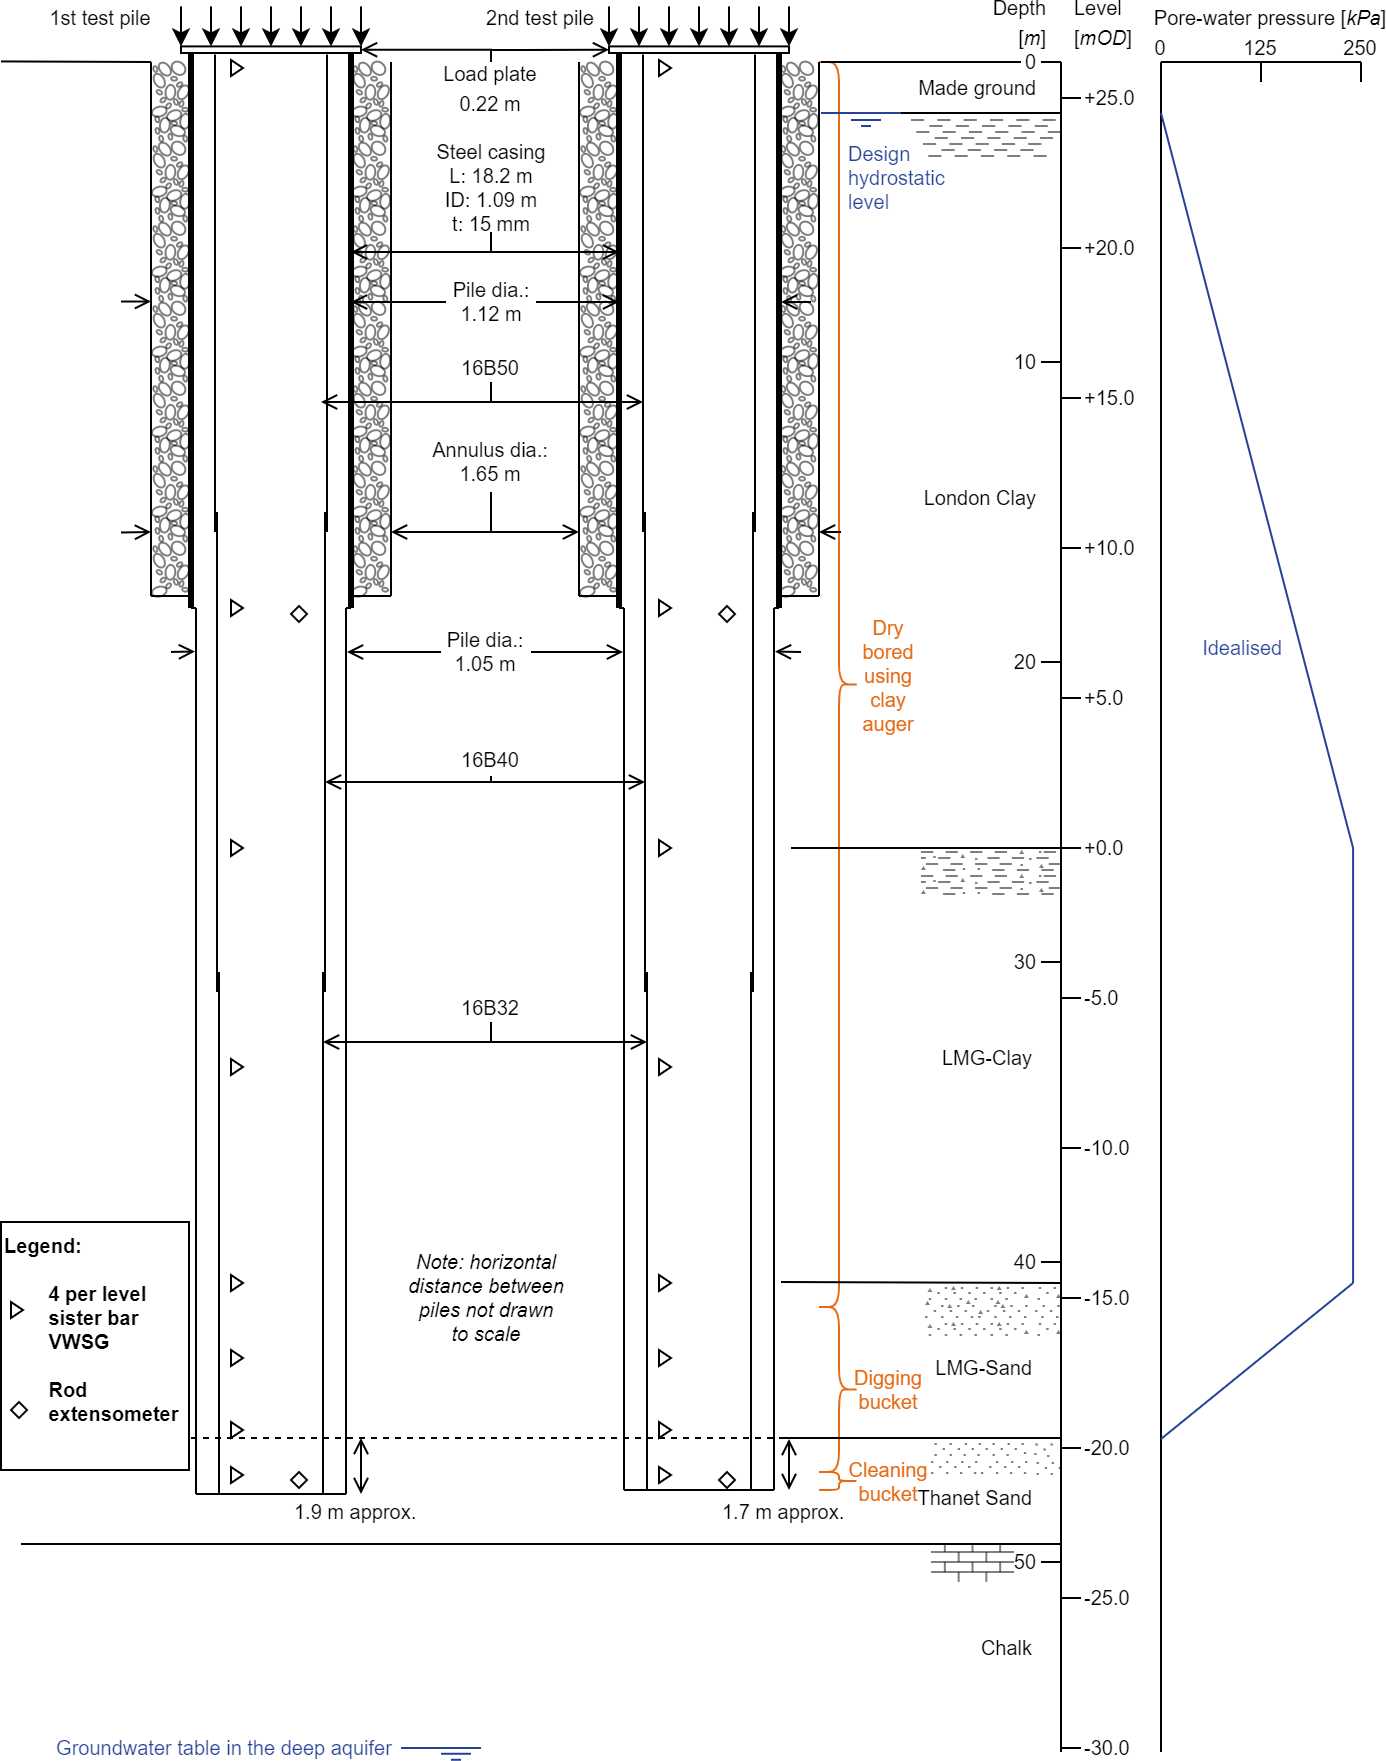
Both test piles were loaded from +26.5mOD with the piling platform level built to +26.2mOD. An 18m length steel casing extended down to future formation level at +8mOD. This sleeved section was designed to be isolated from the ground by a pea gravel filled, 220mm thick annulus. This annulus was formed by over-boring a clay shaft over the sleeved length and installing the sacrificial 15mm thick steel casing centrally within the enlarged bore (steel area 0.0521m2). No external outer lining was left in place and the pea gravel fill was in direct contact with the enlarged open clay bore. The axial steel reinforcement was installed in three sections spliced together with decreasing bar sizes from top to base (16B50 to 40 to 32mm, i.e. steel areas from 0.0314 to 0.0201 to 0.0129m2). The cast-in-place base grouting tubes in the second test pile provided an additional 0.0041m2 cross-sectional steel area throughout its length.
Concrete used for both piles was a self-compacting mix with slump-flow target of 500mm. The test pile average 28-day cube strengths were 74.4 and 83.8N/mm2 respectively for the test piles, both well above the design C50/60 strength.
At full depth the verticalities of both test piles were measured to be within 1:200. It is noted that for all verticality measurements the automated PRAD [3] system gave a more onerous reading than the traditional “spinning disc” surveying technique (“spinning disc” measurements taken within depth of dry bore only prior to polymer addition).
For strain measurements within the pile structure, both piles were instrumented with 8 levels of vibrating wire sister bar strain gauges (Geokon, type 4911) and two loops of distributed fibre optic strain sensing cables (Solifos AG).
Full details of the geometry and dimensions are also shown visually in Figure 7.
Integrity testing comparisons
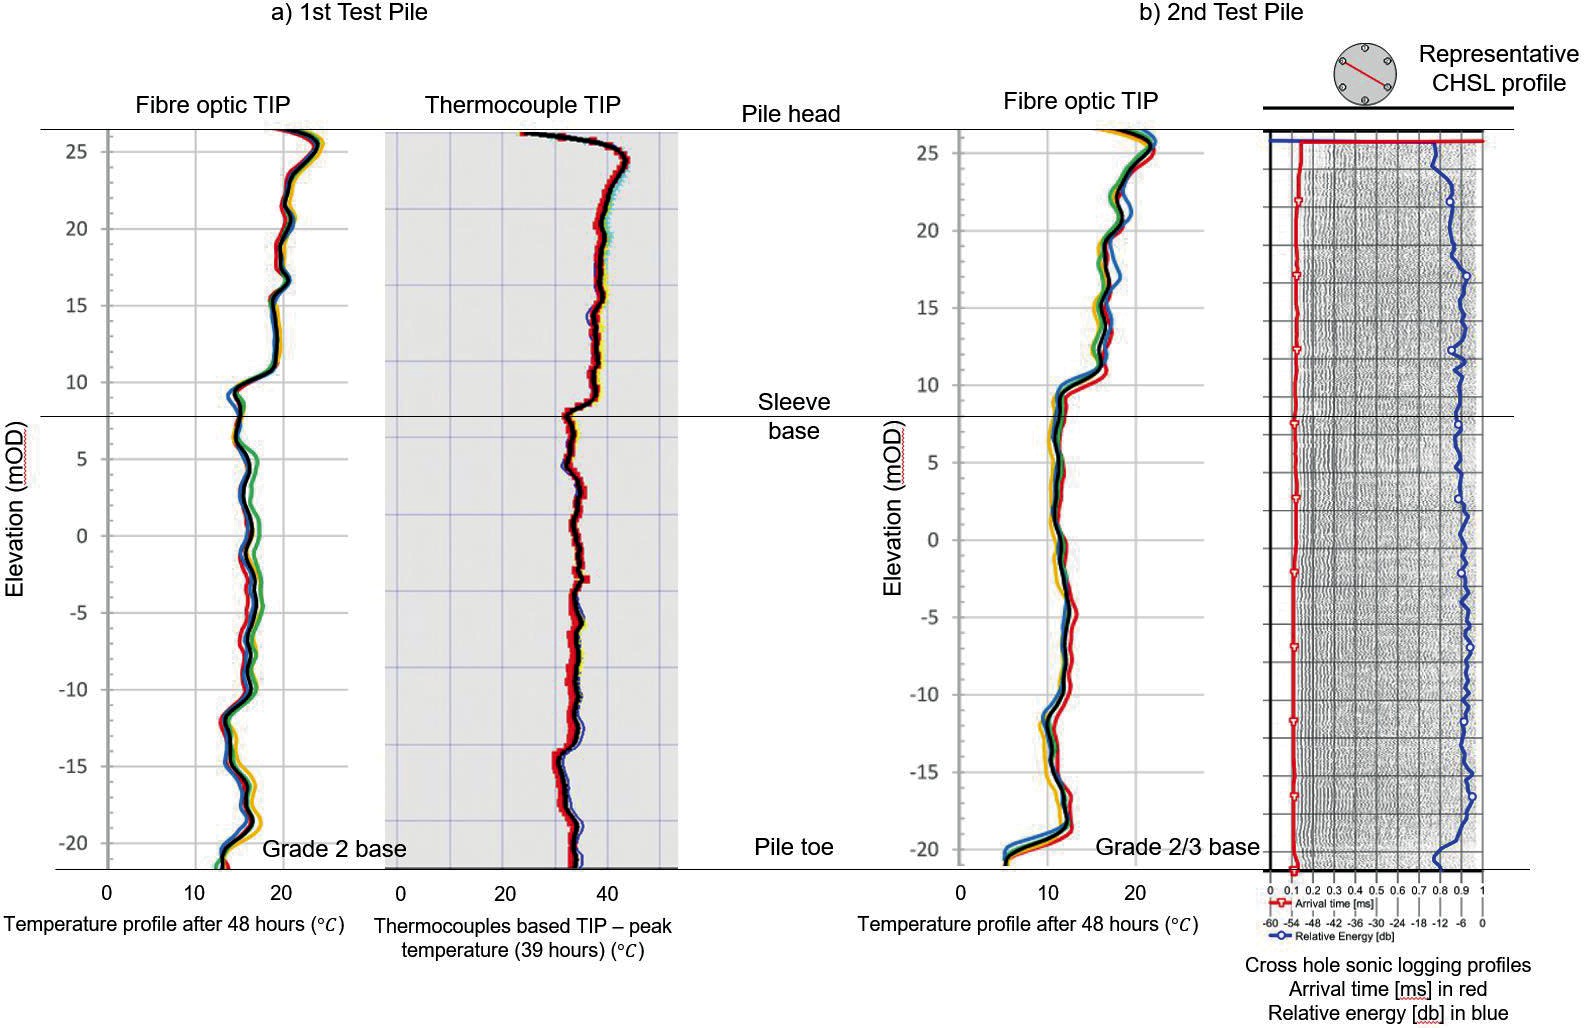
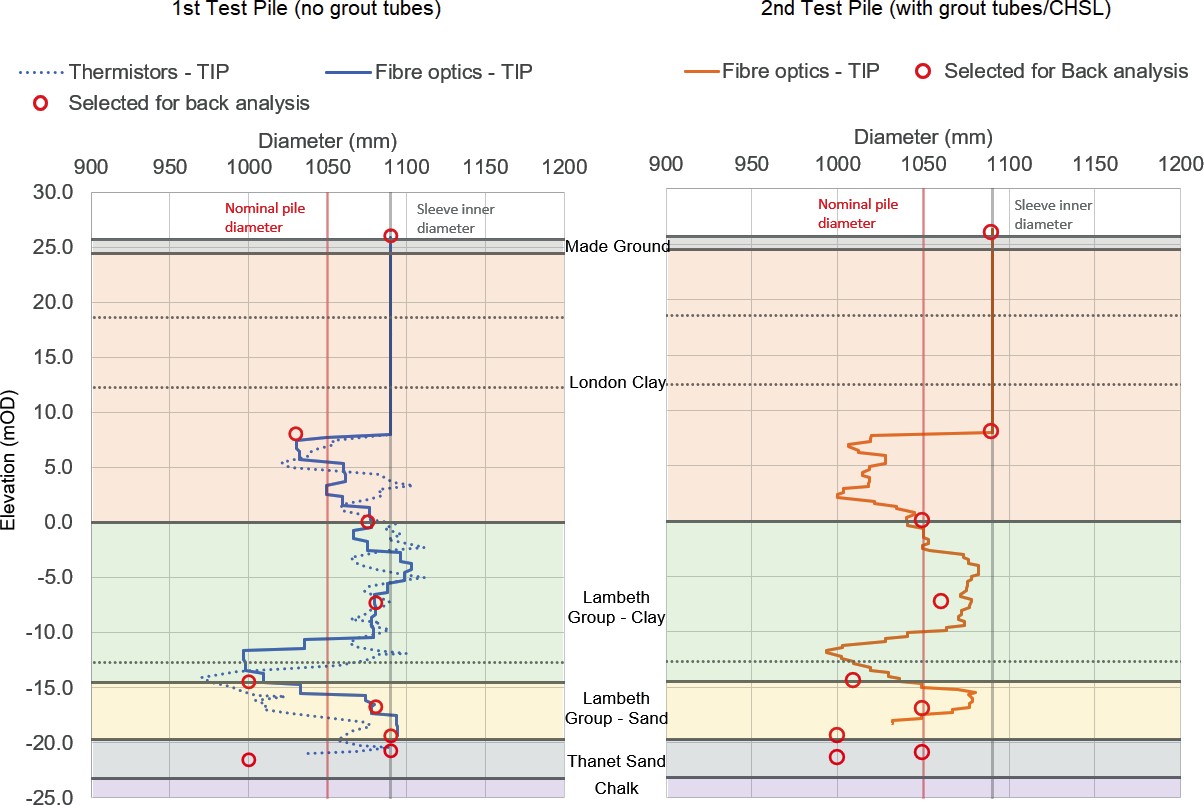
Early engagement by the main contractor recognised the preferences of different deep foundation specialist contractors for various integrity test methods and instrumentation. Thermal integrity profiling (TIP) in particular has an obvious health and safety benefit compared to the more conventional cross-hole sonic logging (CHSL) technique, as no hands-in-cage manual connection of steel tubes during cage splicing is required. To bridge the gap in experience between various interested parties and the quality of results from each type, cross-comparison between all types was specified in the preliminary pile test programme. The first test pile was instrumented with four discrete sets of thermocouples at 300mm spacing and two continuous loops of fibre optic temperature sensing cables, whereas the base grouting tubes of the second test pile, though ultimately not used for the purpose of base grouting, also served as cross-hole sonic logging (CHSL) tubes. This pile also included two continuous loops of fibre optic temperature sensing cables.
All integrity test methods corroborated with each other and showed no defects in the piles as shown in Figure 8. The two thermal integrity testing methods gave a good match allowing for a systematic assessment criterion to be developed and applied for piles built in different ground conditions on other S1 contract sites. It is noted that the cross-hole sonic logging and thermal integrity profiling comparison in the second test pile also provided a qualitative description of the pile base concrete. A greater tail-off in the thermal integrity profile was postulated to be a result of greater disturbance during boring, which correlates with the lower base hardness score on the second pile.
The continuous temperature measurement provided by the fibre optic cables also provided an assessment of the possible variation in pile diameter with depth (Figure 9). In turn, this informed the assumed pile cross-sectional areas used in the calculation of load from strain readings in the back analysis of the test piles.
Load test result
Load-settlement response at pile head
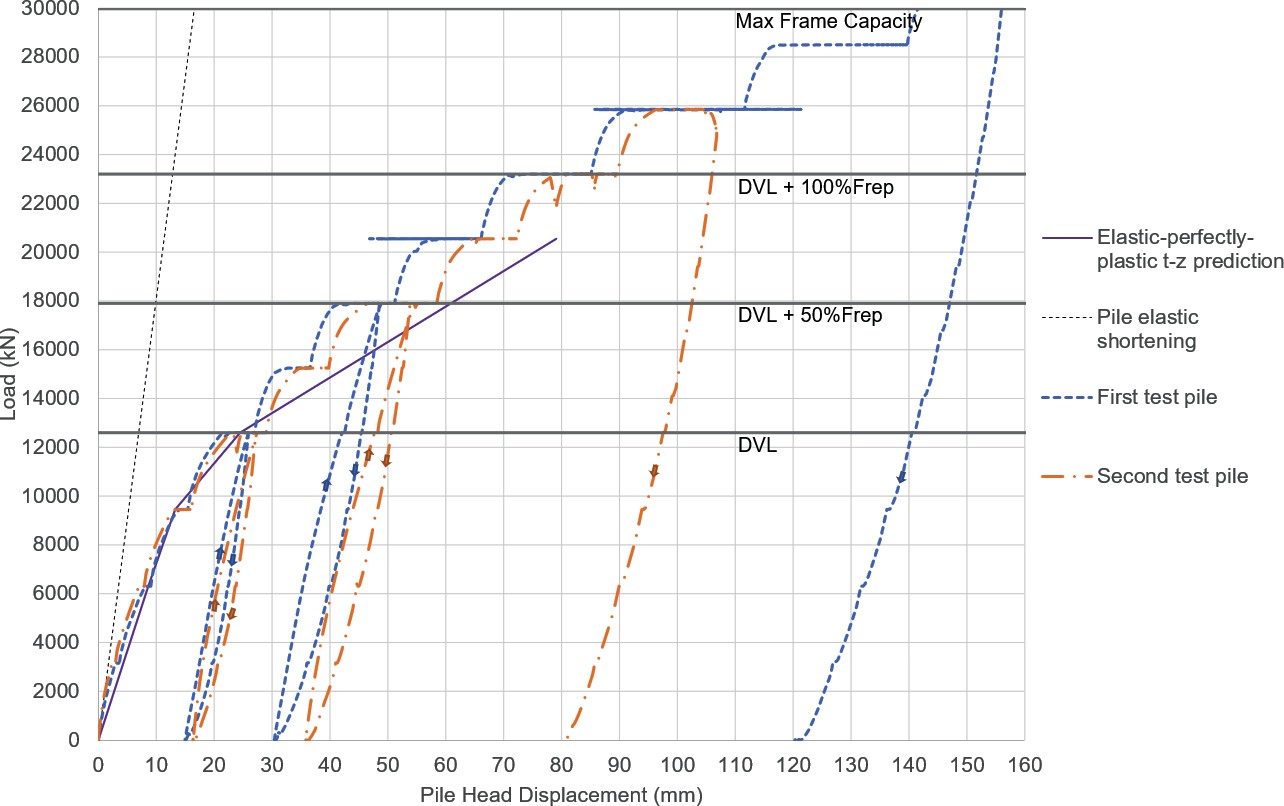
Three maintained load-unload cycles (Figure 10) were used for both test piles with some modifications to the ICE SPERWall standard load cycles [10]. At working load, or design verification load (DVL), the load-settlement response for both piles matched well with the elastic perfectly plastic t-z estimation, validating their serviceability design. Both piles also achieved loads exceeding the design characteristic pile resistance at less than 10% pile head settlement without an allowance for elastic shortening. Hyperbolic extrapolation methods for pile ultimate capacity produced overly unconservative estimates of characteristic pile resistance and were not relied on. Instead, the back analysed characteristic shaft and base capacities for each stratum were used to assess the ultimate performance of the piles as presented below.
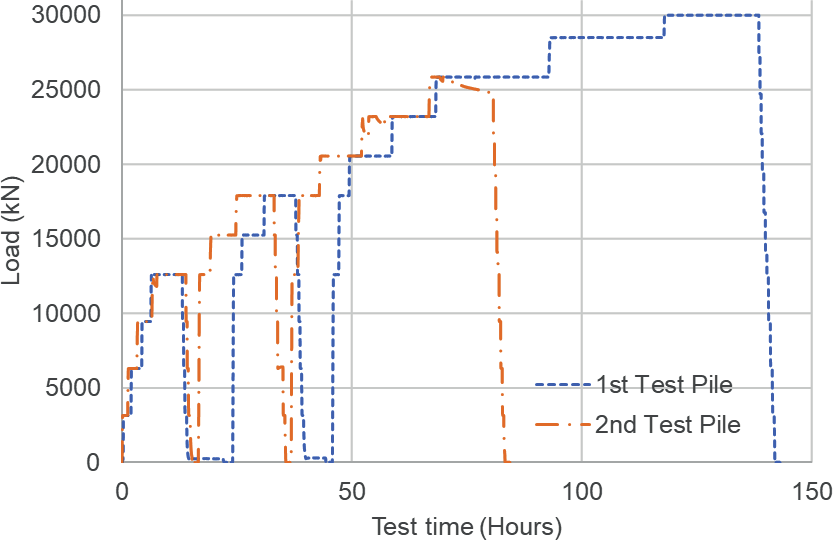
Figure 11 plots the load settlement response at pile head for both piles. Although both are shown on the same graph, the real-time analysis enabled by automated data links and calculation processes made the decision tree presented in Figure 5 possible.
Real-time back analysis
Two different specialist contractors provided the pile head and in-pile instrumentation systems, requiring two separate data streams to be combined to enable a live back analysis. The collaboration enabled by co-located working on site between the main contractor, designer and specialist piling contractor enabled efficient information sharing and mutual learning across multiple disciplines during the works.
Detailed descriptions and observations made during the construction was collected by both the specialist piling contractor, main contractor and the permanent works designer. The corroboration of recorded information from multiple sources was critical in untangling data from the pile instrumentation and corresponding load test response.
Additionally, the early engagement with the testing house and specialist contractor allowed for the sharing of data formats and testing of python scripts to interact with application programming interfaces (APIs) and manipulate data prior to the load test. Data collected on site during the construction process was then combined with live load test data and fed into an automated live back analysis spreadsheet. Analysis results were then linked with an automatically updated PowerBI data dashboard for visual presentation. This greatly aided the decision-making process although manual hand calculations still served as a check of the analysis and novel digital workflow. Figure 12 summaries these data linkages highlighting both automated and manual processes.
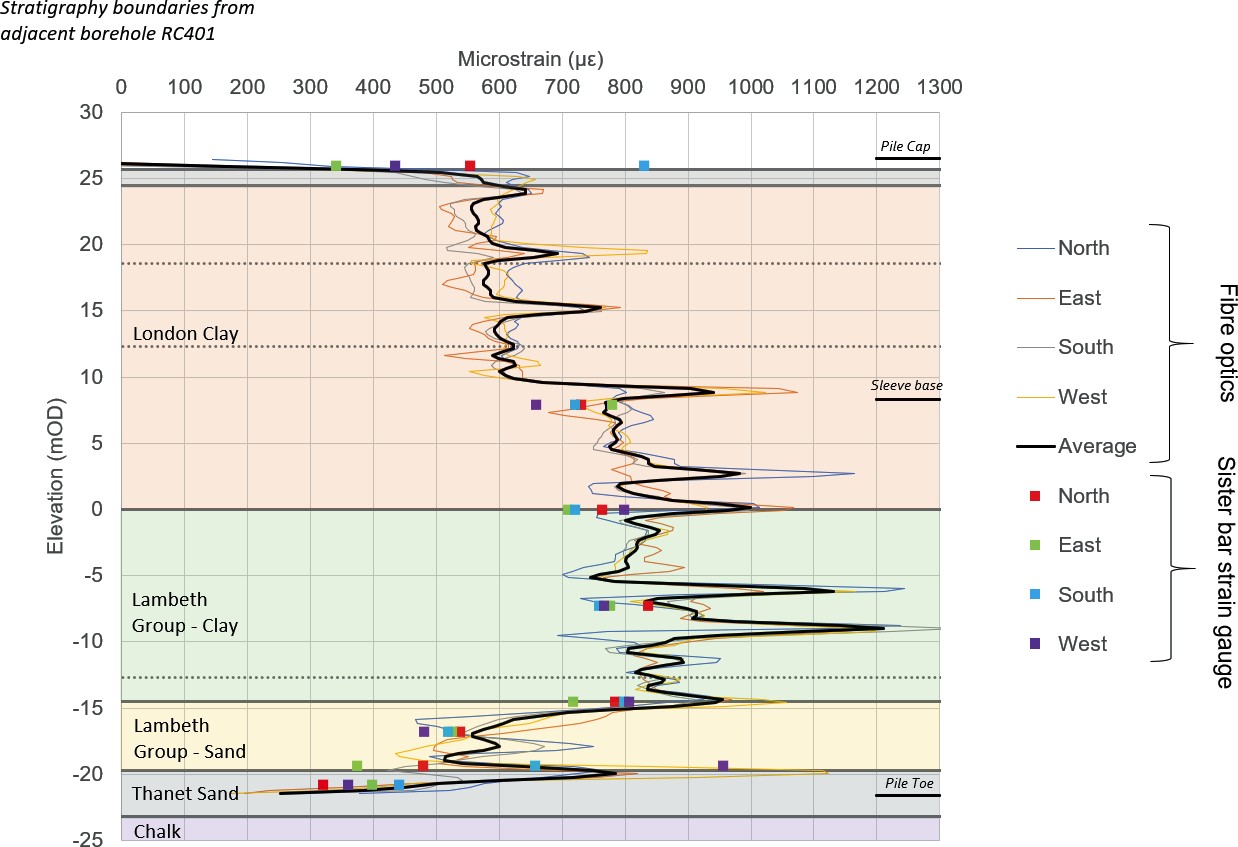
Independent strain measurements
To assess pile load transfer with depth, the usage of two independent sets of in-pile strain instrumentation added robustness to the test results. Figure 13 illustrates an example of a good match between fibre optic measured strains and sister bar strain measurements at maximum maintained load for the first test pile. Both sets were necessary for the interpretation – the discrete sister bar strain gauges anchored strain results at the pile head (for pile modulus determination) and at each change in stratum, whilst the continuous fibre optic strains filled in gaps in readings and were essential in identifying and selecting out erroneous sister bar gauge readings.
Although the detailed pile test analysis is not presented herein, it is the authors’ intention to publish the detailed analyses with further implications on the strain to load interpretation process. The interpretation of the second pile test has also been previously examined by the first author [14]. By using the transformed area secant pile modulus method and concrete creep strain adjustments [15], it was concluded that creep adjustment was needed to properly assess the per-stratum behaviour but had an overall negligible effect on total pile performance.
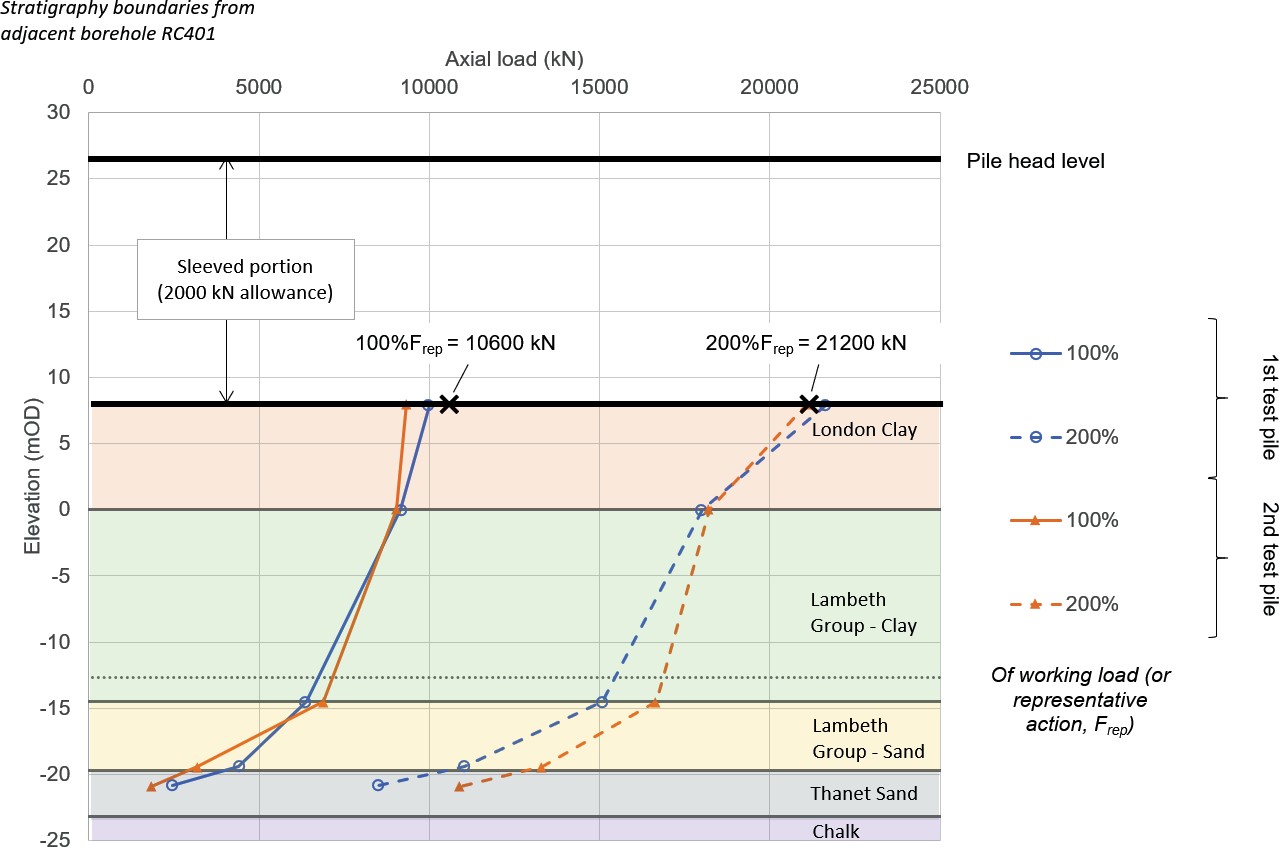
The load reduction curves at approximately 100% and 200% representative action (at sleeve base) as assessed immediately after each pile load test are presented in Figure 14. Note that an allowance of 2000kN (approximately 30kPa) was made for the low-friction sleeved portion of the pile.
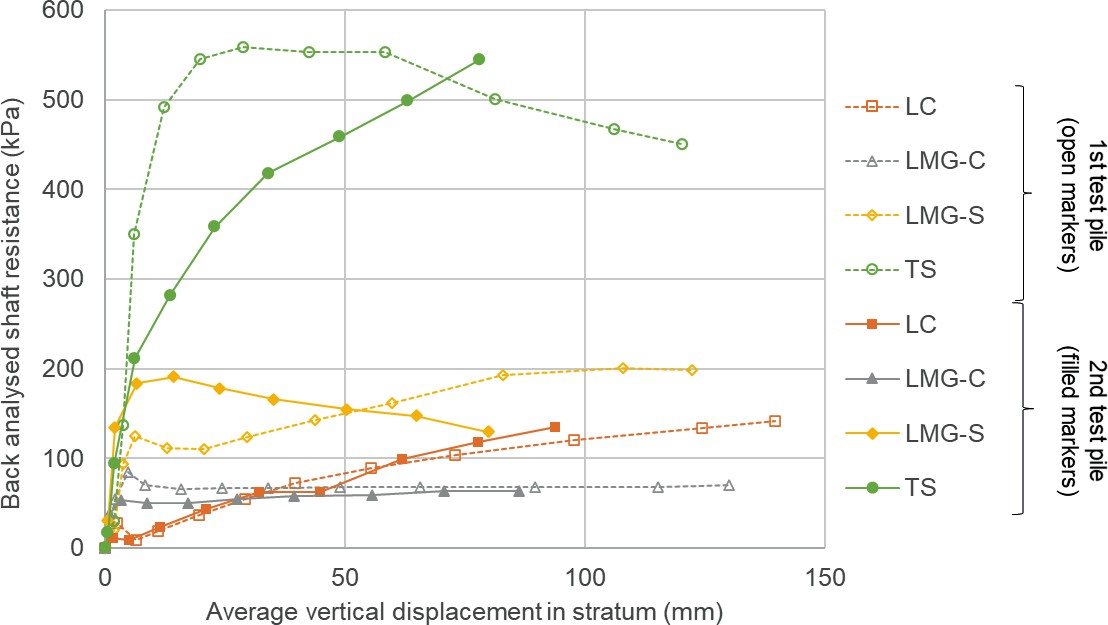
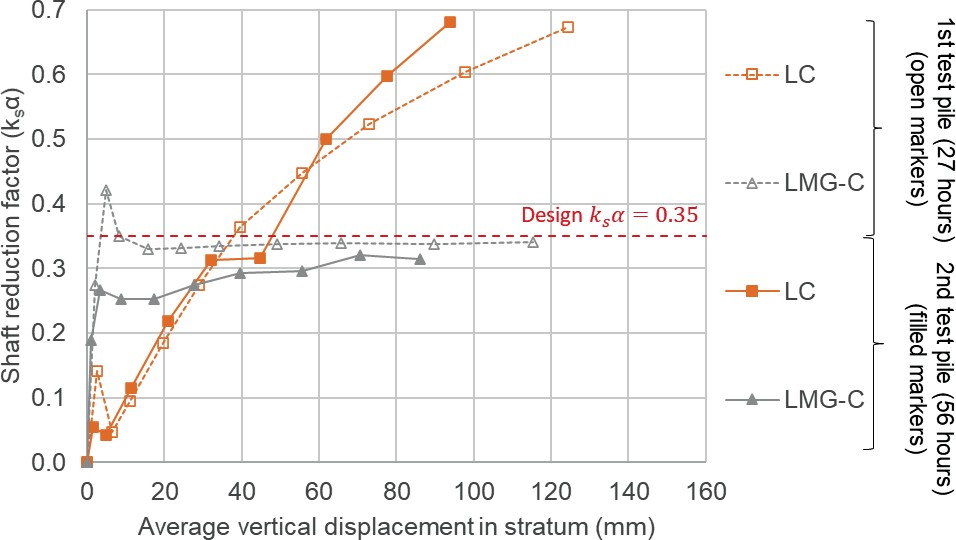
Then, the mobilised values of shaft resistance in each stratum were separated and compared against design characteristic and limiting values. Again, although results from both tests are presented on the same graph, the real-time decision depended on the earlier test to inform the second test. Figure 15 shows that the design limiting values for both sand strata were exceeded, whereas for the clay strata the design values were matched or exceeded. Figure 16 provides further evidence on the negligible effect on the cohesive shaft adhesion factor by extending bore open time (under support fluid) to 56 hours.
Correspondingly, the back analysed base resistance factor exceeded the design value at the highest load for both test piles (Figure 17).
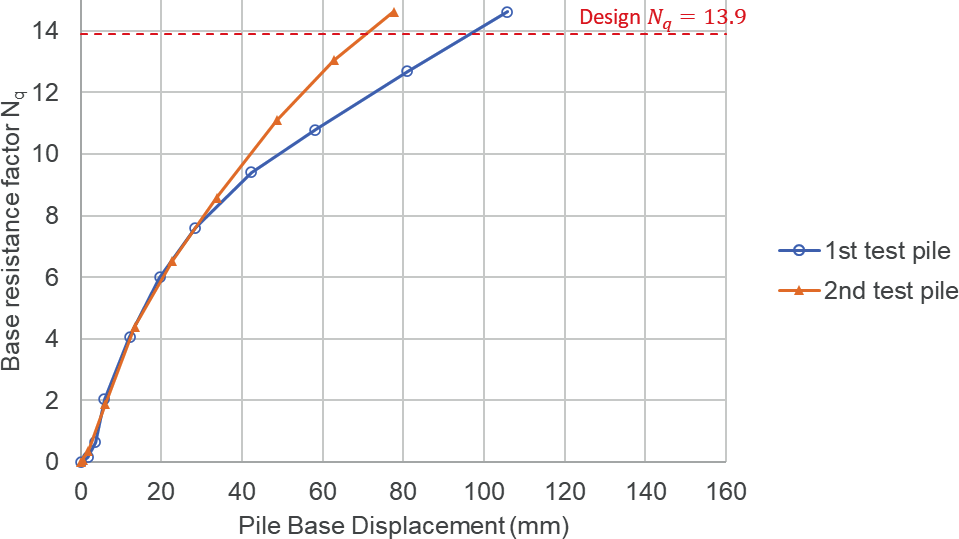
With reference to the pile head load-settlement curve (Figure 11), the second test pile showed a slightly softer response at higher load increments. This matches well with observations made during construction of the two test piles; the lower base hardness score and longer exposure to polymer support fluid for the second pile provides a reasonable qualitative explanation. The softer shaft response in the second test pile may also have contributed to the earlier mobilisation of base resistance at lower values of displacement in Figure 17, however a more thorough quantitative analysis is beyond the scope of this paper.
In summary, the real time back analysis presented here was a key enabler of realising the complex preliminary pile testing programme.
Key outcomes and conclusion
Technically, the verification of key design parameters was an essential outcome of the two test piles presented. Challenges were indeed encountered in the interpretation process, such as uncertainties brought about by a complex interaction in the steel sleeve-gravel fill- clay bore sleeving arrangement though a further exploration is beyond the current scope. A preliminary recommendation would be for such construction complexities to be eliminated where possible. For this specific test pile set-up, a fully isolated sleeving arrangement constructed by leaving the outer casing in-situ would have greatly benefitted the analysis.
Nonetheless, the main SLS and ULS verifications remain valid by inspecting the load settlement behaviour for both test piles. By considering uncertainties in the interpretation, such as possible negative skin friction provided by the sleeving arrangement, limiting values of shaft friction were chosen to remain at the original moderately conservative values rather than upgraded to the maximum back analysed values.
An investigative approach to the design of the pile testing programme resulted in a conscious decision to set up one base-grouted and one non-base-grouted pile. The initial preference to compare the difference in performance between the two pile types was balanced against an opportunity for project efficiency, by comparing open-bore time and to test the piles’ constructability and timing. This was the beneficial result of early engagement of the specialist contractor and the integrated multi-stakeholder design process.
By deliberately testing non-base grouted first, and real-time assessment of its tested performance, the team activated the opportunity to not base grout the second test pile. The second load test then provided a quantifiable effect of the constructability parameters (e.g. open bore time) on pile load-settlement and interface friction. One additional unplanned benefit of this aspect of the testing is its use in informing non-conformance remediation for shaft friction reduction at other S1/S2 geotechnical sites encountering similar geology.
Further gains were achieved by the comprehensive nature of the preliminary pile test programme. The limited reduction in shaft adhesion with increased time exposed to polymer support fluid provides further evidence to support its greater adoption. From a construction programming perspective, this project benefitted greatly from the extended 56 hours bore open time under polymer support fluid, as enabled by the pile tests. Further publication of field-scale case studies at longer bore open times (e.g. 72 hours) in both clayey and sandy strata would serve the industry positively. Novel instrumentation including a digital pile verticality surveying tool as well as distributed fibre optic temperature and strain sensing proved their worth.
Geotechnical de-risking can be undertaken by a systematic and integrated programme of in- situ investigation, laboratory testing and field-scale testing. Through careful planning of a digitally enabled preliminary pile test programme, a complex list of geotechnical risks and uncertainties were successfully tackled by two preliminary piles at Euston Approaches.
These pile tests enabled efficiencies from three perspectives: construction programme, technical design, and material reduction. Both major desired outcomes were successfully achieved: to eliminate base grouting and to verify an extended bore open time given the contractor’s proposed piling methodology.
References
- CEN. (2004) Eurocode 7: Geotechnical design – Part 1: General rules EN 1997- 1:2004+A1:2013 Brussels, Belgium, European Committee for Standardization (CEN).
- BSi. (2007) UK National Annex to Eurocode 7: Geotechnical design – Part 1: General rules NA+A1:2014 to BS EN 1997-1:2004+A1:2013 Incorporating Corrigendum No. 1 London, British Standards Institution (BSi).
- Jean Lutz. Sensors for measuring the deviation of piles [Accessed 2022-01-04].
- Berezantzev, V. G., Khristoforov, V. & Golubkov, V. (1961) Load Bearing Capacity and Deformation of Piled Foundations. 5th International Conference on Soil Mechanics and Foundation Engineering. Paris, Dunod. pp.11-15.
- Chapman, T. J. P., Connolly, M. L., Nicholson, D. P., Raison, C. A. & Yeow, H. C. (1999) Advances in understanding of base grouted pile performance in very dense sand. Tunnel construction & piling 99 : international symposium & exhibition. 8-10 Sep 1999, London, London Brintex Ltd. pp.57-69.
- Troughton, V. M. (1992) The design and performance of foundations for the Canary Wharf development in London Docklands. Géotechnique. 42 (3), 381-393.
- Yeow, H. C., Nicholson, D., Morrison, P., Coupland, J. & Kassir, M. (2006) Moorhouse, London – Designing for Future Crossrail. DFI Magazine: Deep Foundations. NJ, USA, Deep Foundations Institute. pp.5-10.
- Beadman, D., Pennington, M. & Sharratt, M. (2012) Pile test at the Shard London Bridge. Ground Engineering. January 24-29.
- Patel, D., Glover, S., Chew, J. & Austin, J. (2015) The Pinnacle – design and construction of large diameter deep base grouted piles in London. Ground Engineering. November 24-31.
- ICE. (2016) SPERWall Third Edition. Specification for Piling and Embedded Retaining Walls 2016. 3rd edition. London, ICE Publishing.
- Suckling, T. P. & Eager, D. C. (2001) Non-base grouted piled foundations in Thanet Sand for a project in East India Dock, London. Underground Construction Symposium. Papers presented at the Underground Construction 2001 Symposium. London, Institution of Mining and Metallurgy.
- Lam, C., Jefferis, S. A., Suckling, T. P. & Troughton, V. M. (2015) Effects of polymer and bentonite support fluids on the performance of bored piles. Soils and Foundations. 55 (6), 1487-1500.
- Hardy, S., Nicholson, D., Srisakthivel, S., Olivier, L. & Disley, T. (2019) Preliminary test pile result for the Southbank Place development. Ground Engineering. December 26-33.
- Tantivangphaisal, P. (2021) Interpretation of strain gauge data from an instrumented bored cast-in-place test pile in London [Master’s Thesis]. Imperial College London.
- Lam, C. & Jefferis, S. A. (2011) Critical assessment of pile modulus determination methods. Canadian Geotechnical Journal. 48 (10), 1433-1448.
Peer review
- Pete BojczukHS2 Ltd
- Adrian StJohn1EKFB