The use of measuring-while-drilling to aid investigation of Mercia Mudstone and other weak rocks
The investigation and accurate characterisation of weak rocks can be extremely challenging when fracturing and weathering creates difficulties in sampling and testing from boreholes. One such material is the Mercia Mudstone Group (MMG) that is prevalent along parts of the northern section of High Speed 2 Phase One route.
Investigation into the strength and potential voiding of the MMG has been carried out by undertaking Measuring-While-Drilling (MWD) within boreholes at the Bromford Tunnel, part of the spur into Birmingham. MWD involves the recording of drilling parameters during drill advance such as rate of penetration, rotation speed, thrust/weight on bit/crown, holdback, torque and flush pressure. Together these parameters can be used to ascertain Mechanical Specific Energy (MSE) or sometimes known as Specific Energy of drilling; a measure of the amount of energy required to remove a unit volume of rock, expressed in units of energy input divided by volume removed.
MWD is a drilling technique that provides continuous measurements of drilling parameters to compare against records of material type, strength, core loss, and potential voids from the borehole being drilled and nearby boreholes. The initial aim of the investigation at Bromford was to determine whether or not core loss recorded in boreholes was the result of natural voids such as gypsum dissolution or a product of drilling from variations in rock/soil profile during coring works. Potential natural voiding in the MMG leading to increased permeability has been identified as a hazard to tunnelling works where a sudden loss of TBM support pressure or where sudden inflow of water into Sprayed Concrete Lined (SCL) tunnels could impact construction.
A secondary aim of the investigation was to assess if MWD can provide a continuous ground strength profile for weak rock. Due to the closely fractured nature of MMG rock, it has been difficult to obtain representative core samples for laboratory strength testing, and other in situ penetration based tests often refused. Sampling of better quality sections of the core often skews interpretation to stronger materials while the lack of testing of certain zones due to fracturing or core recovery often leads to conservative interpretation of strength.
This paper investigates the use of MWD parameters for the investigation of voids in the MMG. It also assesses the use of MWD as a supplementary tool for investigations into weak rock by using the concept of MSE as a means to investigate rock strength profiles for the MMG.
- Written by
-
Christopher Brook (Mott MacDonald/BBV)

- Resource type
- Resource type: Technical Paper
- Intended audience
- Consultants
Introduction
This paper is presented as part of the works to deliver the Main Works Civils Contract (MWCC) for the northern section of High Speed Two (HS2) Phase One including Long Itchington Wood Green Tunnel to Delta Junction and Birmingham Spur and the Delta Junction to the West Coast Main Line (WCML) tie-in, being delivered by the BBV Integrated Project Team.
The High Speed Two (HS2) rail scheme south of Birmingham and north of Long Itchington Wood will encounter a significant amount of Mercia Mudstone Group (MMG) along its route. The section includes the Bromford Tunnel that will be constructed entirely within the MMG.
The MMG comprises weak fractured mudstone with a variable weathering profile and soluble rock content such as gypsum. Conventional ground investigation techniques undertaken as part of the HS2 main works ground investigation have sometimes struggled to obtain information on the intact strength of the MMG due to fracturing and weathering and the ability in obtaining an undisturbed/intact sample for testing.
Measuring-While-Drilling (MWD) is a technique that allows continuous near real time measurements of drilling parameters using machine mounted instruments and sensors. The method involves the use destructive drilling of boreholes with a tri-cone or similar bit and recording of variables such as drill head rotation speed (Revolution Per Minute – RPM), Rate of Penetration (ROP), torque, flush pressure, and thrust pressure. MWD provides an opportunity to obtain continuous records of drilling parameters from weak, fractured, and weathered rock that can be used to supplement conventional techniques such as when used alongside rotary cored boreholes. The analysis of different drilling records can build further knowledge of the ground conditions whether, for example, that be from noting losses in fluid pressure due to fractured zones in the ground or slower penetration rates from stronger rock layers.
Obtaining a near continuous ground strength profile for the MMG has implications for the planning and execution of construction activities such as Tunnel Boring Machines (TBM) and piling.
Furthermore, the concept of Mechanical Specific Energy (MSE), which is the minimum energy required to excavate a unit volume of rock, which is calculated from drilling parameters has been used to provide an indication of apparent relative ground strength.
MWD can also be used to assess ground related risks such as voiding, hard/strong layers, and other obstructions. Parts of the MMG sequence such as the Sidmouth Formation is known to contain gypsum and gypsum dissolution can potentially lead to voids developing. Such voids may be manifested in the drilling records as zones of core loss. Voids has been identified as a risk to construction and will cause locally increased permeability that is a hazard to tunnelling works, where a sudden loss of TBM support pressure or where sudden inflow of water into sprayed concrete lining (SCL) tunnels could be dangerous and impact construction costs and programme. Hard or strong rock layers in the MMG will affect construction by slowing the rate of penetration affecting construction programme and wearing of TBM cutter teeth.
Rock strength parameters such as Unconfined Compressive Strength (UCS) are important for the design of tunnel lining and are a key parameter for determining TBM advance rates [1]. Laboratory testing to determine rock strength parameters relies on suitable representative samples being available. Often due to the weak and closely fractured nature of MMG it was difficult to obtain representative core samples for UCS laboratory testing, which requires intact core samples of length at least three times the core diameter. There is also more UCS data from stronger intact siltstone and sandstone layers that are more likely to yield a suitable sample for testing and less data from weaker materials.
Study aims and purpose
The purpose of Measuring-While-Drilling (MWD) is to provide continuous measurements of drilling parameters in the MMG to compare against records of material type, strength, core loss, and potential voids from nearby rotary cored boreholes. The principal aim of the MWD at Bromford was to determine whether the core loss recorded in rotary cored boreholes was the result of natural voids such as gypsum dissolution or were a product of drilling in variable ground. A secondary aim was to see if MWD could provide a relative ground strength profile to assist in the design of construction activities such that, once calibrated, the technique could be used elsewhere along the alignment.
Study area location and description
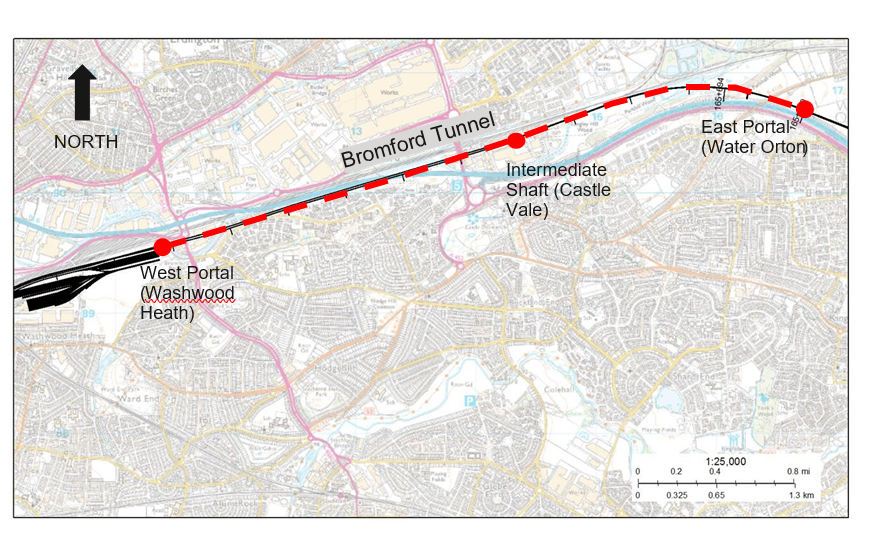
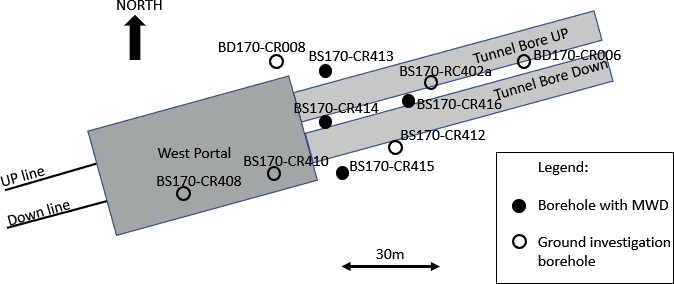
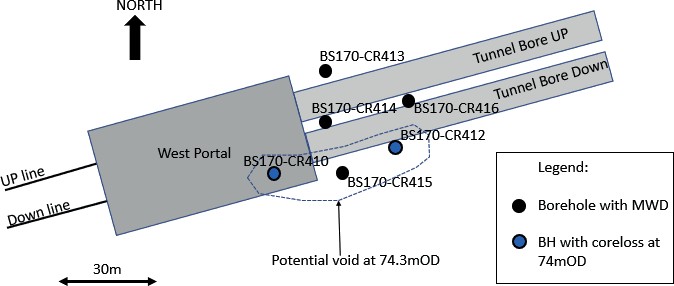
The study area is located within the proposed Bromford Tunnel on the Birmingham Spur of the mainline located between Water Orton and Washwood Heath (Figure 1).
The Bromford Tunnel is a 5.9km long twin bored tunnel approximately 8.3m in diameter. The tunnel crown is located up to 35m below ground level at its deepest point. The tunnel’s east and west portals comprise cut and cover box structures at Water Orton and Washwood Heath, respectively, while there is an intermediate shaft located at Castle Vale.
The study area is located within the River Tame flood plain where the ground surface is relatively flat and varies in elevation from 81mOD in the east near Water Orton to 92mOD in the west at Washwood Heath.
Geological setting
Bedrock within the study area comprises Mercia Mudstone Group (MMG). The MMG has been sub- divided based on regional depositional basins which display variations in stratigraphy and
characteristic mineralogy (Figure 2). The study area is located within the Knowle Basin where the Sidmouth Formation is present [4,6].
The Sidmouth Formation comprises interbedded very weak to weak mudstone with subordinate bands of weak to medium strong siltstone and sandstone (weathering Grade II). The top of the bedrock is usually partially to distinctly weathered to a firm to stiff soil (weathering Grades III and IV). The rock mass typically contains close to very closely spaced discontinuities comprising sub horizontal bedding and inclined to steeply dipping rock joints. Within the Sidmouth Formation gypsum is typically present forming veins and infilling discontinuities.
Thin beds of higher strength sandstone and siltstone are known to be present within the MMG and are locally termed ‘skerries’ or ‘skerry beds’ [4]. Skerry beds are typically less than 1m in thickness but have been recorded up to 4m thick in the vicinity of Bromford Tunnel. These higher strength beds can present an obstruction during excavation as well as forming localised zones of higher permeability.
Within the study area the bedrock is overlain by superficial deposits of Alluvium and River Terrace Deposits, which are localised and not present in all areas above the tunnel [6] (Figure 2).
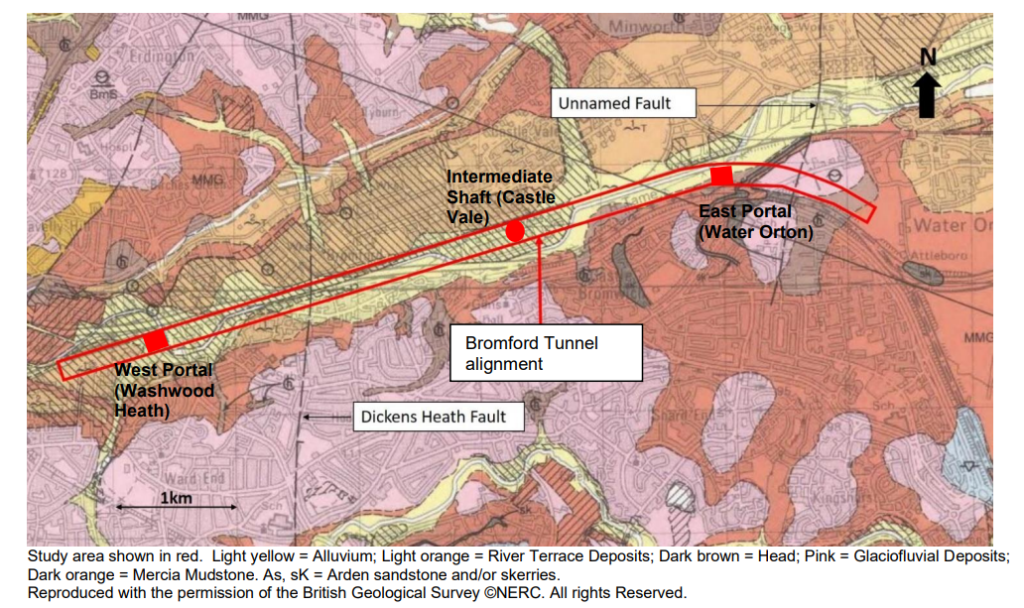
Structural geology setting
Within the study area few faults have been identified in published surface mapping due to the lack of suitable lithological markers in the MMG. The British Geological Survey (BGS) map sheet 168 and accompanying memoir indicates two faults cross the Bromford Tunnel alignment as shown in Figure 2.
The most western fault is the Dickens Heath Fault and it crosses the Bromford Tunnel between the intermediate shaft and west portal. The Dickens Heath Fault was formed during the Jurassic period due to east-west extensional rifting. Within the study area the fault is anticipated to be 60o or steeper producing a narrow zone of fault disturbed and weathered material [6]. The other fault to the east is unnamed.
Hydrogeological setting
The ground water system in the study area may be characterised as two aquifers being an upper aquifer in the superficial deposits and lower aquifer in the bedrock. The aquifers are potentially disconnected by the less permeable areas of the weathered Mercia Mudstone Group (Grade IV) acting as an aquitard. Groundwater flow within the superficial deposits will be dominated by intergranular flow (i.e. through pores). Within the Mercia Mudstone Group bedrock groundwater flow will be predominantly via bedding and fractures.
Soluble rock
Due to its arid depositional environment and the presence of ephemeral water bodies, soluble sulphate-rich deposits such as gypsum are common within the MMG [4]. Evidence from ground investigation borehole logs indicates that gypsum is the only soluble material to have been encountered in the Bromford Tunnel area. Other soluble rocks such as anhydrite are known to be present within the MMG but have not been encountered during the ground investigation.
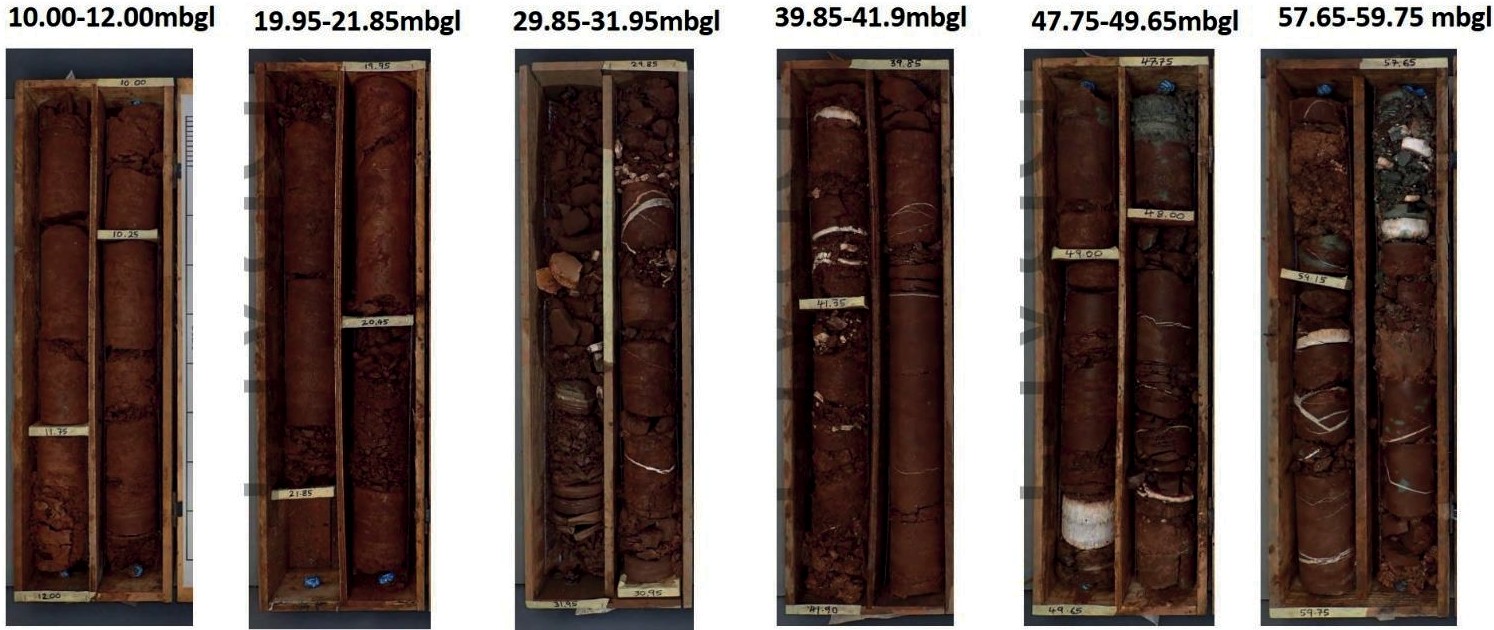
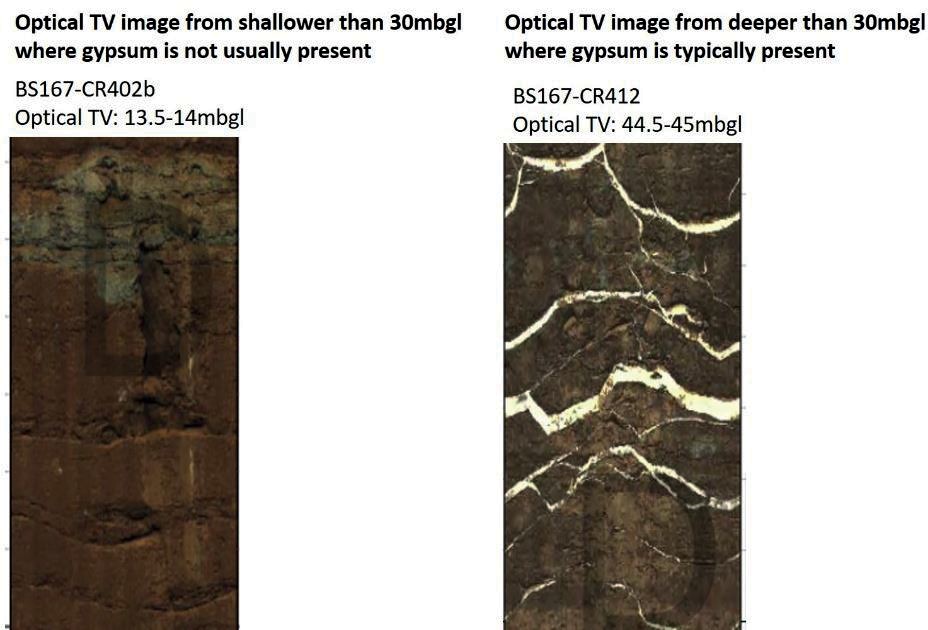
Dissolution of soluble rocks such as gypsum can result in the formation of voids/vugs, which have been identified in borehole records and may also be responsible for producing core loss during drilling. Notable areas showing potential evidence of gypsum dissolution include the Bromford west portal, the intermediate shaft, and about the Dickens Heath Fault.
Within ground investigation boreholes, gypsum is typically absent within the top 30m below ground level (Figure 3). Where ‘voids’ or ‘vugs’ were recorded in borehole lithological descriptions, this may be the result of gypsum dissolution (Figure 4).
Materials and methods
Testing procedure
Measuring-While-Drilling (MWD) was carried out in accordance with BS EN ISO 22476-15:2016: Geotechnical investigation and testing — Field testing Part 15: Measuring while drilling using quality class 1 [2]. The Standard details the specifics of recording machine parameters during the drilling process in real time, using sensors mounted to the drill rig. The Standard specifies the technical principles for the measuring equipment and reporting of parameters for geotechnical purposes.
Drilling parameters
Drilling constants and measured and calculated drilling parameters are summarised in Table 1. A drilling measurement was taken every 10mm of penetration.
During the MWD testing the drill head rotational speed, downward thrust pressure and flushing medium pressure were attempted to be kept constant by the driller, such that Rate of Penetration (ROP) and torque provided an indication of relative strength. The constant value numbers were selected by the driller based on the ground conditions at each borehole location and some variations in the constant parameters occurred between locations as a result of changing rock conditions.
The following drilling parameters and their purpose were calculated from the MWD results that use formulas contained in BS EN ISO 22476-15:2016 [2]:
- Rate of Penetration (ROP) (m/hr): Relates to the mechanical strength of the formation (ROP will be higher in softer ground).
- Thrust Pressure (bar): A drop in thrust pressure and increase in ROP may be an indication of weaker materials or voiding. A reduction in thrust pressure means the holdback pressure of the drill rods decreases and they essentially drop under their own weight, and the ROP will therefore increase provided the drill head rotation speed remains the same.
- Flushing medium pressure (bar): Gives information on circulation and may be an indication of degree of fracturing identifying zones of flush loss into the rock mass.
Table 1. Drilling Parameters
| Constant Parameters | Borehole diameter (mm or m) Drill bit area (mm2 or m2)Flush type (water) |
|---|---|
|
Measured Drilling Parameter | Drill head rotation speed (RPM) Measuring time (min) Penetration length (m)Downward thrust pressure (bar) Flushing medium flow (kPa)Torque pressure (bar) |
|
Calculated Drilling Parameter (Refer to formulas contained in BS EN ISO 22476-15:2016 [2]) | Rate of Penetration (ROP) (m/min or m/hr) Thrust pressure (bar)Flushing medium pressure (bar)Mechanical Specific Energy [5,8] (Nm/m3) (outside of EN ISO 22476) |
Mechanical Specific Energy (MSE) is calculated from MWD records and allows for the normalisation of readings from the various drilling parameters recorded. MSE is defined as the minimum energy required to excavate a unit volume of rock during the drilling process. It is widely used to quantify drilling efficiency and maximise rate of penetration (ROP) in the mining and oil and gas industry [7]. For optimal drilling efficiency (for oil and gas projects), the objective is to minimise the MSE and to maximise the rate of penetration (ROP).
Areas of low MSE require less energy to drill so may indicate weaker materials and vice versa for areas of high MSE. The degree of fracturing is also likely to affect the amount of MSE required to excavate a formation with highly fractured rock having a lower MSE then massively or thickly bedded rock.
MSE can be calculated from Formulas (1) [5,8] or (2) [1,7] below, that have similar input parameters. The formula considers drill bit size and diameter but does not take into consideration the drill bit type (i.e. tricone, drag bit etc) so this variable needs to be assessed separately and kept static if multiple bores are being conducted. Profiles of MSE measured using the same components can be used to investigate material resistance and therefore relative composition and strength. Typical values of MSE for similar materials encountered at the Bromford Tunnel are around 5 x 10⁸ Nm/m3 for sandy clay to 1.2 x 10⁹ Nm/m3 for sandstone [5].
Mechanical Specific Energy(N/m^3 )=(1/1000)((2.π.NT)/((π/4) d^2 (ROP))) (1)
Where: N is rotation speed (RPM), T is torque (N/m2), d is borehole diameter (m), and ROP is rate of penetration (m/hr).
Mechanical Specific Energy (MPa)=(P/Ab)((120.π.N.T)/(Ab.ROP)) (2)
Where: Ab is surface area of bit diameter (m2), P is weight on bit/thrust/feed pressure (N), T is torque pressure N is rotation speed (RPM), and ROP is rate of penetration (m/hr).
Testing locations
MWD was undertaken in four boreholes at the Bromford Tunnel west portal in June 2021 as shown on Figure 5 and outlined in Table 2. Construction levels at the west portal extend from ground level at around 89mOD down to around 72mOD. The boreholes were drilled using cable percussion techniques to the top of the MMG rock, then with a 146mm diameter rotary tri-cone drill bit with water flush in the MMG rock.
Table 2. Borehole MWD Investigations
| Borehole ID | Ground level (mOD) | Borehole depth (m) | Base of Borehole (mOD) |
|---|---|---|---|
|
BS170-CR413 |
88.6 |
24.4 |
64.2 |
|
BS170-CR414 |
88.4 |
25.5 |
62.9 |
|
BS170-CR415 |
89.3 |
45.4 |
43.9 |
|
BS170-CR416 |
88.4 |
25.8 |
62.6 |
Table 2. Borehole MWD Investigations
Limitations of MWD assessments
The following limitations with respect to the assessment of MWD parameters are provided:
- It is noted that the drilling contractor endeavoured to maintain a constant rotation speed, thrust pressure, and flush pressure during the recording of MWD parameters. However, some drilling variations could be expected as the strength and structure of the MMG is not continuous that would result in some artificial peaks and troughs in the data.
- Net down-thrust pressure, which is a function of down-thrust and holdback, weights of drill rods and of rotation head has not been directly measured. This parameter provides the best indication of voiding. It is assumed that the thrust pressure provided in the results represents a net down-thrust pressure value as it includes the weight of the drill rods. Sudden reductions in the recorded thrust pressure could indicate the drill rods dropping under their own weight.
- Boreholes with MWD are drilled destructively so no core is generated for logging. Details of the stratigraphy and test results are inferred from nearby existing rotary cored boreholes shown in Figure 5.
- The boreholes with MWD were located as close as possible to existing rotary cored boreholes shown on Figure 5 that have been used to infer geological boundaries and cross reference drill parameter measurements with laboratory tests. Since the MWD boreholes were completed sometime after the rotary cored boreholes, site access had changed and they could not be located closer to the rotary cored boreholes and were typically offset by around 20m leading to limitations in the extrapolation of data.
Results and observations
Drilling parameters
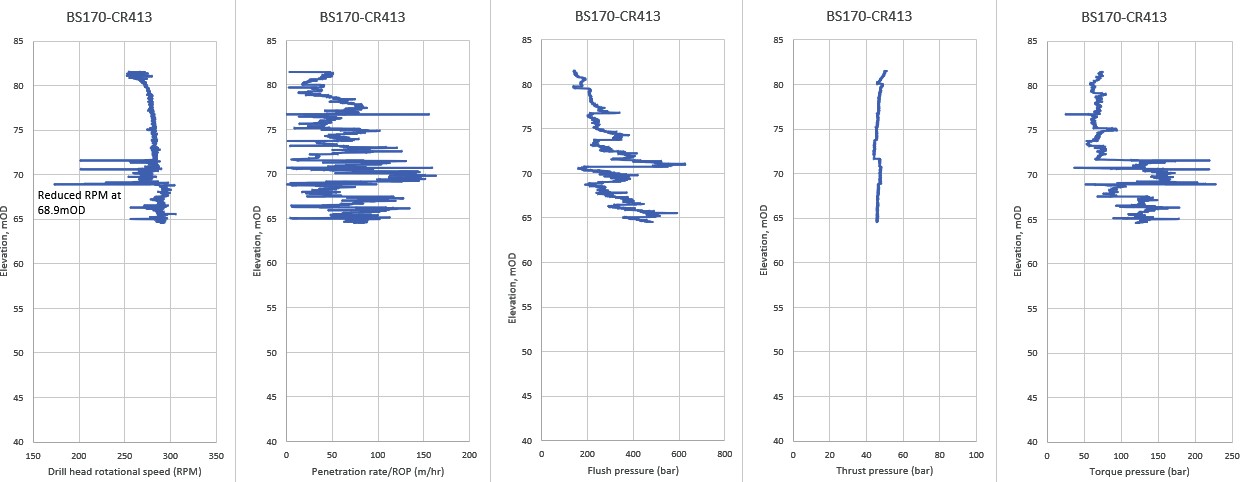
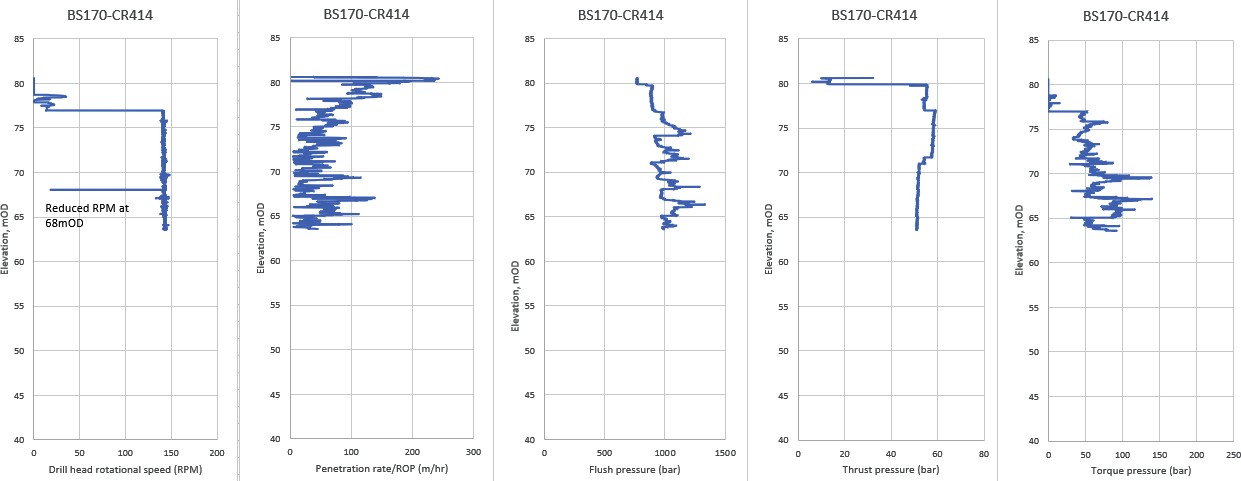
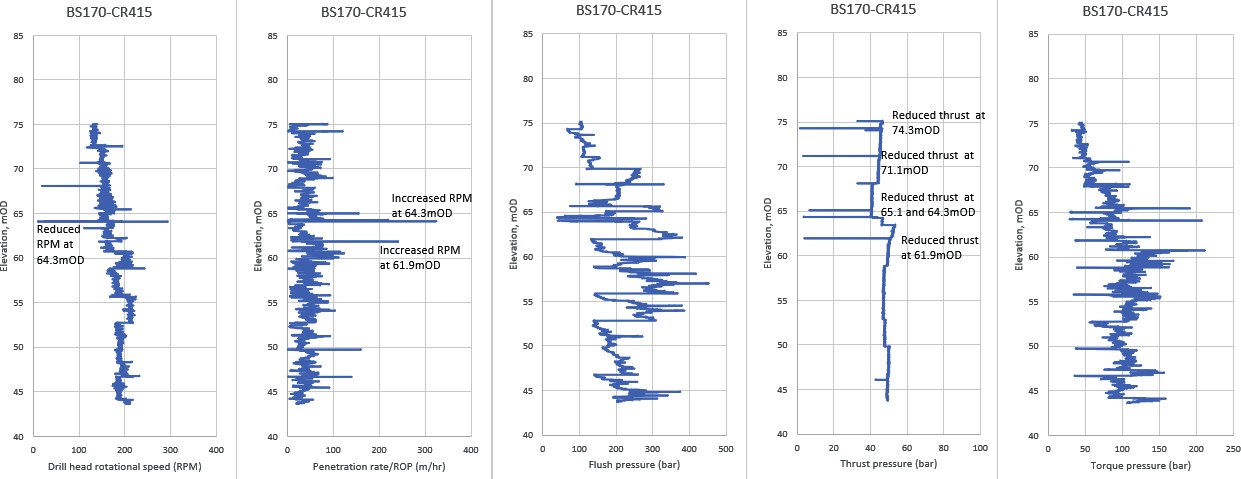
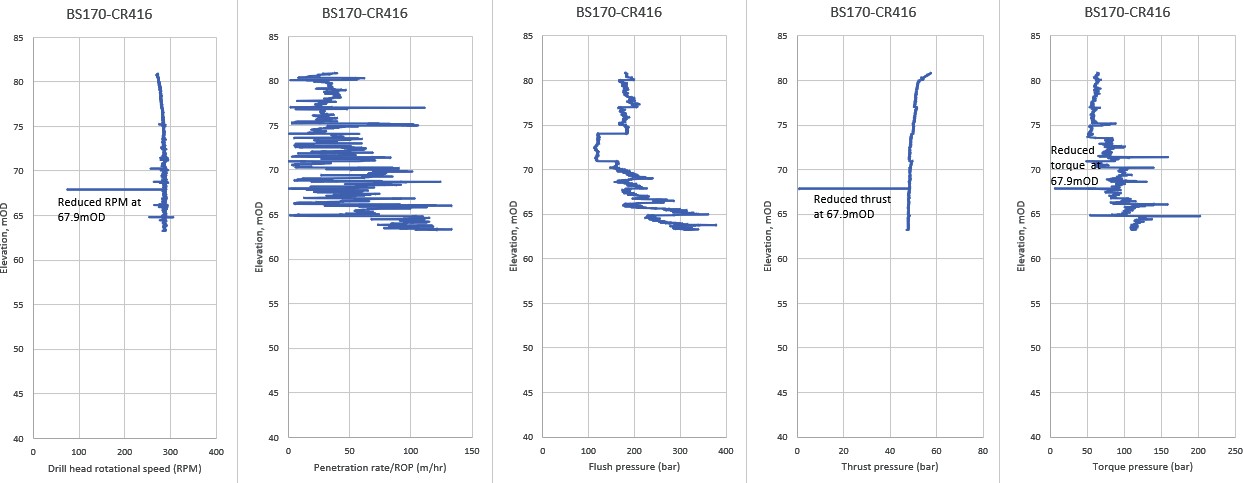
Plots showing drilling parameters results for drill head rotation speed (RPM), Rate of Penetration (ROP), flush pressure, and thrust pressure with elevation are included in Figure 6 and the result are used later on to assess the presence of voiding. Notable observations from the plots in Figure 6 are outlined below:
- BS170-CR413 does not show any significant reductions in thrust pressure. ROP is variable at this location, which may reflect variations in rock strength. There is a reduction in RPM at 68.9mOD that corresponds to a reduction in penetration rate.
- BS170-CR414 shows no significant reductions in thrust pressure or ROP except for near the start of MWD recording. There is a reduction in RPM at 68mOD. ROP shows a gradual decrease with depth, which could indicate an increase in material strength and resistance with depth.
- BS170-CR415 shows thrust pressure reductions at 74.3mOD, 71.1mOD, 65.1mOD,64.3mOD, and 61.9mOD. Increases in ROP were recorded at elevations of 64.3mOD and 61.9mOD, and a reduction in RPM was noted at 64.3mOD, which correspond to thrust pressure reductions.
- BS170-CR416 shows a reduction in thrust pressure, RPM and torque at 67.9mOD. At this level ROP and drill head rotational speed both decreased suggesting the reduction in thrust was likely to have been drilling method induced.
Mechanical Specific Energy
Mechanical Specific Energy (MSE) has been calculated using Formula (1) with the results plotted on Figure 7. A separate calculation using Formula (2) was found to produce similar values, the latter factoring in feed force/thrust. Stratigraphic boundaries from nearby boreholes have been included on the plots to aid interpretation. The following observations are made with regards to the results:
- There is a general increase in MSE with depth. This is evident in BS170-CR415 that is the deepest record available, which represents an increase in material strength with depth.
- Notable peaks in MSE occur at similar levels across all borehole locations such as at: 80mOD, 76mOD, 71mOD, 68mOD, 65mOD, and 61mOD. They may be indicative of zones of similar geology and strength across the study area. This is discussed in more detail below.
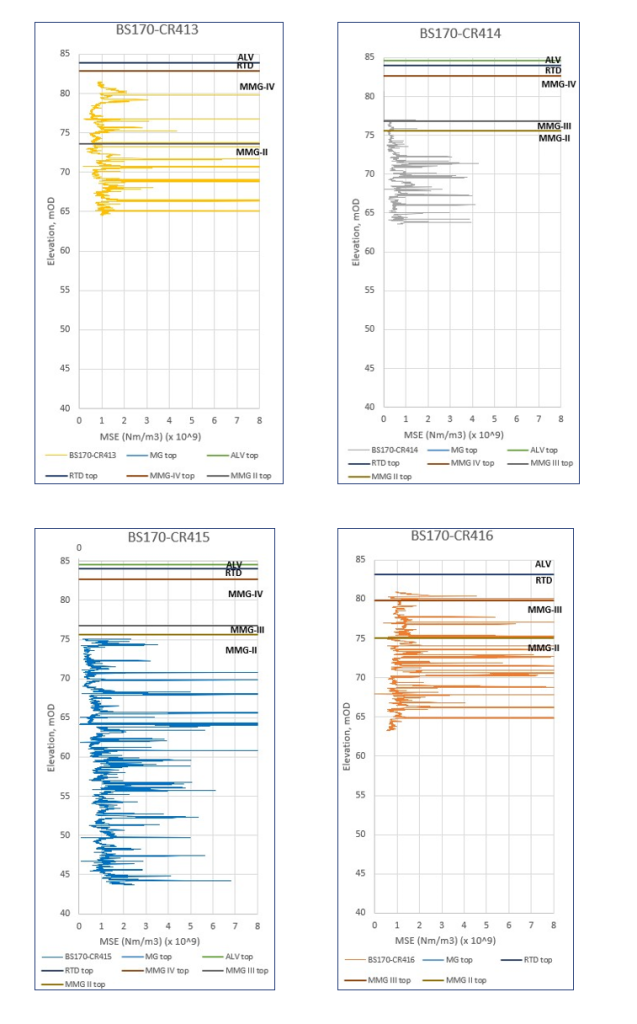
Figure 7. Mechanical Specific Energy plots with lithologial boundaries from nearby boreholes(ALV= Alluvium, RTD= River Terrace Deposits, MMG= Mercia Mudstone Group showing weathering grade)
Assessment of results
Assessment of potential voiding in MMG
An indicator of voids could be where thrust pressure decreases and ROP increases suggesting a free-weight drop in the drill rods. Where these areas correspond to an area of recorded core loss in nearby boreholes then voiding is more likely to be present.
Alternatively, the core loss may still have been the result of drilling between layers of varying strength causing over rotation and scrubbing of the core; however, it would be expected that an element of MSE would still be registered in this instance.
A comparison of ROP and thrust pressure with core loss recorded in nearby borehole logs is discussed below:
- No reductions in thrust pressure or increases in ROP were recorded in BS170- CR413 and no areas of core loss were recorded in nearby boreholes. Therefore, there is no indication of voids at this location.
- No reductions in thrust pressure or increases in ROP were recorded in BS170- CR414. Nearby boreholes recorded core loss at 74.4mOD and 51.6mOD; however, ROP or thrust pressure did not deviate at these levels so there is a low likelihood that voids are present.
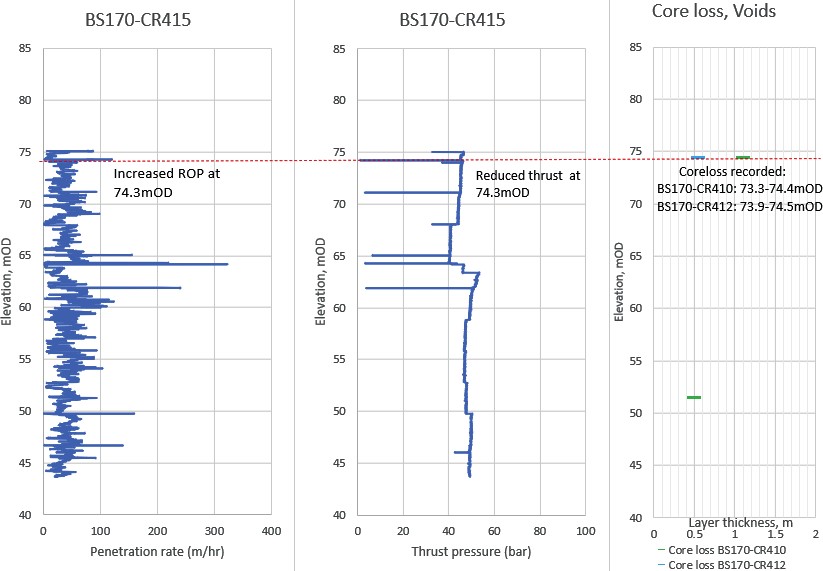
- In BS170-CR415 thrust pressure reductions and ROP increases were noted at 74.3mOD, 71.1mOD, 65.1mOD, 64.3mOD, and 61.9mOD. Core loss was noted at 74.4mOD up to 1.1m thick in two nearby boreholes BS170-CR410 and BS170- CR412 corresponding to an interval noted above. This indicates a potential void could be present at 74.3mOD as shown on Figure 8 and Figure 9 that is close to proposed construction level of the tunnel in this area. However, MSE did not reduce to zero as could be expected if a void (with no infill) had been encountered so this could also represent a zone of weaker material.
- In BS170-CR416 a thrust pressure reduction occurs at 67.9mOD, which corresponds to a reduction of drill head rotation speed and ROP. No core loss was noted in nearby boreholes at this elevation so a void is not likely.
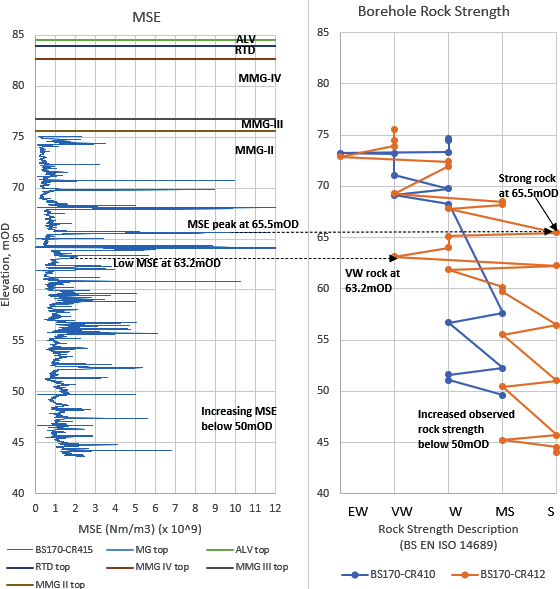
Assessment of MMG rock strength
MWD parameters and Mechanical Specific Energy (MSE) have been compared to rock strength descriptors from borehole logs. Figure 10 shows the MSE profile for BS170-CR415 (deepest MWD record available) alongside the rock strength descriptors from nearby borehole logs. The MSE profile shows a gradual increase with depth, which corresponds to increasing rock strength with depth in nearby boreholes from very weak and weak rock to 69mOD, to weak and medium strong rock to 60mOD, to medium strong and strong rock below 60mOD.
The MSE results also identified sudden changes in rock strength such as the strong rock layer recorded in BS170-CR412 at 65mOD and very weak rock layer recorded in BS170- CR412 at around 63mOD (Figure 10).
By comparing rock strength against typical MSE values at similar elevations, typical values of MSE for different MMG rock strengths are provided in Table 3 along with strength descriptions from BS EN ISO 14689 [3]. Some ambiguity in rock strength can be expected as this is based on logging observations, which may differ depending on core recovery and quality.
(EW= Extremely weak, VW= Very weak, W= Weak, MS= Medium strong, S= Strong)
Table 3. Typical Values of Specific Energy for Mercia Mudstone Group
| MMG Rock Strength (BS EN ISO 14689) | Unconfined Compressive Strength (BS EN ISO 14689) | Typical Specific Energy values (Nm/m3 x 109) 1 |
|---|---|---|
|
Extremely weak |
0.6 – 1 |
0.1 – 0.2 |
|
Very weak |
1 – 5 |
0.2 – 1.0 |
|
Weak |
5 – 25 |
1.0 – 5.0 |
|
Medium strong |
25 – 50 |
5.0 – 10.0 |
|
Strong |
50 – 100 |
>10.0 |
MWD parameters and Mechanical Specific Energy (MSE) were compared to Unconfined Compressive Strength (UCS) laboratory test results from nearby boreholes. UCS results for the Bromford Tunnel west portal are plotted alongside MSE values from BS170-CR415 on Figure 11 as other MWD records were too shallow to allow a correlation. The plot shows a good correlation between areas of high MSE and high UCS results and low MSE and low UCS results.
Based on the UCS laboratory test results from the west portal, Specify Energy (x 109, Nm/m3) can be estimated as UCS (MPa) divided by 5. This relationship is shown on the right side of Figure 11 and in more details on Figure 12 where orange markers, which equal UCS (MPa) / 5, plot close to values of MSE at similar elevations. The relationship with UCS values given in BS EN ISO 14689[3] is shown in Table 3 above.
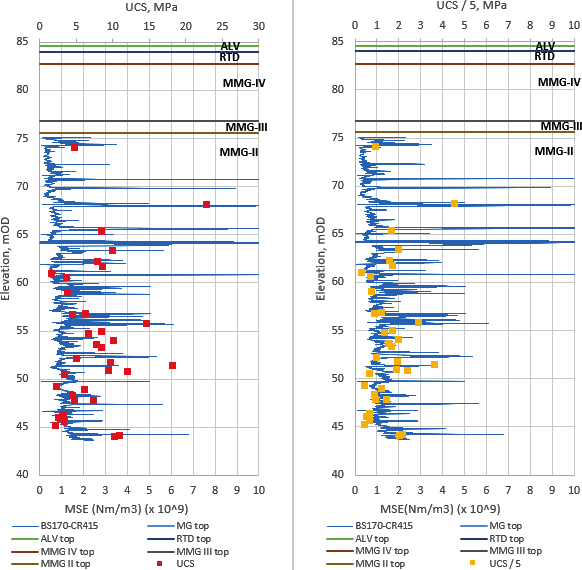
(ALV= Alluvium, RTD= River Terrace Deposits, MMG= Mercia Mudstone Group showing weathering grade)
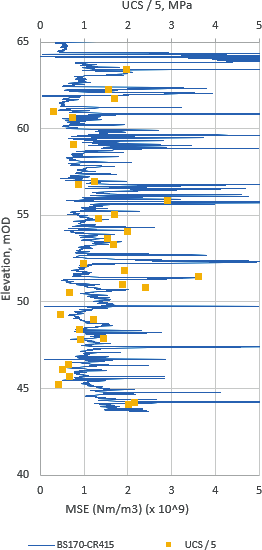
(close up of elevation 65mOD to 40mOD)
Summary and conclusions
The following summary and conclusions are provided with respect to the MWD results:
- Measuring-while-drilling (MWD) has benefits of providing information on the ground conditions for use by project designers and construction contractors that is additional to conventional techniques such as borehole logging, in situ and laboratory testing.
- MWD provides continuous records of drilling parameters that can be used to supplement observations and results from conventional boreholes. It may be used to assist with assessing ground related risks such as potential voids as well as assessing strength profiles for weak rocks that are difficult to sample and test. It is shown to be a useful tool for providing continuous ground strength parameters in weak fractured Mercia Mudstone Group deposits, which can be difficult to quantify from conventional ground investigation techniques, and the results can be correlated with rock strength data such as UCS.
- Thrust pressure, which is the force pushing the drill bit against the formation, is a useful indicator of voiding. When comparing thrust pressure and ROP to areas of core loss in nearby borehole records it is possible to assess causes of apparent core loss events in rotary cored boreholes. Where sudden reductions in thrust pressure and increase in ROP coincide with a zone of core loss from a nearby borehole then a void could be present. An example of a possible void was identified at 74.3mOD at the Bromford Tunnel west portal that is close to construction level of the tunnel in this area. The size of the void was not determinable from the techniques but is not expected to be more than 10’s centimetres in size given the likely mechanism of void formation is from the dissolution of gypsum veins that are typically less than 50mm thick. Alternatively, this core loss could represent a transition from a strong material to an extremely weak material where drill head rotation was increased to penetrate the strong material resulting in over rotation and scrubbing of the core. Further investigation techniques could help constrain the nature of a void in this location such as downhole televiewer and callipers.
- Mechanical Specific Energy (MSE) calculated from MWD results, which is defined as the minimum energy required to excavate a unit volume of rock during the drilling process, is a useful parameter to assess material strength in weak rocks. MSE is independent of excavation method and drill head size, however different drill head types will result in different MSE signatures. In this assessment MSE was calculated from a ground investigation borehole rig with a tricone bit. Mechanical Specific Energy is shown to be sensitive to changes in material composition and strength when comparing to nearby ground investigation boreholes. Upon comparing Mechanical Specific Energy values to borehole strength descriptions and UCS laboratory test results from nearby boreholes, it can be estimated as UCS (MPa) divided by 5 (units x109, Nm/m3).
Further work
Given the findings from the analysis carried out it was considered to be beneficial to extend the testing to gain further insights. A further three boreholes are to be drilled along the Bromford Tunnel corridor in 2022 with these holes located directly adjacent to existing rotary cored boreholes that show core loss events. The additional boreholes have also been scoped with additional testing including downhole televiewer and calliper logging to provide further information on material type and possible voiding. An increased review of drill rod hold back measurements will also be undertaken to confirm or not the presence of voiding or drilling induced core loss.
Acknowledgments
The authors would like to thank Balfour Beaty Vinci JV for HS2 (BBV) for permitting the undertaking of the Measuring-while-drilling as part of the ground investigation works and Fugro for undertaking the testing.
References
- Armenta, M. (2008) Identifying inefficient drilling conditions using drilling-specific energy. SPE 116667, Denver, USA.
- BS EN ISO 22476-15. (2016): Geotechnical investigation and testing — Field testing Part 15: Measuring while drilling.
- BS EN ISO 14689. (2018). Geotechnical investigation and testing. Identification and classification of rock
- Hobbs, P. R.N and 8 others. (2002). Engineering Geology of British rocks and soils – Mudstones of the Mercia Mudstone Group. British Geological Survey Research Report, RR/01/02. 106pp.
- Kolapo, P. (2021). Investigating the Effects of Mechanical Properties of Rocks on Specific Energy and Penetration Rate of Borehole Drilling. Geotech Geol Eng (2021) 39:1715–1726.
- Powell, J H., Glover, B W. and Waters, C N. (2000). Geology of the Birmingham area. Keyworth: Nottingham, Memoir of the British Geological Survey. Sheet 168 (England and Wales).
- Wisniowski, R. Knez, D. and Hytros, L. (2015). Drillability and mechanical specific energy analysis on the example of drilling in the Pomeranian Basin. AGH Drilling, Oil, Gas. Vol. 32. No. 1.
- Yasar, E. Ranjith, P. and Viete, D. (2011). An experimental investigation into the drilling and physico-mechanical properties of a rock-like brittle material. J Petrol Sci Eng 76:185–193.
Peer review
- Graham DowlenHS2 Ltd
- Sarah TrinderHS2 Ltd