Train fire spalling risk assessment
Structural fire protection is provided to structures where necesssary to ensure the resilience of the structure in the event of a fire. Loss of material strength at high temperature and spalling of concrete can lead to structural damage and collapse if not adequately mitigated. However, provision of structural fire protection can add significant cost and program time and is frequently over-specifed because location-specific requirements cannot be assessed. This paper describes a methodology to determine appropriate design guidance for element structural fire protection.
The methodology includes analysis of the gas phase heat flux to structures from a train fire using different modelling approaches. The predicted gas phase heat flux is used to assess the risk of explosive spalling within individual structural elements, based on 1D modelling of conduction within concrete combined with a literature review of the key factors that influence spalling.
The detailed analysis presented in this paper is for Victoria Road Crossover Box (VRCB). This fire risk assessment is also used to develop line-wide guidance for all open structures and for all other open infrastructure assets in the HS2 Phase One Lots S1 and S2 contracts which cover the Euston Tunnels and Approaches, and the Northolt Tunnels.
The purpose of the fire risk assessment is to avoid over-design by providing appropriate temperature criteria to design structural fire resistance. This guidance also provides information to avoid the provision of measures such as synthetic polypropylene (PP) fibres where not required. It is particularly beneficial where PP fibres cannot easily be included, such as in the concrete diaphragm walls of VRCB, avoiding the need for alternative costly measures.
Introduction
The design of underground structures should adequately mitigate the risks of explosive spalling, the performance requirements to achieve this are typically based on those appropriate for a tunnel fire, which is the approach adopted in the HS2 Technical Standard for Underground boxes. Tunnel design criteria are often unduly onerous for structures which are open to atmosphere or at greater distances from the fire than in tunnels. Typically, micro synthetic polypropylene fibres are included in permanent concrete tunnel/underground structure linings to provide anti-spalling resistance to assist structural fire protection.
This methodology utilises an analytical approach to assess spalling risk at Victoria Road Crossover Box (VRCB) and to identify where PP fibres are not required in the structures.
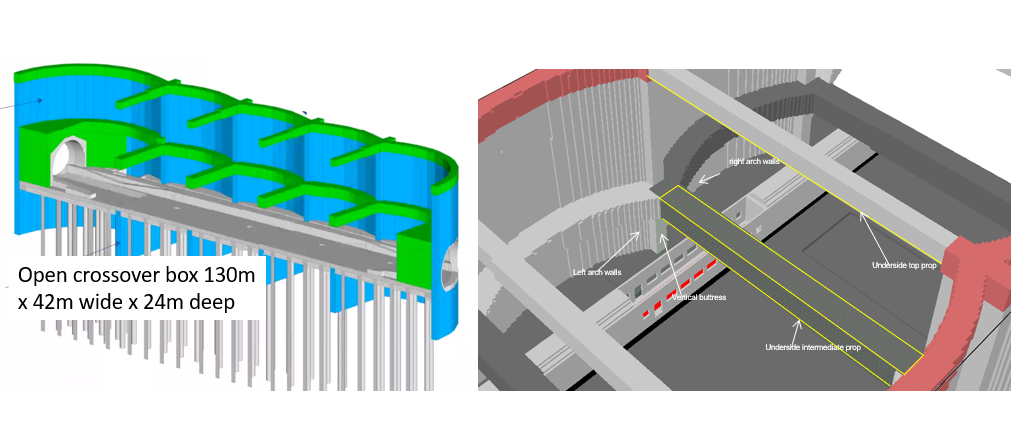
The VRCB comprises caterpillar walls, props and shaft walls forming an open underground structure, as shown in Figure 4. The assessment for VRCB can therefore be used to develop guidance applicable to all similar underground structures.
The structure of this paper is:
- Establish a design fire based on the Eureka tests;
- Analyse heat fluxes to structures within VRCB resulting from the design fire;
- Analyse temperatures within concrete structures through 1D heat transfer analysis;
- Assess spalling risks for VRCB structure elements;
- Develop lot-wide guidance to all underground structures open to the air above.
The VRCB is part of the southern section of High Speed Two (HS2) Phase One – Lots S1 and S2 (Area South) – which includes the Northolt Tunnels and the Euston Tunnel and Approaches, being delivered by the SCS Integrated Project Team.
Methodology
The fire engineering assessment methodology is illustrated through the following flowchart:
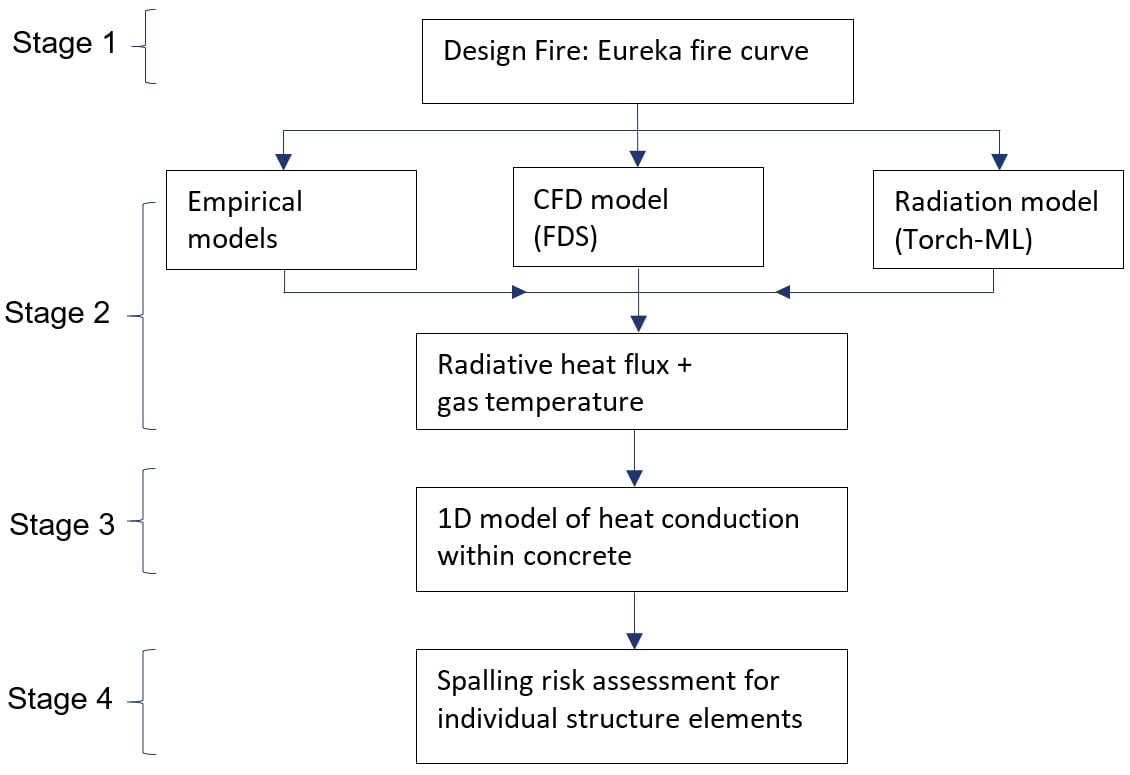
Stage 1 obtains a design fire based on the Eureka tests. Stage 2 models the incident heat flux to structures and gas temperatures within VRCB using different approaches in conjunction. Stage 3 models the temperature increase through concrete structures using a 1D model of conduction within the concrete, with key parameters taken from Eurocode. Stage 4 assesses the risk of explosive spalling within individual structural elements and to develop lot-wide guidance which applies to other similar underground structures.
Stage 1 – Design fire based on Eureka tests
The proposed design fire for use in the numerical modelling is based on Eureka tests [1].
The Eureka time temperature curve has a maximum temperature of 1200 °C lasting
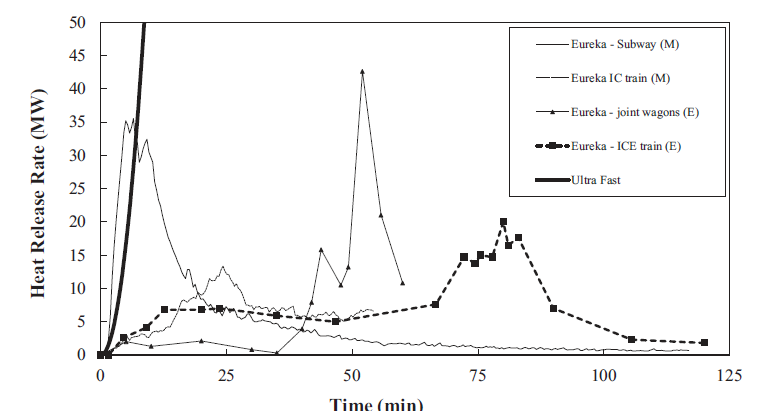
55 minutes; this is appropriate for confined tunnel conditions in which a large fire results in flame impingement to the tunnel structure and significant re-radiative from heated structures. However, design fire should be based on the heat release rate (HRR) rather than the time-temperature curve. The HRR curves from the Eureka fire tests (Figure 1) show the longest duration of an HRR greater than 10 MW was approximately 30 minutes. The design fire curve therefore needs to take account of peak HRR and energy content from the Eureka tests [1].
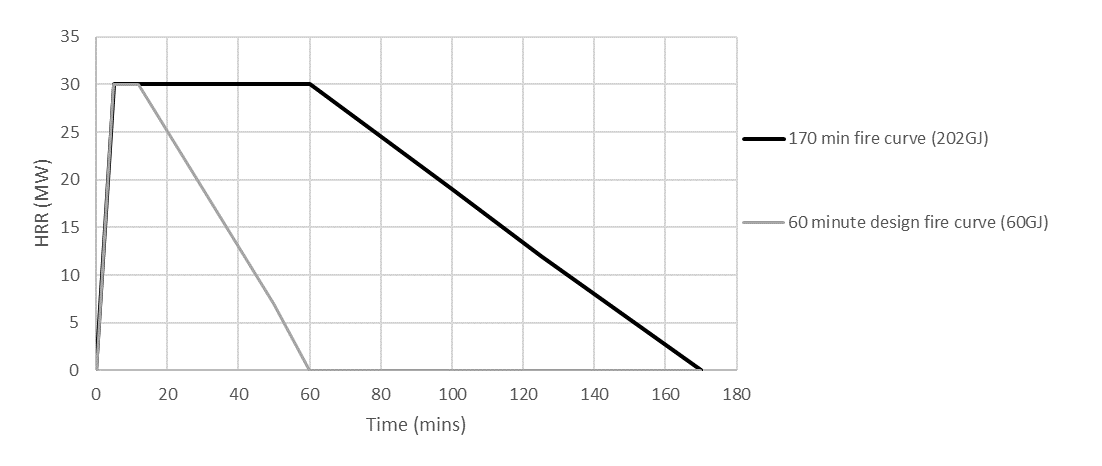
This proposed design fire (shown in Figure 2) is based on the Eureka fire tests for a peak HRR of 30 MW and an energy content of 60 GJ (the average from the carriages used in the Eureka tests), which can be used as an estimate of the expected combustible energy content for HS2 carriages. A second HRR curve is also shown in Figure 2 that has a 170-minute duration as per the Eureka time-temperature curve. However, it should be noted the energy content associated with this second curve is 202 GJ, much higher than any of the Eureka fire tests. A sensitivity fire size is undertaken with more onerous fire curves, based on the maximum peak HRR of any of the Eureka tests, which is based on a peak of 45 MW after 5 mins and a total energy content of 80 GJ (the maximum energy content from the cars used in the Eureka tests). The 45 MW case was taken as a sensitivity case rather than the design fire because, for an energy content of 60 GJ, the 45 MW peak can only be sustained for a very short time before burnout of fuel causes the heat release to rapidly decrease, as illustrated in Figure 1.
Stage 2 – analysis of heat flux to structures at VRCB
This section describes the analysis for VRCB to obtain the radiative heat flux and temperatures for different fire locations, and different distances between individual structural elements and the design fire, which is then used in the 1D heat conduction model analysis.
Fire scenarios in VRCB
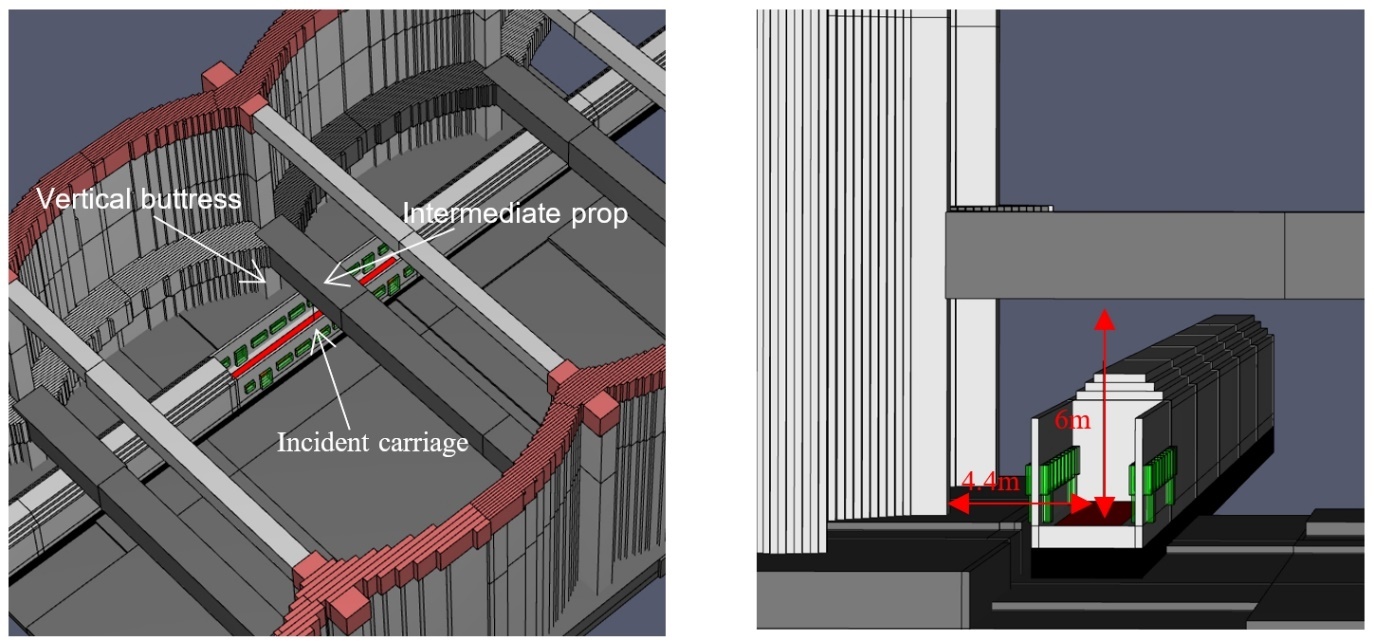
The VRCB is located to the west of Old Oak Common Station. The greatest heating to any elements of structure is when a train fire is under a prop or close to the vertical buttress. Therefore, the assessment is based on an incident carriage located beneath the intermediate prop, as shown in Figure 3.
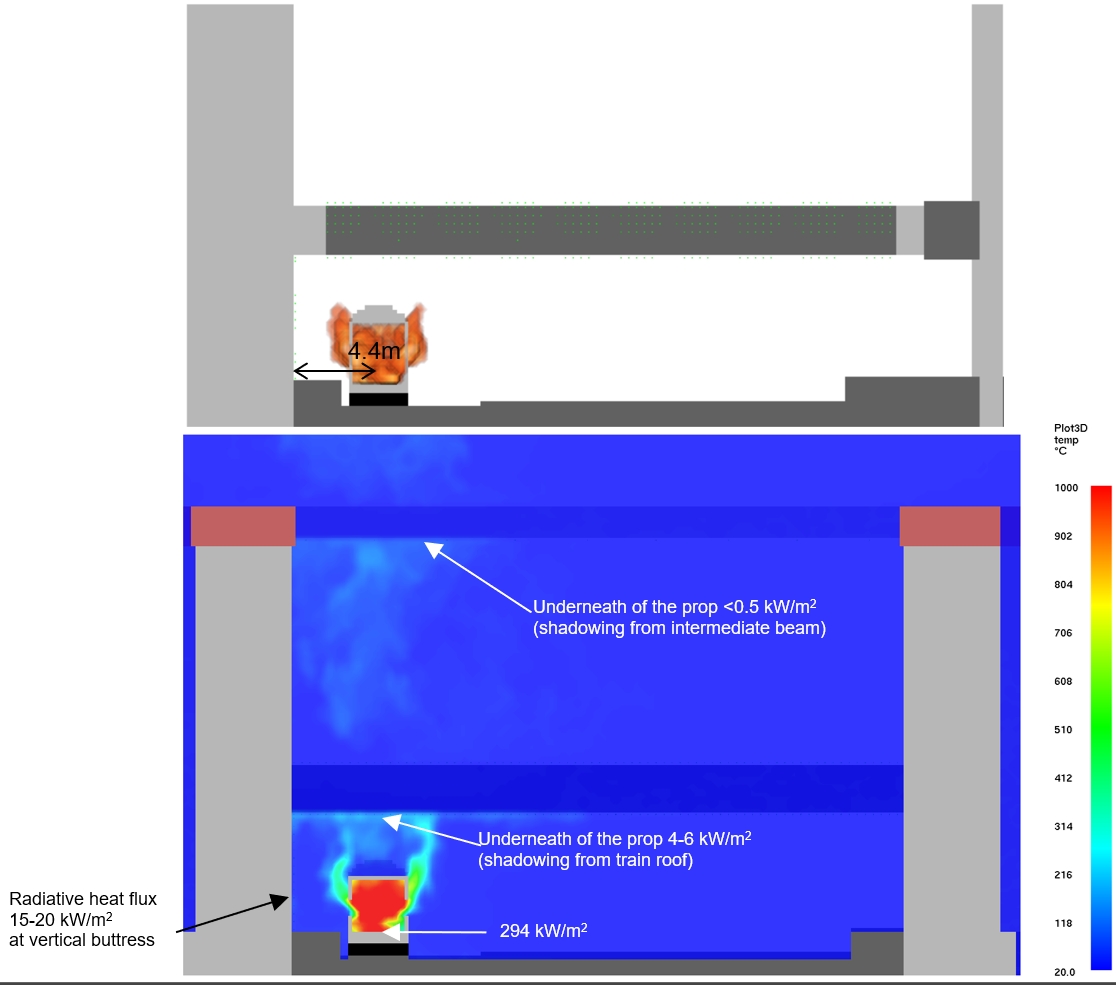
The vertical distance from the incident carriage floor to the underside of the intermediate prop is approximately 6.0m and the horizontal distance from the centreline of the incident carriage to the vertical buttress is approximately 4.4m.
All simulations involve all train windows and doors being open; simulations with the train roof intact are compared with others with the train roof burnt through, thereby allowing for an assessment of the effect of shadowing when the train roof is intact. To develop lot-wide guidance for open structures, a scenario with the intermediate prop removed was modelled. This scenario is representative of a fire in any open structure in which the plume above the fire is unconfined.
The analysis considers the caterpillar walls, props and shaft walls which make up VRCB. Radiative heat fluxes are calculated at different structure element locations (at the vertical buttress, at the intermediate prop, at the underside of the top prop and at the arch walls) shown in Figure 4. Gas temperatures next to structures are used to calculate the convective heat fluxes. Net heat fluxes, which are used in the 1D model of conduction, are the sum of the radiative and convective heat absorbed by the structural element.
A train fire of steady heat release rate (HRR) of 30 MW is simulated in Fire Dynamics Simulator (FDS) [2], represented by a gas burner with dimensions of 1.8m x 17.0m on the incident carriage floor. The same fire scenarios are considered by calculation of radiative heat flux to a target by calculating view factors using either analytical methods (simple radiating panel), or numerical integration using the Torch-ML software [3]. The model geometry and train dimensions are consistent with the model geometry used in the FDS analysis. Empirical calculations of flame height and temperature and thermal radiation using correlations from PD7974 [4] are also included.
Radiative heat flux – train fire with train roof intact
Figure 5 illustrates the height of the 3D shape of the flame, temperatures and radiative heat fluxes around the fire at a transverse cross section through the incident carriage. The intermediate prop above the incident carriage causes shadowing and reduces the radiative heat flux and gas temperatures above it.
To develop lot-wide guidance for open structures, a scenario with the intermediate prop removed was also modelled. This scenario is the representative of a fire in any open structure in which the plume above the fire is unconfined.
Figure 6 shows the temperatures around the fire at a transverse cross section through the incident carriage.
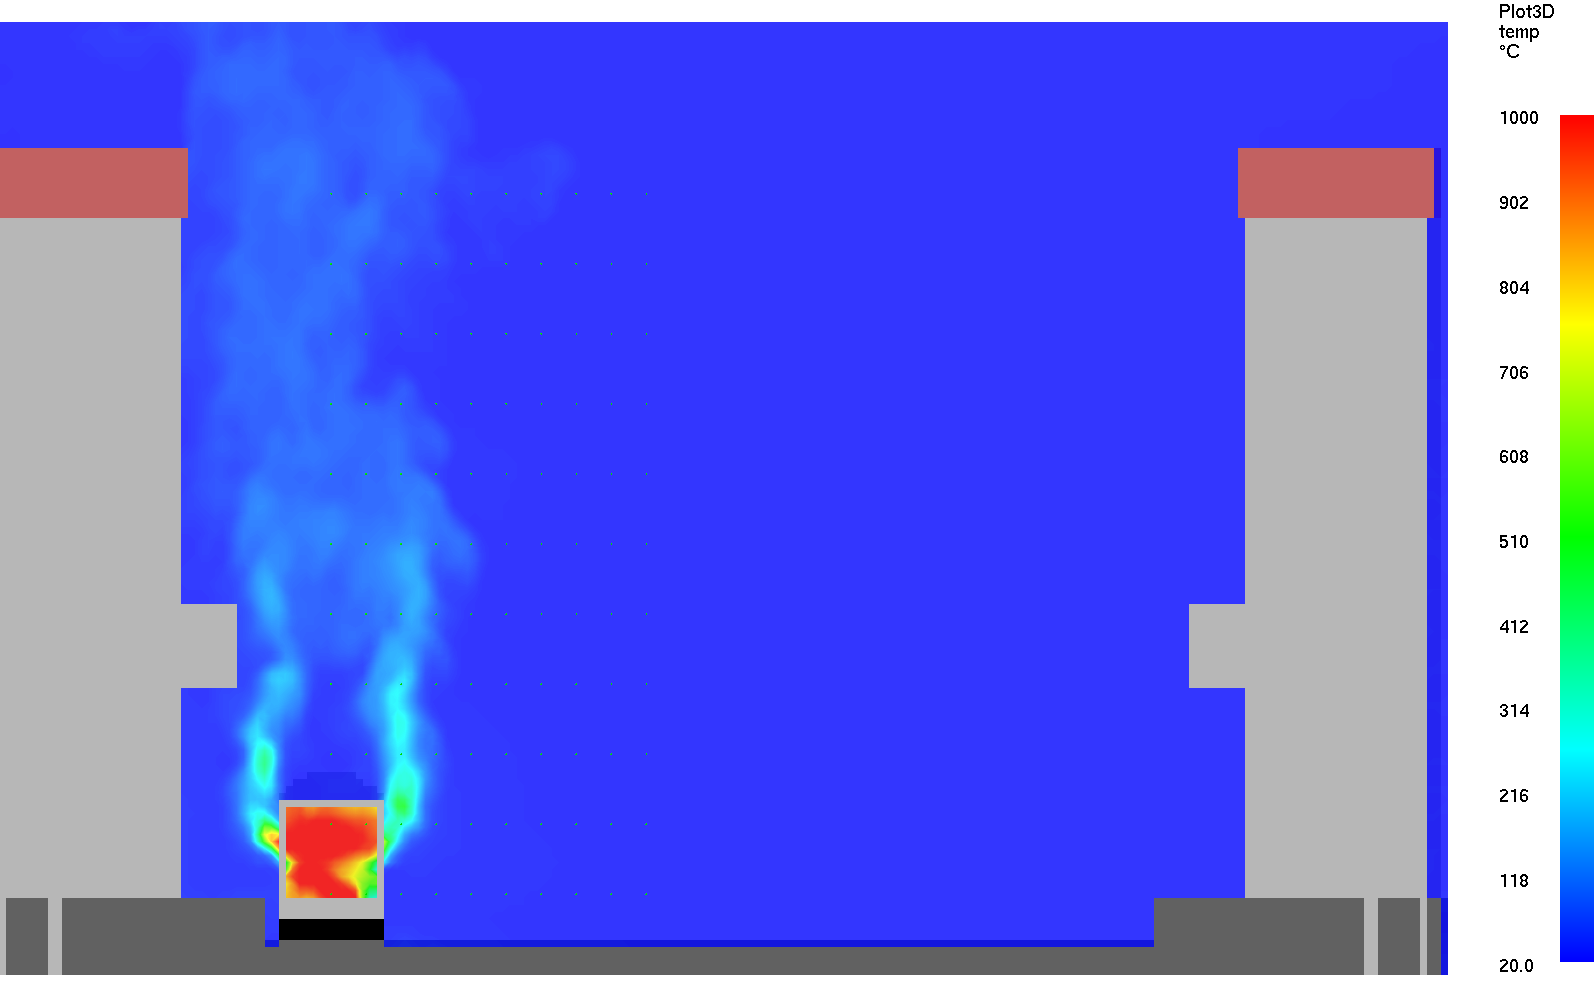
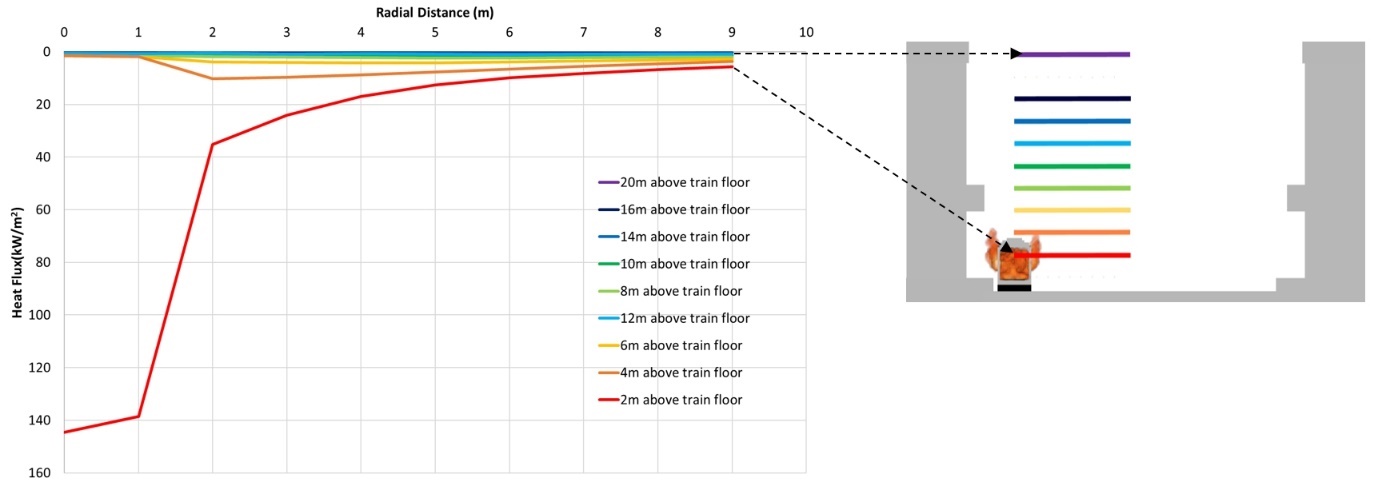
Figure 7 shows the radiative heat flux at different heights above the train floor with radial distance away from the centre of fire (intermediate prop removed to exclude shadowing effects from the prop). In this scenario the radiative heat flux above the fire is relatively low since the train roof also causes shadowing.
Radiative heat flux – train fire with train roof burnt through
Figure 8 illustrates the height of the 3D shape of the flame, temperatures and radiative heat fluxes around the fire at a transverse cross section of the incident carriage. Since the train roof is burnt through in this scenario there is no shadowing of the flame and radiative heat flux to the underside of the intermediate prop is much greater. The flame height from the CFD model can be compared with the calculated mean flame height of 4.1 m, based on correlations from PD7974 [4] for a rectangular fire source. The flame height from the CFD model is slightly higher than 4.1 m, however, it should be noted that the flame shape predicted by the CFD model is strongly three-dimensional and transient. This issue is discussed in greater detail later in this section.
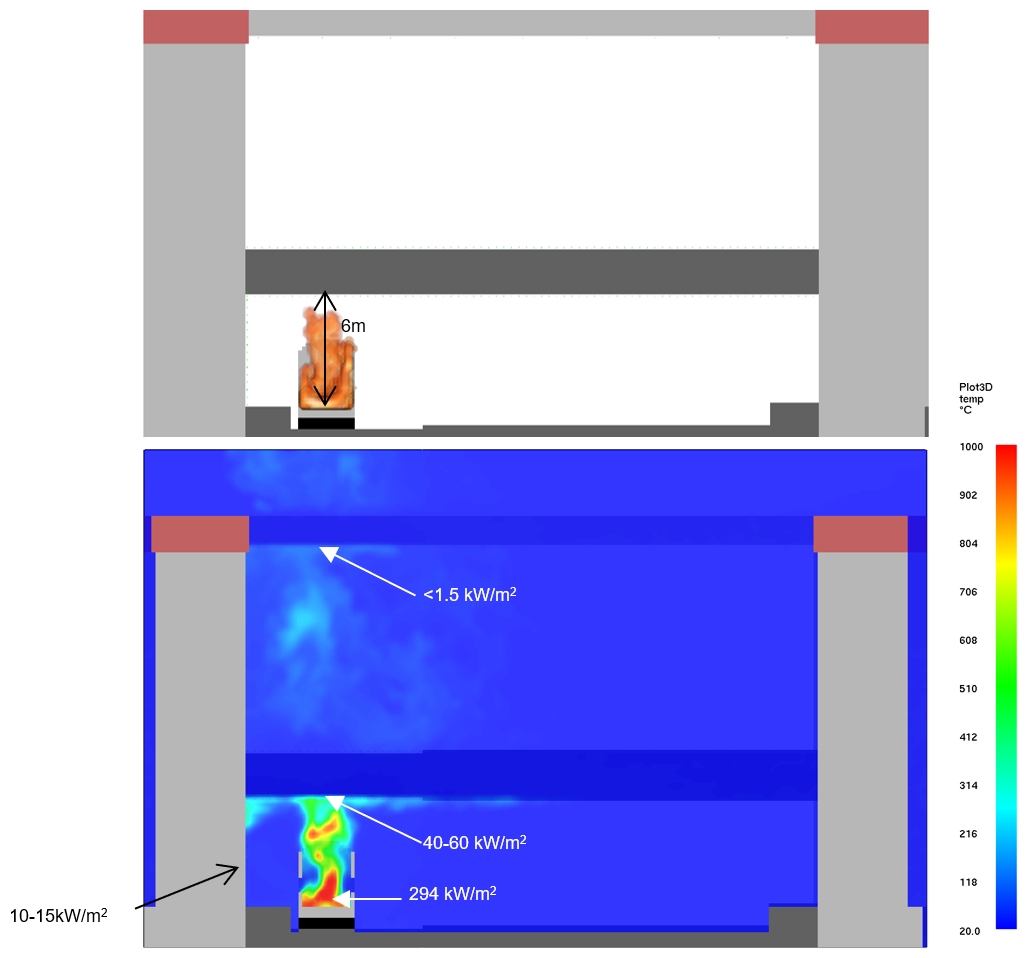
Figure 9 shows removal of the intermediate prop removes any shadow effects, resulting in increased temperatures in the plume.
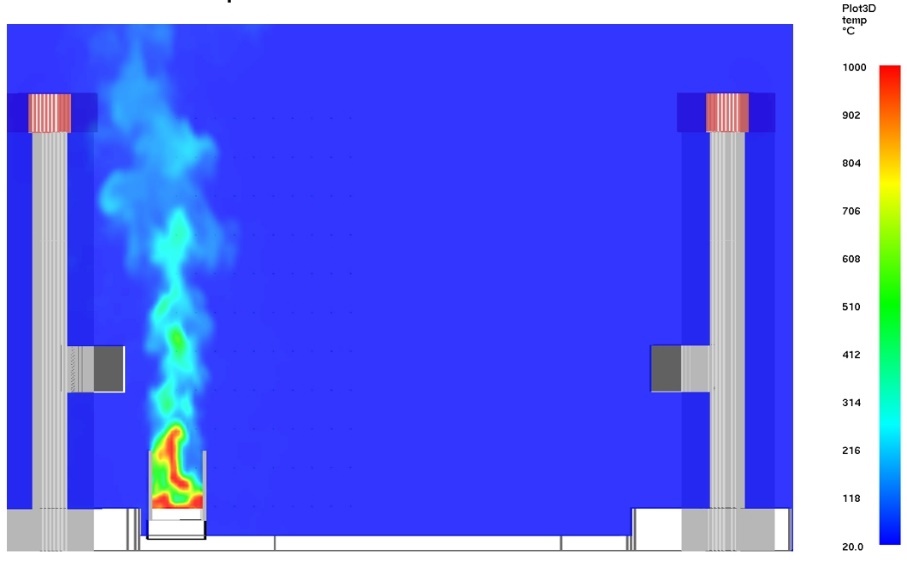
Figure 10 shows radiative heat flux at different heights above the train floor with the radial distance away from the centre of the fire (intermediate prop removed). The results from an analytical (radiating panel) method (with train wall shadow effects excluded) are also shown.
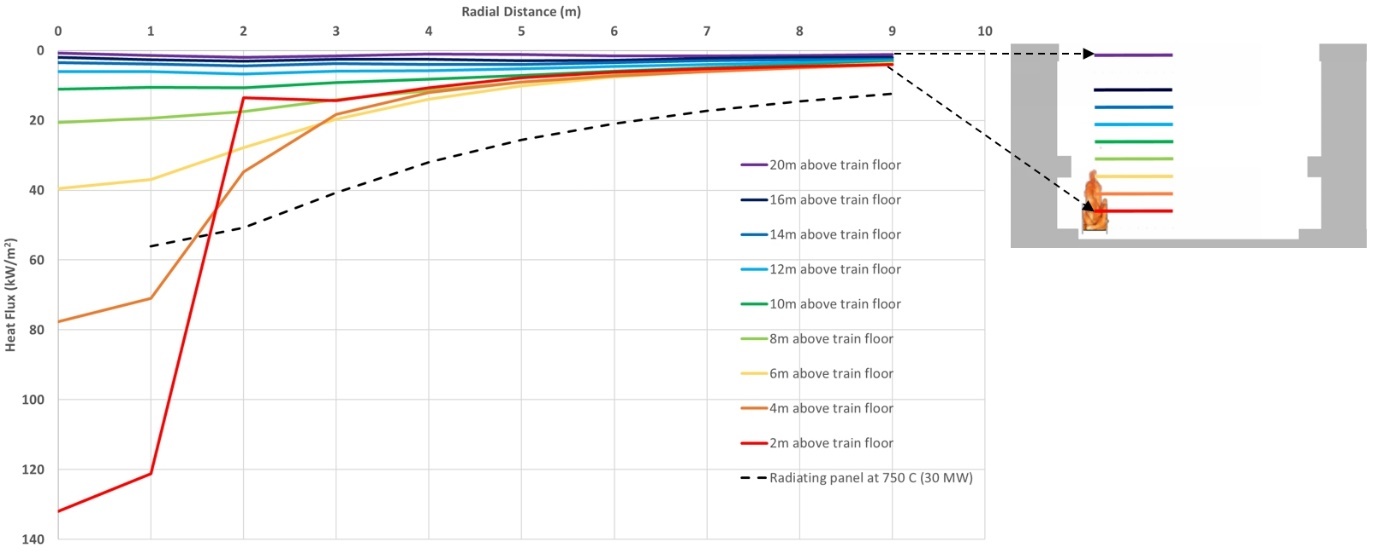
At a height of 4.0m above the train floor and a horizontal distance of 4.5m from the train centreline the predicted radiative heat flux is 15 kW/m2 with FDS, 30 kW/m2 with the analytical (radiating panel) method, and 28 kW/m2 with Torch-ML. The differences in results between the three models are primarily due to shape of the flame and the way shadowing is modelled. The results with the radiating panel are included for comparison, however, it should be noted that this model does not include any shadowing effects and is therefore an unduly onerous representation of the design fire curve shown in Figure 2.
Summary of radiative heat flux
Figure 11 is summary of all predicted radiative heat flux results with the intermediate prop removed, covering different fire scenarios and modelling tools. The radiative heat flux results from the sensitivity study using a 45 MW fire for the scenario with the train roof burnt out are also included in Figure 11.
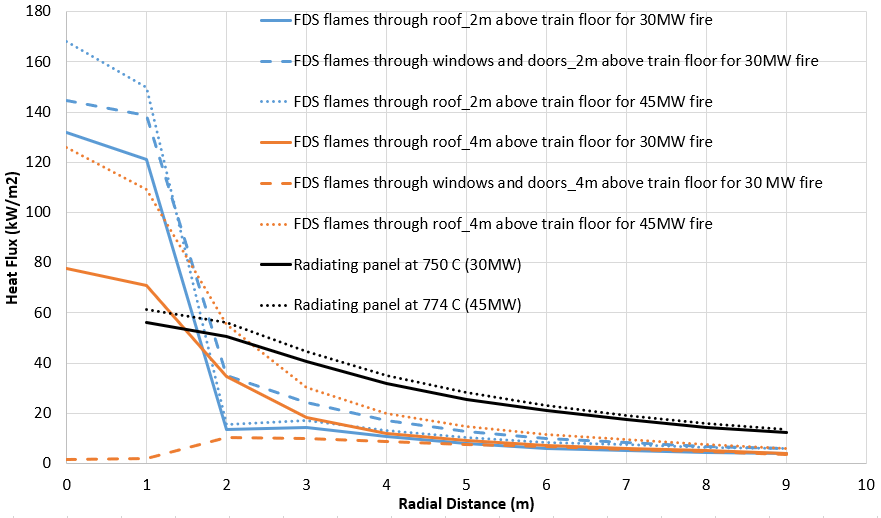
Based on the results summarised in Figure 11, the distances from the train centreline to limit radiative heat flux for the 30 MW design fire are shown in Table 1.
| Maximum radiative heat flux | 15 kW/m2 | 20 kW/m2 | 30 kW/m2 | 40 kW/m2 |
|---|---|---|---|---|
|
Distance from train centreline |
4.5 m |
3.5 m |
2.5 m |
2.0 m |
Gas temperature – train fire with train roof burnt through
Figure 12 shows the temperature slices from FDS for a fire under the intermediate prop and for a fire without the obstruction of the intermediate prop.
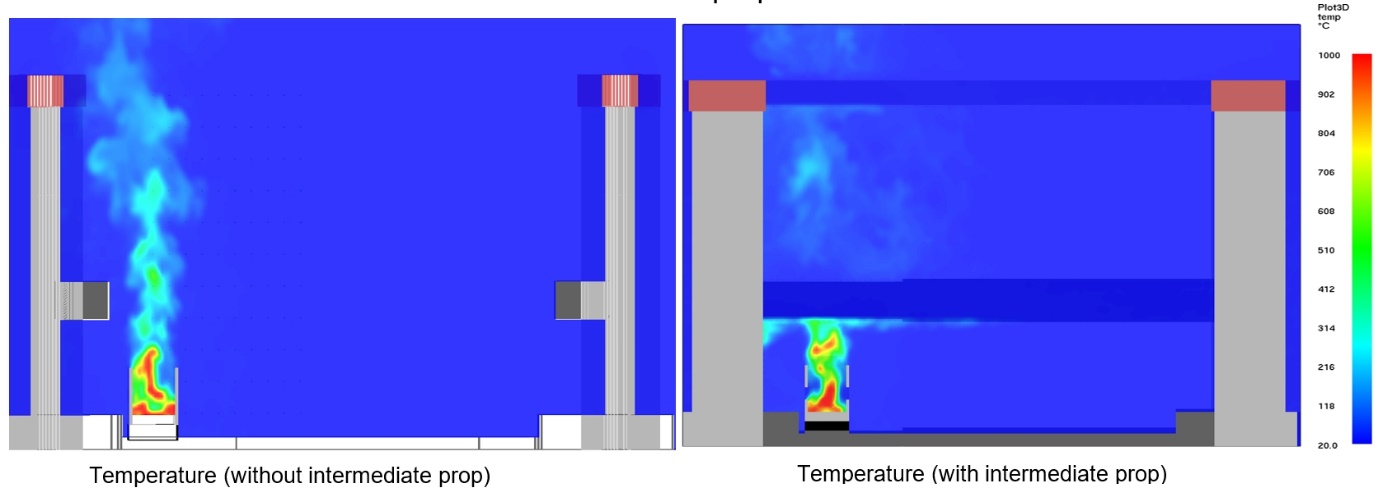
The plume temperature shown in Figure 12 (a) can be compared with predicted temperatures from empirical correlations. For the far-field of a rectangular fire source (above a height more than five times the width of the fire), the plume can be approximated by an axisymmetric plume [5]. Using these correlations, the mean centreline gas temperature beneath the intermediate prop (6 m above the train floor) is 723 °C, and beneath the top prop (19.8m above the train floor) is 138 °C. Mean centreline gas temperatures of 300 °C and 500 °C occur at 11.4m and 7.9m above the train floor respectively. The radial distance from the fire centreline to the edge of the plume at these two heights is 2.1m and 1.7m, respectively.
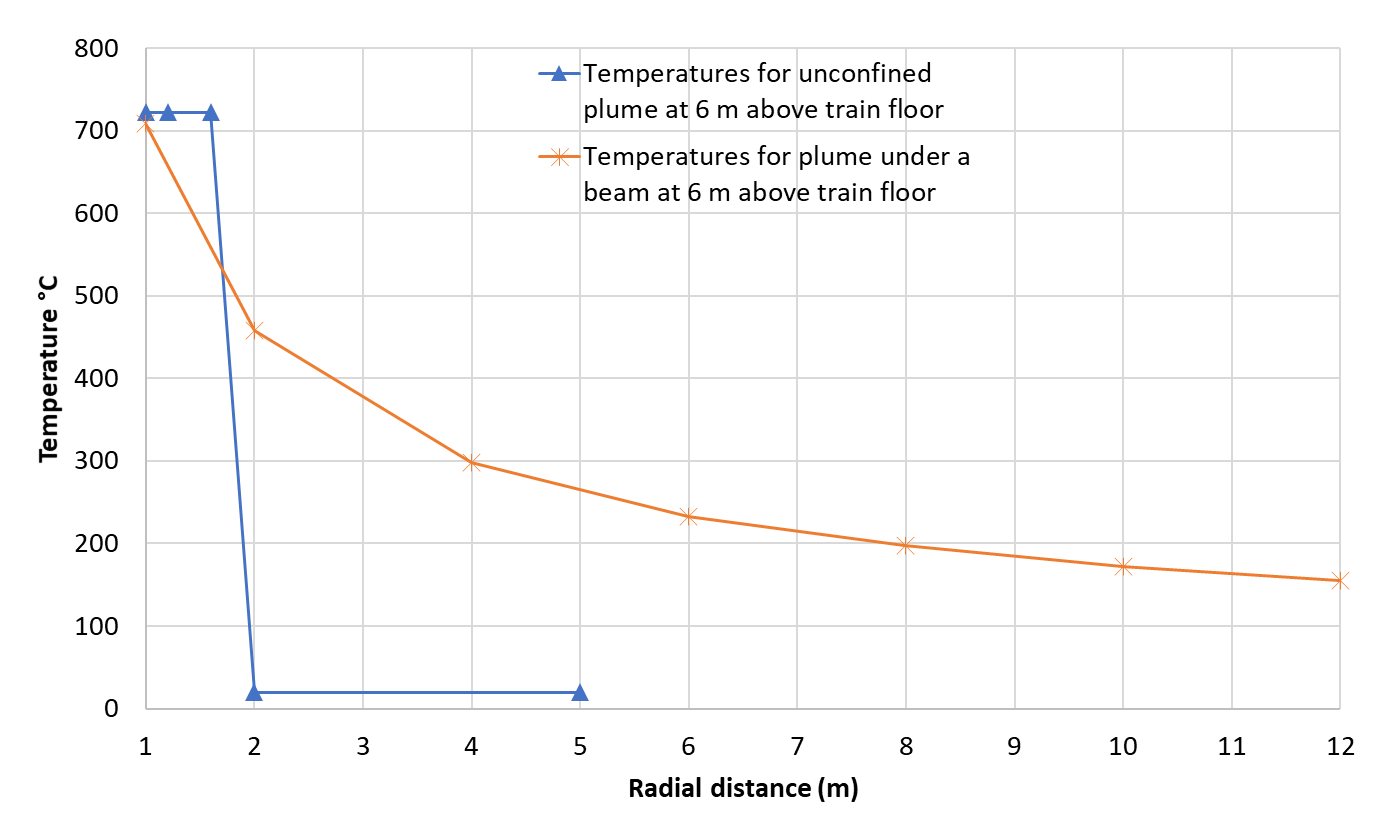
The temperatures shown in Figure 12 (b) can also be compared with predicted temperatures from empirical correlations based on temperature for a ceiling jet. Figure 13 shows the temperatures at 6.0m above the train floor with radial distance, comparing the temperature correlations an unconfined plume with those of a ceiling jet [5]. For an unconfined plume the temperatures drop to ambient temperatures when the radial distance is beyond the plume radius as per the assumption of ideal plume [6]. The ceiling jet correlation shows temperatures underneath the prop reduce gradually with the increase in the radial distance.
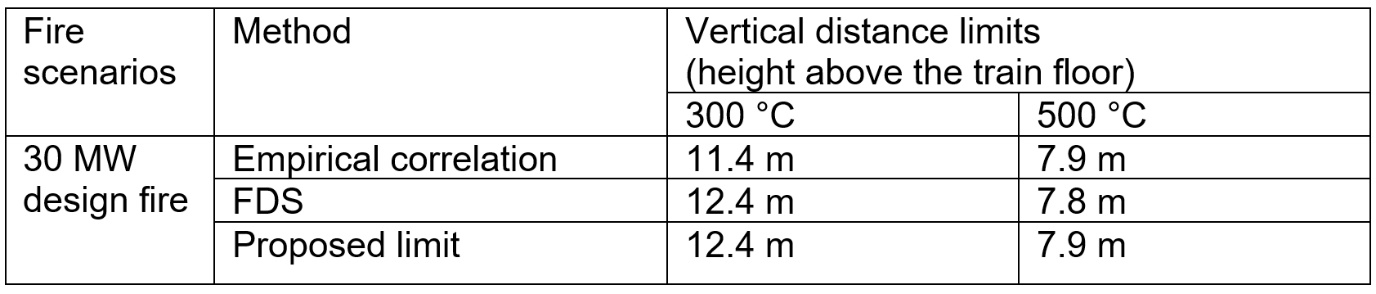
Summary of gas temperatures
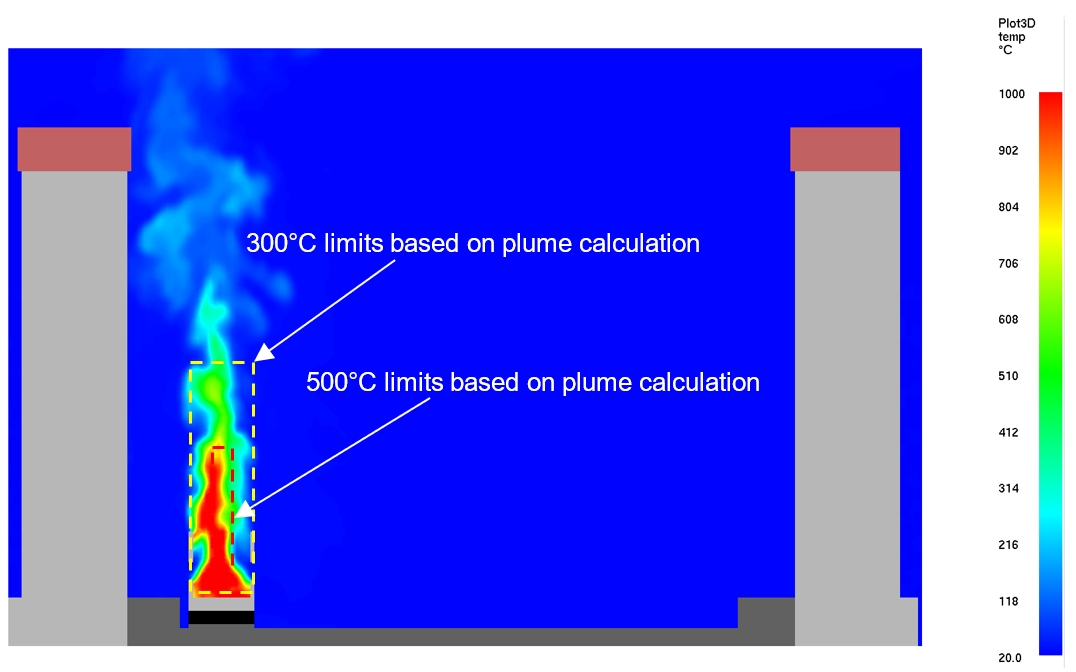
Table 2 summarises the predicted temperatures with empirical calculations and the FDS results. Based on these, the distances (vertically above the train floor) to limit temperatures to less than 300 °C and 500 °C for the design fire (30 MW) are shown. Figure 14 illustrates these temperatures and distance limits on a vertical plane.
Stage 3 – Concrete temperature for open structures
It will be shown in this section that the predicted heat fluxes from the previous modelling analysis lead to much lower temperatures, temperature gradients, and rates of temperature rise than exposure to either the Eureka or standard time-temperature curves. Designing these structures to meet the standard or Eureka curve is therefore excessively onerous.
It is not within the scope of this assessment to evaluate the effects of high temperatures on the residual strength of structures; the methodology outlined here is used to identify appropriate criteria for spalling such that appropriate structural design (including fire impacts and loss of strength) can be undertaken.
Criteria for spalling
Spalling testing is generally undertaken against nominal time-temperature curves (e.g. standard, hydrocarbon, or Eureka) for enclosed structures. Almost all spalling test data are obtained from testing against one of these curves.
According to literature references [7, 8, 9, 10, 11], and in the absence of specific test data, the following criterion is proposed:
T concrete, max < 300 °C no spalling, concrete undamaged
If maximum concrete temperatures are predicted to exceed 300 °C then the risk of explosive spalling is increased, and the structure should be assessed for spalling against either the standard or Eureka time-temperature curve.
Assessment of temperatures within concrete at open structures
Spreadsheet analysis of heat transfer at the concrete surface and conduction within the concrete is used to predict the temperatures within the concrete.
The train fire scenario was the same as that assumed for a tunnel fire structural fire assessment, with temperatures modified to reflect the reduced temperatures and heat fluxes set out through the modelling analysis. The boundary conditions of concrete properties and heat transfer parameters are based on. Moisture content (site dependent) is assumed to be higher than 3% and ambient air temperature and initial concrete temperatures of 30 °C are used.
It should be noted that the one-dimensional model does not account for the spalling effects on concrete, the loss of material etc. The intent is to predict when spalling is not expected to occur and structual fire protection is not required. The case of both derailment and fire is not considered.
Temperature calculation
A time dependent finite difference scheme with radiative and convective heat transfer at the concrete surface allowed temperatures within the concrete to be calculated.
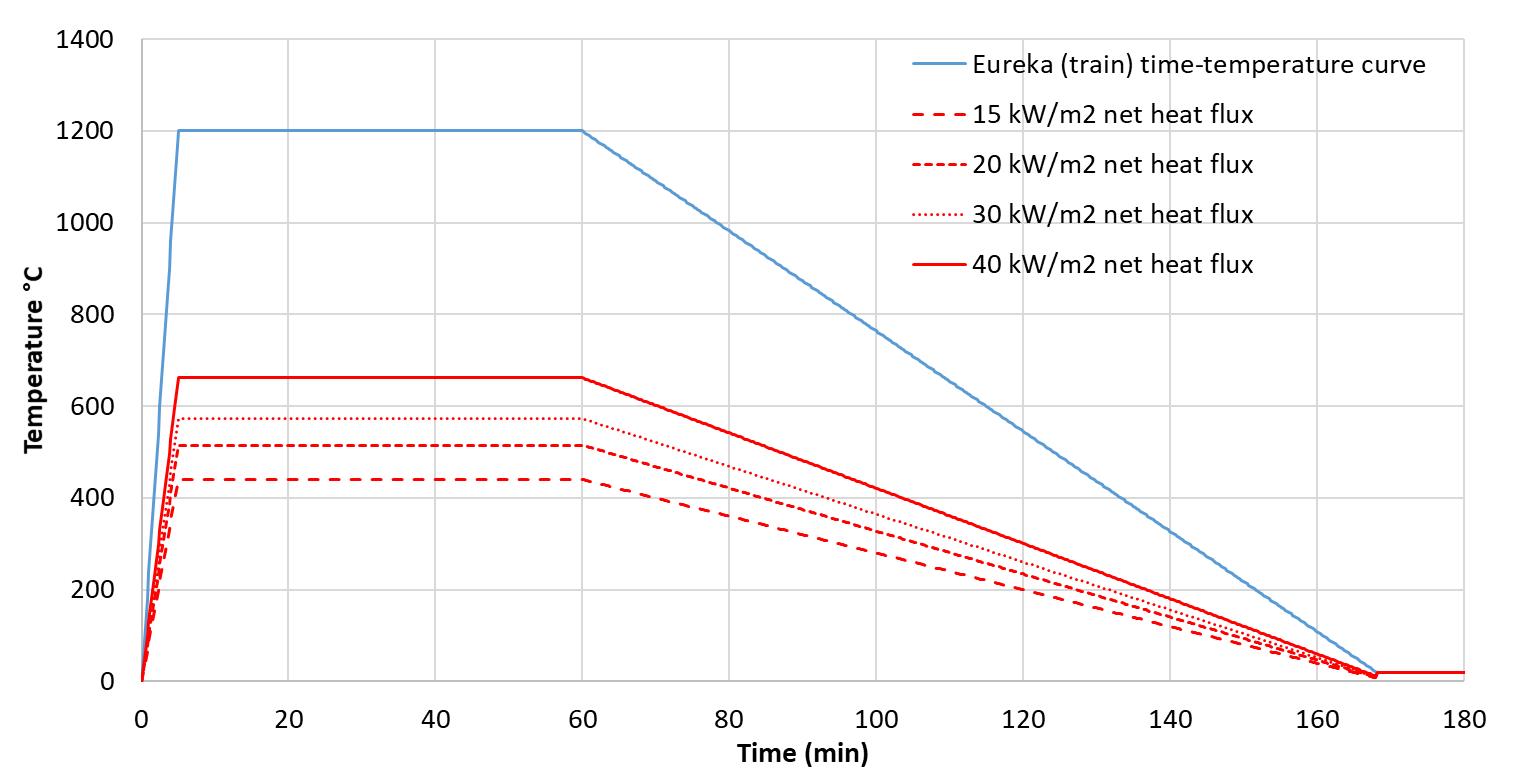
Figure 15 is a comparison of the Eureka time-temperature curve and typical reduced Eureka time-temperature curves that result in net heat fluxes of 10 kW/m2, 20 kW/m2, 30 kW/m2 and 40 kW/m2 when radiative heat transfer dominates over convection.
Therefore, the heating scheme imposed on VRCB structures was a reduced Eureka Curve in which the temperature assumed over the period of maximum temperature in the Eureka curve (5 to 60 minutes) was specified based on the typical radiative heat fluxes and ambient temperatures calculated in the previous sections for the structure under consideration.
While convection would be expected to occur from all heated surfaces (losing heat from the structure to the ambient air), calculations were also undertaken for cases without convection as a sensitivity test.
Results
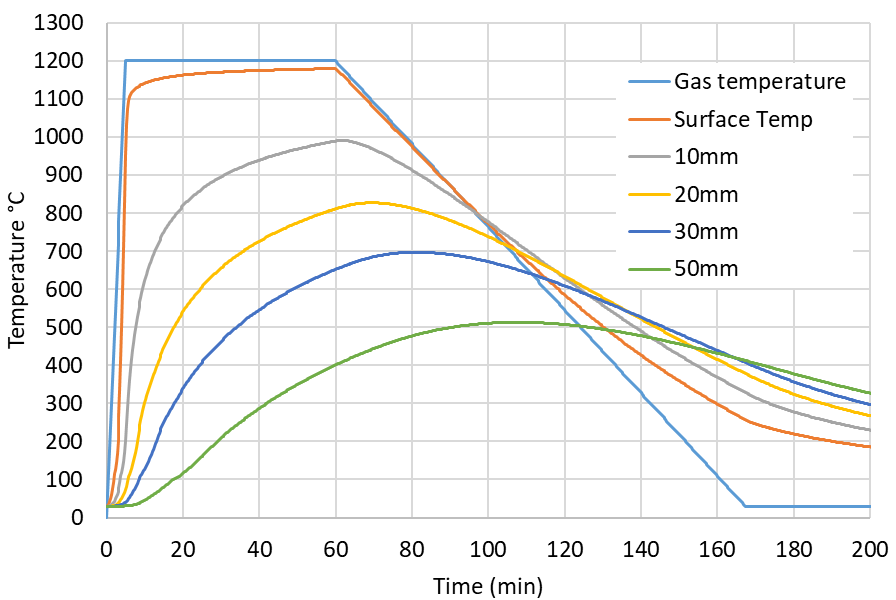
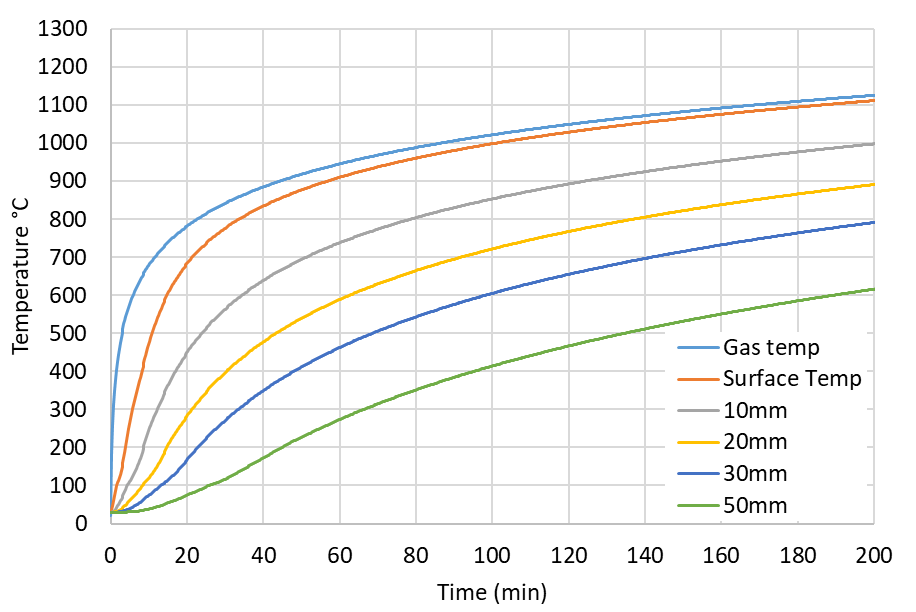
The temperatures within the concrete with exposure to the Eureka time-temperature are shown in Figure 17. Temperatures at the surface exceed 1000 °C within 6 minutes of the start. Temperatures at 50mm depth exceed 300 °C after 45 minutes. The temperatures within the concrete for the standard time-temperature curve are shown in Figure 18.
The temperatures within the concrete for two different net heat fluxes are shown in Figure 19. The net heat fluxes are 15 and 30 kW/m2 to reflect the range of radiative heat fluxes from the previous modelling analysis.
The temperatures in the concrete under heat fluxes typical of those over much of the diaphragm walls in VRCB are significantly lower than those generated by either the Eureka or standard time-temperatures curves.
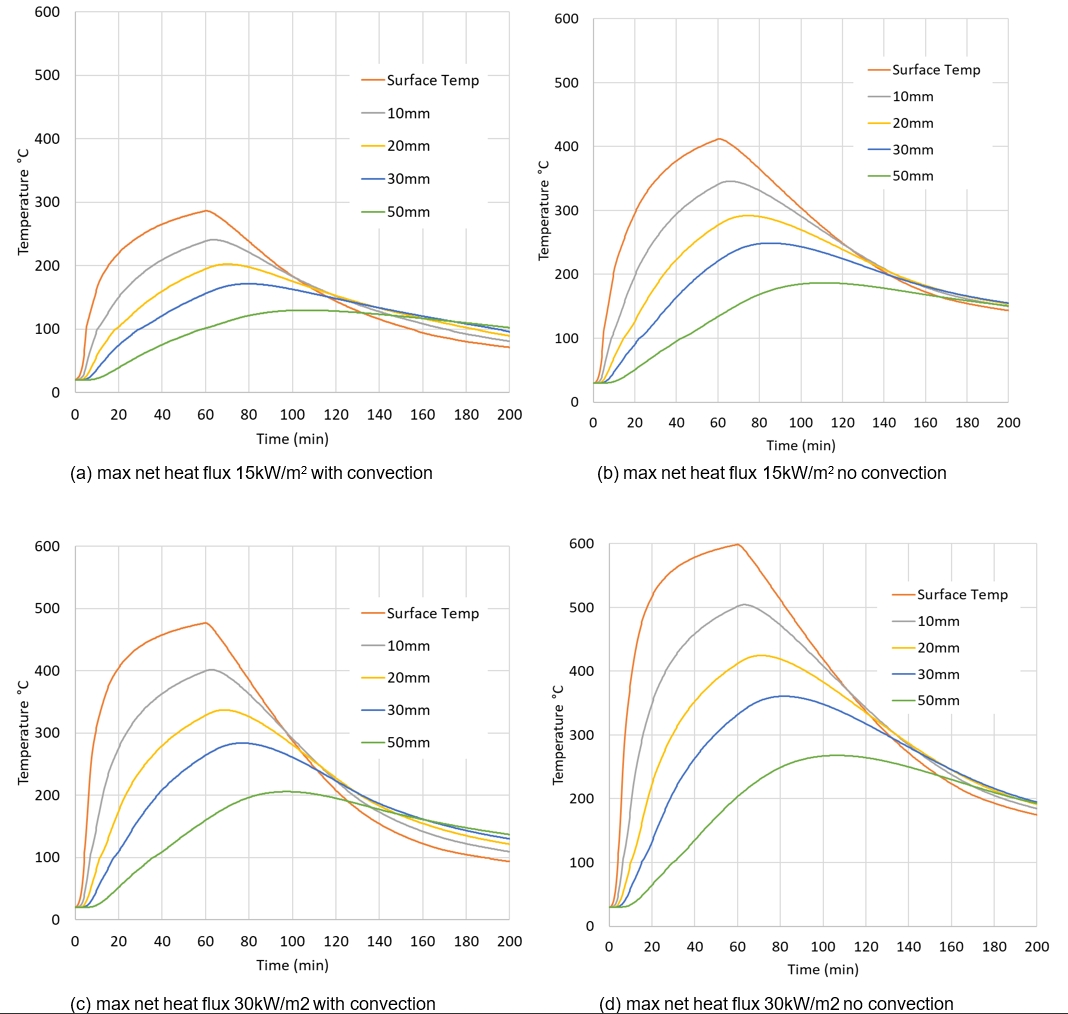
The maximum temperatures at the concrete surface and at a depth of 10mm for net heat fluxes 15 and 30 kW/m2 are shown in Table 3 for cases with and without convective cooling.
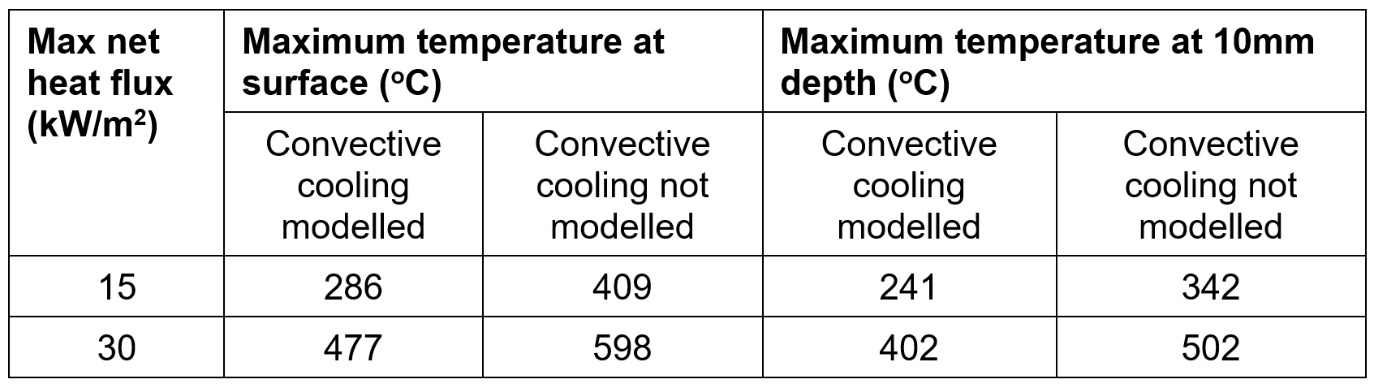
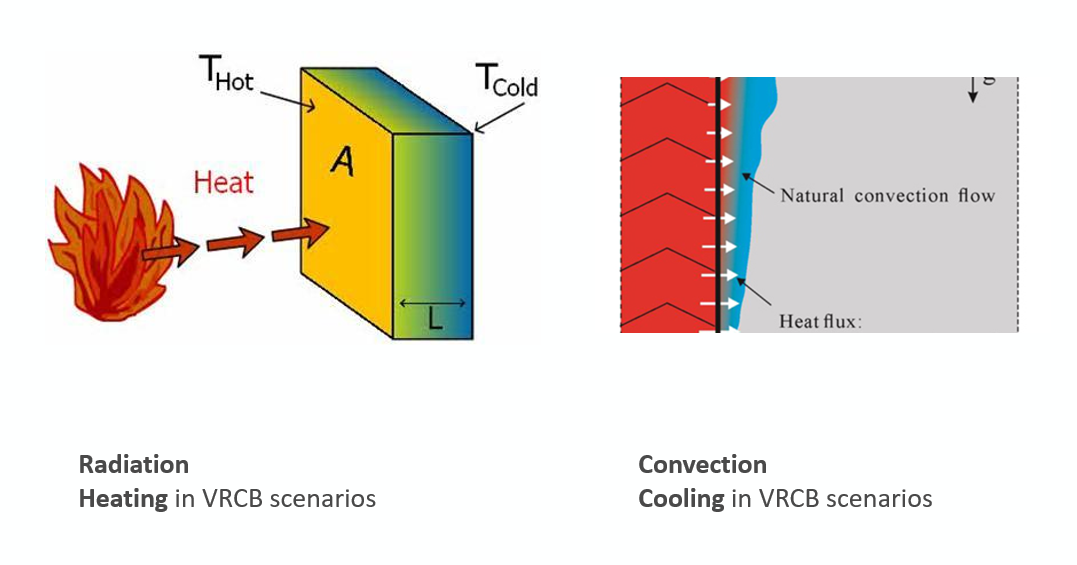
Convection is expected to occur to/from all heated surfaces. For open structures, air temperatures next to the wall are ambient temperatures, which act to cool the wall. Assuming convective cooling is present, net heat fluxes less than 15 kW/m2 will result in all concrete temperatures remaining below 300 oC throughout the fire exposure. Net heat fluxes below 30 kW/m2 result in all concrete temperatures remaining below 500 oC throughout the fire exposure.
If cooling by ambient air is excluded from the analysis, the conclusions would be similar since temperatures within the concrete remain substantially lower than would be the case for either the standard or Eureka time-temperature curves for the heat fluxes considered here.
Therefore, the criteria for open structures to maintain concrete temperatures below 300 oC is concluded to be met on all structures for which net heat flux is less than 15 kW/m2.
Comparison of temperature gradients with standard time-temperature curves
For concrete temperatures higher than 300 oC the likelihood and impact of spalling must be assessed.
A comparison of the maximum spatial and temporal gradients occurring under the different heating regimes has been undertaken. This analysis shows that, notwithstanding the fire scenario being that of a train fire with the associated rate of rise of heat release rate associated with the Eureka time-temperature curve, the gradients generated by lower heat fluxes are lower than those generated by the standard time-temperature curve. It is therefore proposed that the likelihood and impact of spalling for concrete temperatures greater than 300 °C are assessed against the standard time-temperature curve and associated Eurocodes and other relevant guidance.
Table 4 provides a comparison of the maximum rate of rise of the temperature of the surface of the concrete and the maximum temperature gradient within the concrete (assessed between the surface and 10 mm depth) for different net heat fluxes.
Table 4 shows that:
- The maximum rate of temperature rise and maximum spatial gradient are significantly lower than the gradients generated by the Eureka time-temperature curve for net heat fluxes < 30 kW/m2, particularly for rate of rise of temperature of the surface. N.B. Eureka does not define the lower limit of when spalling should be expected.
- The maximum rate of temperature rise and maximum spatial gradient are lower than the gradients generated by the standard time-temperature curve for net heat fluxes
< 30 kW/m2
It is therefore proposed that the standard time-temperature curve is used for assessing spalling risk for all structures for which net heat flux is between 15 kW/m2 and 30 kW/m2. This range of net heat fluxes corresponds to maximum temperatures within the concrete between 300 °C and 500 °C.
| Heating | Convection | Max rate of rise of temperature of concrete surface (K/min) | Max temperature gradient 0 – 10mm depth (K/mm) |
|---|---|---|---|
|
Eureka time-temperature curve |
Convective heating based on local gas temperature |
530 |
75 |
|
Standard time-temperature curve |
Convective heating based on local gas temperature |
60 |
24 |
|
Reduced Eureka time-temperature curve (maximum net heat flux |
Convective cooling based on local temperature |
42 |
7 |
|
Reduced Eureka time-temperature curve (maximum net heat flux |
Convective cooling based on local temperature |
59 |
16 |
The criteria to be applied to open or semi open structures (including VRCB) are therefore proposed as follows:
| Net heat flux | Concrete temperature | Design criteria |
|---|---|---|
|
< 15 kW/m2 |
T concrete max < 300 °C |
Spalling assumed not to occur, no damage to concrete |
|
< 30 kW/m2 |
T concrete max < 500 °C |
Structure should be assessed for spalling based on exposure to the standard time-temperature curve |
|
> 30 kW/m2 |
T concrete max > 500 °C |
Structure should be assessed for spalling based on exposure to the Eureka time-temperature curve. |
Stage 4 – application to VRCB structures
In this section, the spalling risks for each structure element of VRCB are assessed against the criteria proposed in the previous section.
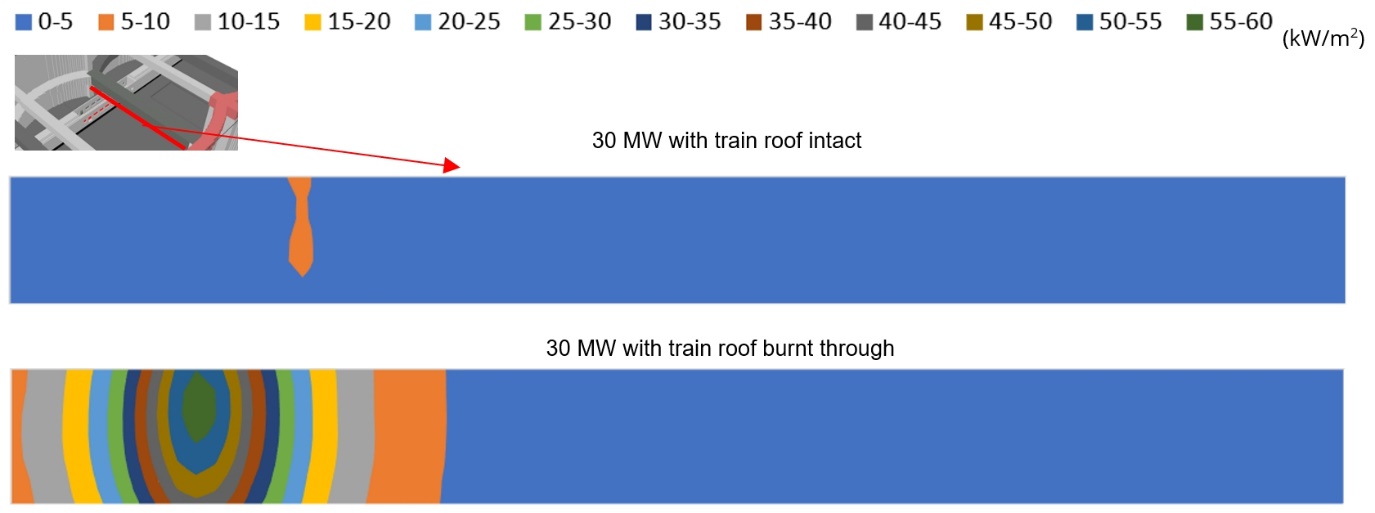
Radiative heat flux at the intermediate prop of VRCB
The radiative heat fluxes beneath the intermediate prop are presented in Figure 20 for the cases with the train roof intact and with the train roof burnt through. For the scenario with the train roof burnt through, the highest radiative heat flux predicted by FDS is approximately 60 kW/m2. For the scenario with the train roof intact, the highest radiative heat flux at the intermediate prop predicted by FDS is 6.0 kW/m2.
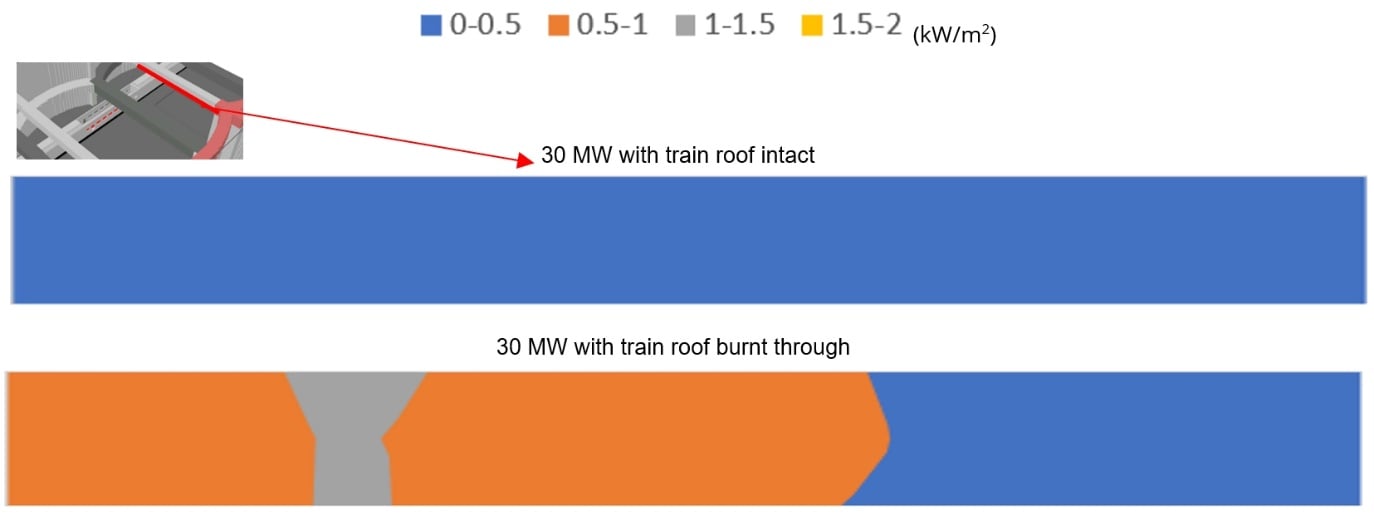
Radiative heat fluxes at the top prop of VRCB
The radiation impact on the top prop is low and the radiative heat flux values on the underside of the prop are less than 1.5 kW/m2 for both scenarios with and without train roof as shown in Figure 21.
Radiative heat flux on the walls and buttresses
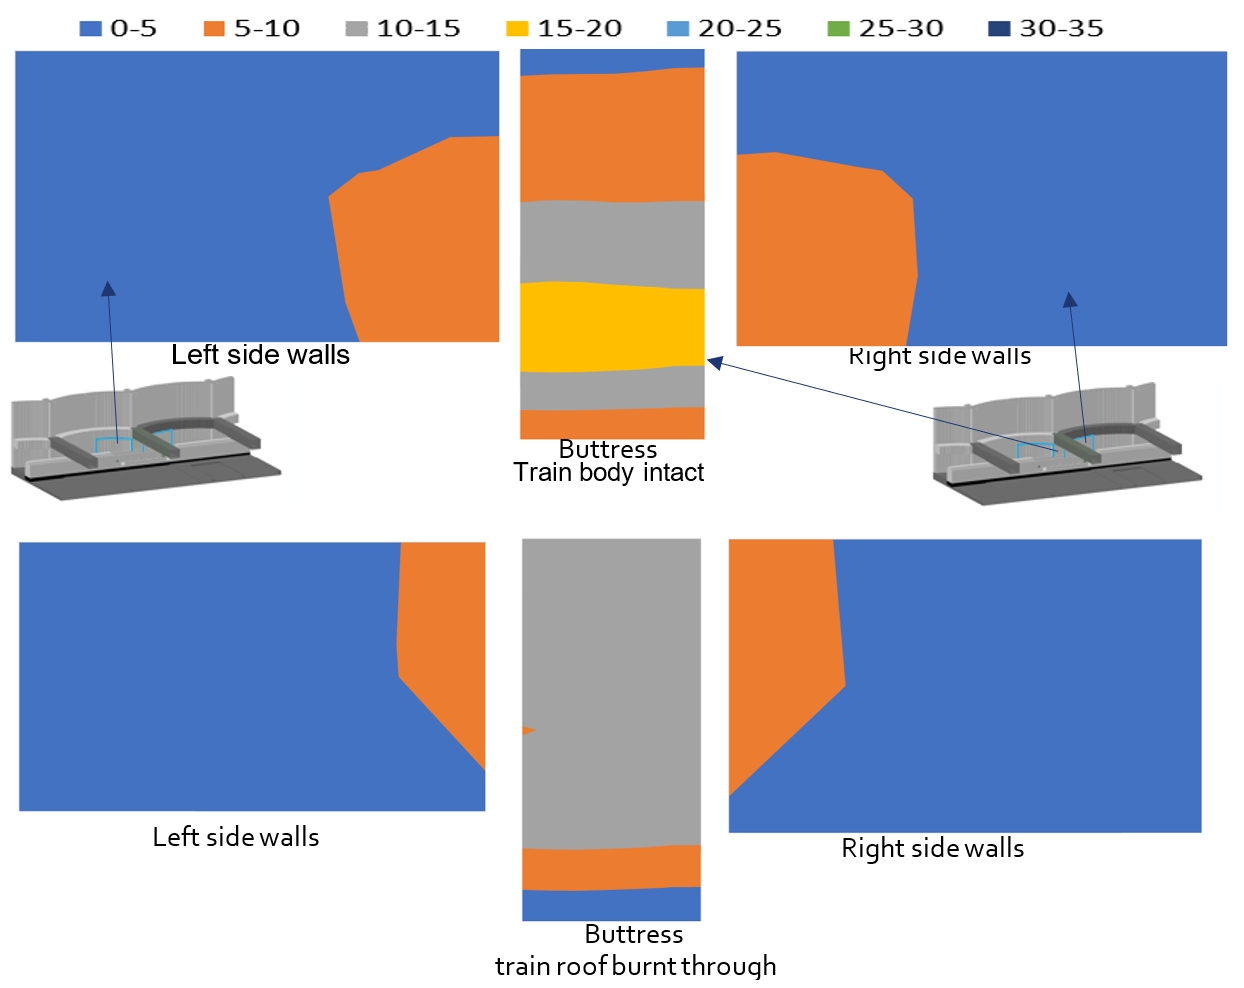
The radiative heat flux on arch walls (right and left sides) and vertical buttresses are presented in Figure 22.
For the scenario with the train body intact, the maximum radiative heat flux at the vertical buttress is approximately 20 kW/m2. This maximum occurs at about the same height as the flame height through the train windows (1.3m to 2.1m above the floor level). For the scenario with the train roof burnt through, a maximum radiative heat flux of 15 kW/m2 is obtained at the vertical buttress.
The radiative heat flux at the arch walls is much lower than the radiative heat flux at the buttress. This is because the distance between the train and the arch walls is further than the distance between the train and the vertical buttress. The closest distance from the surface of the arch walls to the train wall is approximately one metre further than the distance from the surface of the buttress to the train wall. The maximum radiative heat flux predicted by the FDS model at areas adjacent to the vertical buttress is 10 kW/m2 and lower heat fluxes are obtained on other areas of the arch walls.
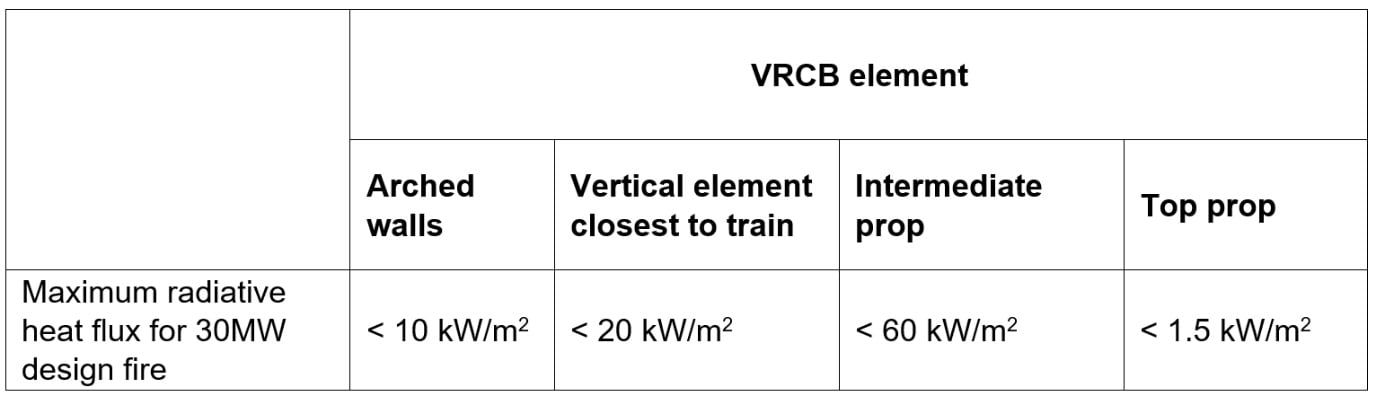
Summary of radiative heat flux on VRCB elements
Convective heat flux impact on VRCB structures
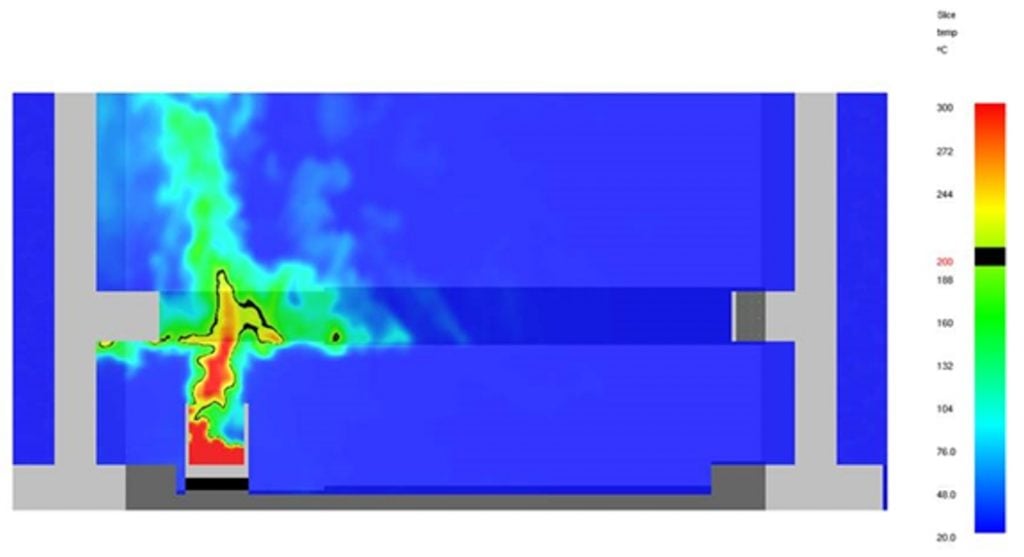
Figure 23 shows gas temperatures distribution for a fire just underneath the intermediate prop. The heating impacts on the structures are listed as follow:
- The heating of the arch wall is by radiative heat transfer (heating), air temperatures next to the wall are ambient temperatures, which act to cool the wall. Based on maximum radiative heat flux of 10 kW/m2, the net heat flux should be less than 15 kW/m2.
- For top prop, the radiative heat flux and gas temperature impacts on the top prop are low due to the shadowing effect from the intermediate prop. Therefore, the net flux should be less than 15 kW/m2.
- For intermediate prop, it is subject to both high radiative and convective heat transfer. The net heat flux will be more than 30 kW/m2.
- For vertical element closes to train, hot gases spread out radially under the prop and higher gas temperatures next to the wall are obtained due to the accumulated hot gases from the ceiling jet flow. Even if a gas temperature of ~500 °C next to the vertical element is considered, the net heat flux will still be lower than 30 kW/m2
Based on the above analysis, Table 7 summarises the recommendations for structures at VRCB.
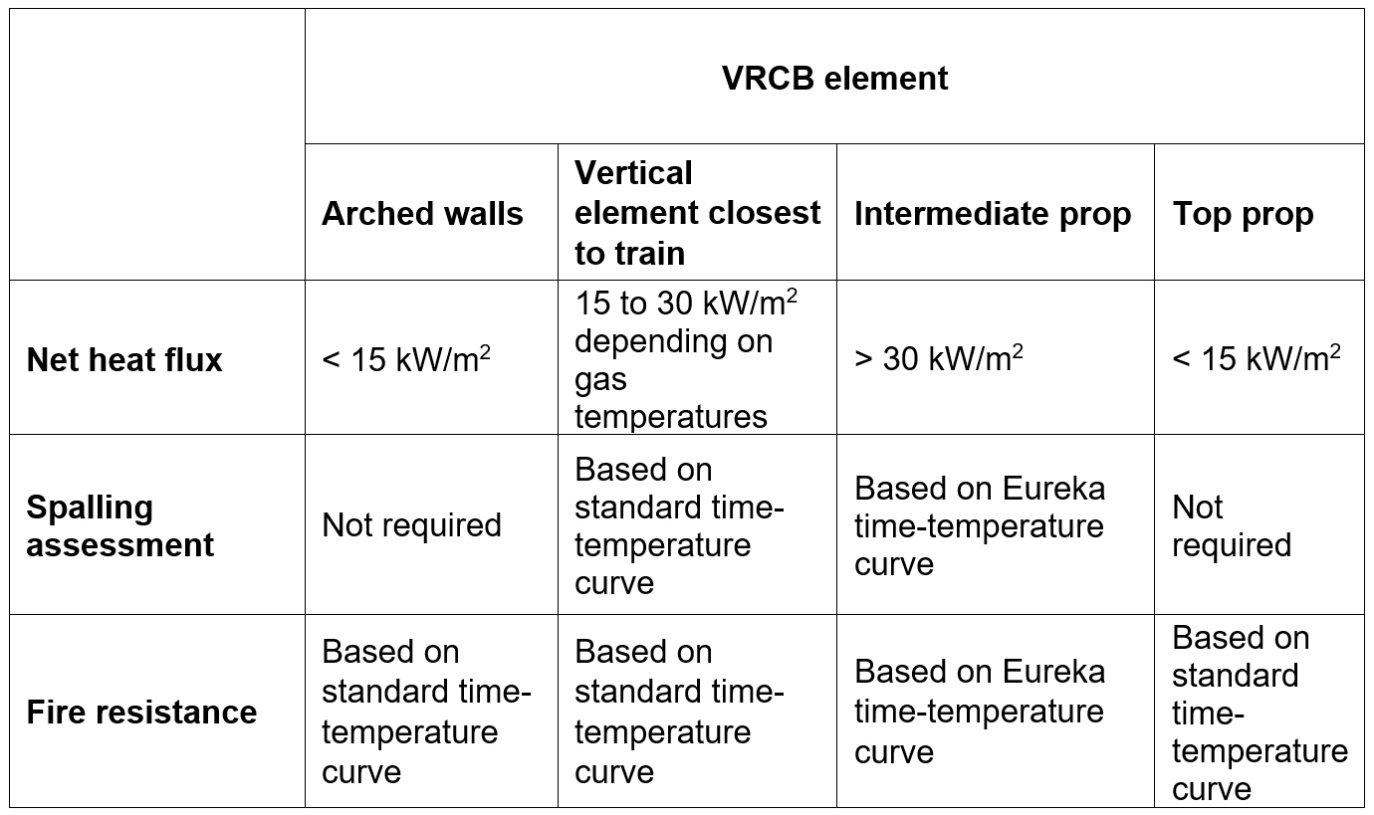
Stage 5 – Lot wide guidance
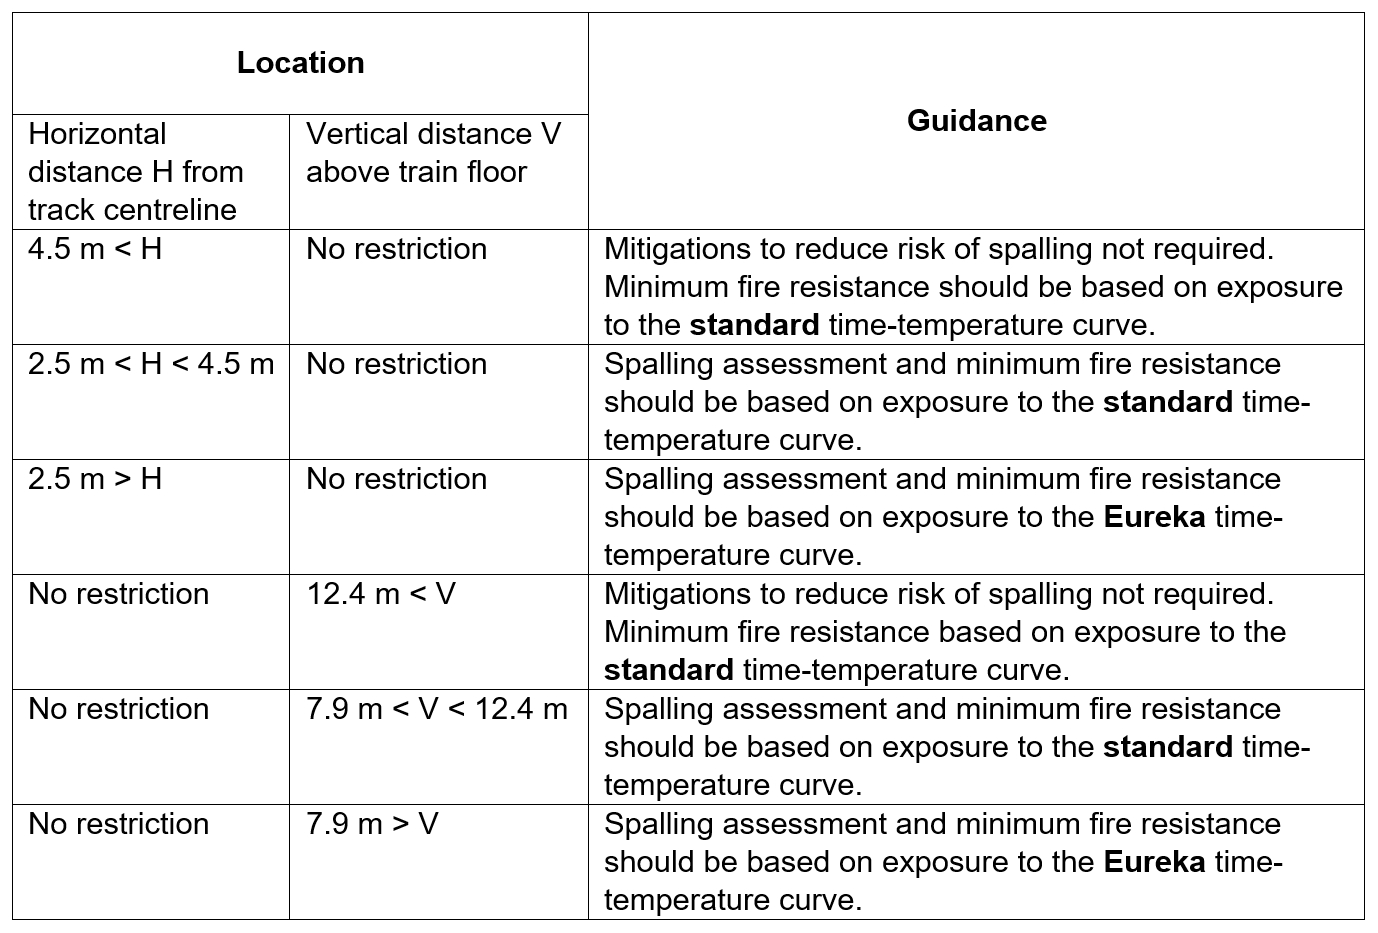
The detailed analysis presented in this paper has been used to prepare the following guidance, shown in Figure 24, for use on other similar open structures in the S1 and S2 contract.
Conclusions
This paper comprises a fire risk assessment of spalling risk from the exposure of underground structures to train fires where the fire exposure may be less onerous than in bored tunnels.
A detailed analysis of the spalling risks in VRCB structures through different numerical modelling approaches has been carried out and recommendations for the structures at VRCB has been summarised. Based on the analysis from different scenarios in VRCB, lot-wide guidance has been developed for spalling risk assessment for other similar underground open structures.
This guidance defines areas where resistance to spalling will require the use of concrete with polypropylene fibres in the mix or other measures to avoid excessive spalling or loss of structural stability. Where the risks of spalling are sufficiently low, the provision of structural fire protection is not required. This allows significant cost and program savings from not requiring polypropylene fibres or alternative measures in these low risk areas. Exercises are currently in progress to generate similar guidance for enclosed structures (such as Euston Scissor Box) and the ventilation shafts.
References
| Title of References | |
|---|---|
|
[1] |
Haukur Ingason, Ying Zhen Li, Anders Lönnermark, Tunnel Fire Dynamics, 2015. |
|
[2] |
Kevin McGrattan;Simo Hostikka;Randall McDermott;Jason Floyd;Craig Weinschenk;Kristopher Overholt, Fire Dynamics Simulator Sixth Edition, NIST, 2015. |
|
[3] |
Arup Fire, Torch-ML User Mannual, Ove Arup & Partners Ltd, 2019. |
|
[4] |
British Standards, PD7974-1 Application of fire safety engineering principles to the design of buildings Part 1: Initiation and development of fire within the enclosure of origin (Sub-system 1), BSI Standards Publication , 2019. |
|
[5] |
British Standards, PD7974-2 Application of fire safety engineering principles to the design of buildings Part 2: Spread of smoke and toxic gases within and beyond the enclosure of origin (Sub-system 2), BSI Standards Publication, 2019. |
|
[6] |
Karlsson, Bjorn; Quintiere, James, Enclosure Fire Dynamics, CRC Press, 1999. |
|
[7] |
K. D. Hertz, “Limits of spalling of fire-exposed concrete,” Fire Safety Journal, vol. 38, pp. 103-116, 2003. |
|
[8] |
Lamont, S.; Lane, B. et al, “A new risk-based approach to predic spalling of ordinary strength concrete walls subjected to fire,” in FIB Fire Conference, University of Coimbra, Portugal, Coimbra, 2007 . |
|
[9] |
Lennon et al., “ BRE 490: Concrete Structure in Fire,” BRE Press, 2007. |
|
[10] |
S. Deeny,;T. Stratfor; R.P. Dhakal; P.J. Moss; A. H. Buchanan, “Spalling of Concrete: Implications for Structural Performance in Fire,” in Proceedings of the International Conference Applications of Structural Fire Engineeing, 2009. |
|
[11] |
“TR 68: Assessment, Design and Repair of Fire-damaged Concrete Structures,” Concrete Society, 2008. |
Notation
| Symbol | Description |
|---|---|
|
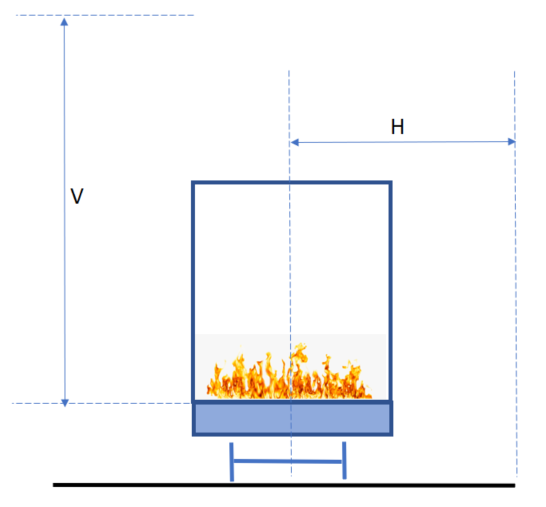
H |
Horizontal distance from track centreline |
|
T |
Temperature |
|
V |
Vertical distance above train floor |
Peer review
- Colin Rawlings, Lead Tunnel EngineerHS2 Ltd