Innovative passive smoke control in Copthall Tunnel
This paper describes a ventilation concept for Copthall tunnel which allows this 600m long tunnel to be naturally ventilated to control pressures, temperatures and control smoke in the event of a fire.
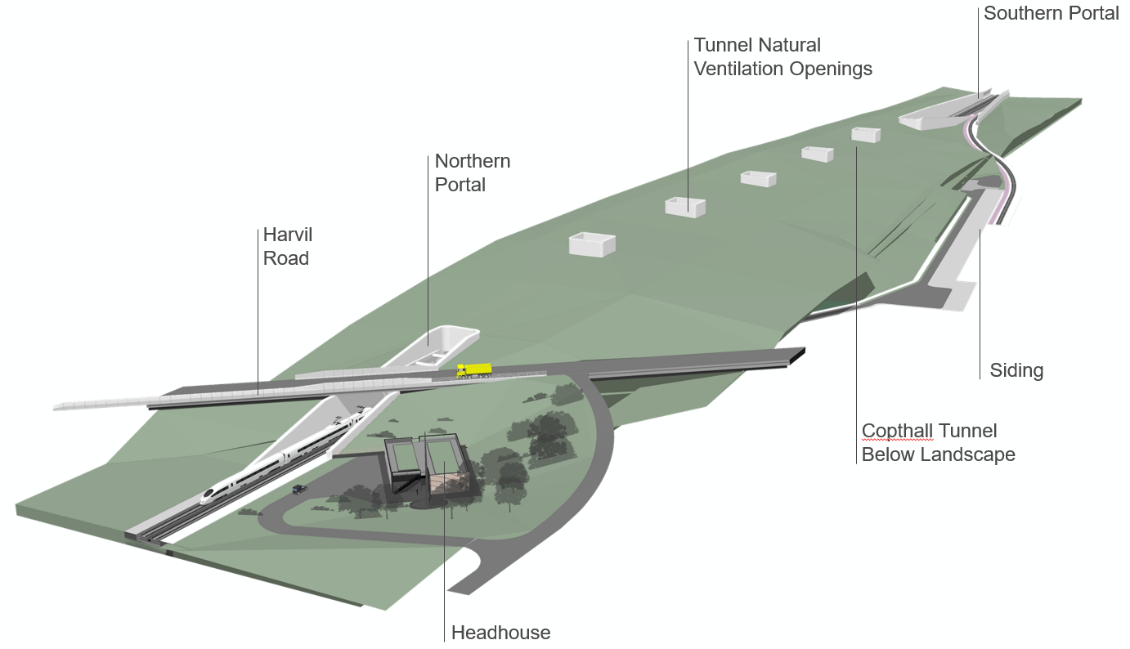
A significant benefit of the tunnel solution for Copthall (when compared with the cutting previously planned at the hybrid Bill stage) is that land over the tunnel can be returned to a useable function, allowing for flora and fauna and the possibility of wider public land use. There are also opportunities to integrate excavated material within the wider landscape design. Usually a 600m long tunnel would require the provision of mechanical ventilation systems for temperature and smoke control. The associated plant and equipment for this mechanical ventilation would have a visual impact and would add to both capital and operational cost.
The proposed natural ventilation approach is based on ventilation openings in the tunnel soffit and through the earthworks above that allow smoke to disperse to atmosphere. The openings are spaced at regular intervals along the length of the tunnel to allow for effective smoke control for any fire location. Like all natural ventilation systems, their effectiveness is strongly influenced by outside wind which might otherwise cause smoke to be blown along the tunnel rather than pass up the chimneys. To mitigate this, a concept was developed that allowed the wind to create a suction pressure at the top of the chimneys and thus help draw smoke out of the tunnel on windy days.
Three-dimensional modelling is used to account for the complex effect of the wind field over the ventilation openings and at the tunnel portals on smoke movement from a train fire in the tunnel. This analysis predicts that the relatively large tunnel cross section allows smoke to rise to high level within the tunnel before dispersing to atmosphere through the openings, thereby keeping escape routes tenable in the event of passenger evacuation, and allow the size and height of the vents to be optimised to create enough suction force.
This innovative passive smoke control concept is a key part of a cost-effective tunnel design that creates green infrastructure and connects to the wider landscape and ecological context.
Introduction
Copthall Tunnel is part of the southern section of High Speed Two (HS2) Phase One – Lots S1 and S2 (Area South) –which includes the Northolt Tunnels and the Euston Tunnel and Approaches, being delivered by the SCS Integrated Project Team.
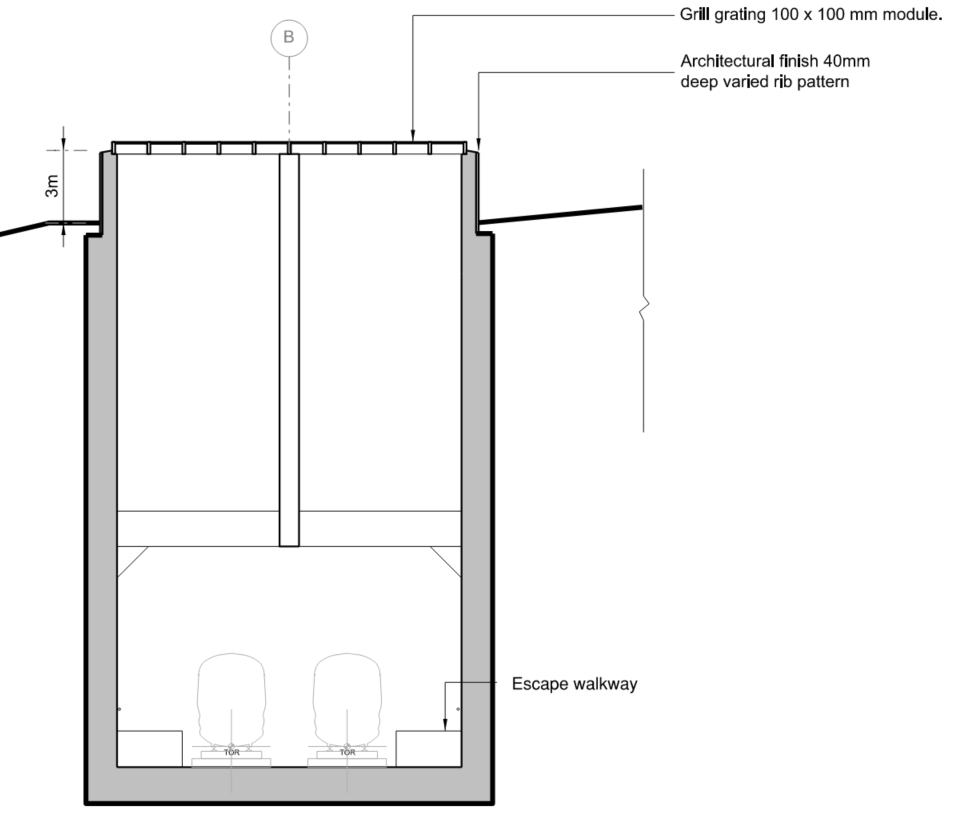
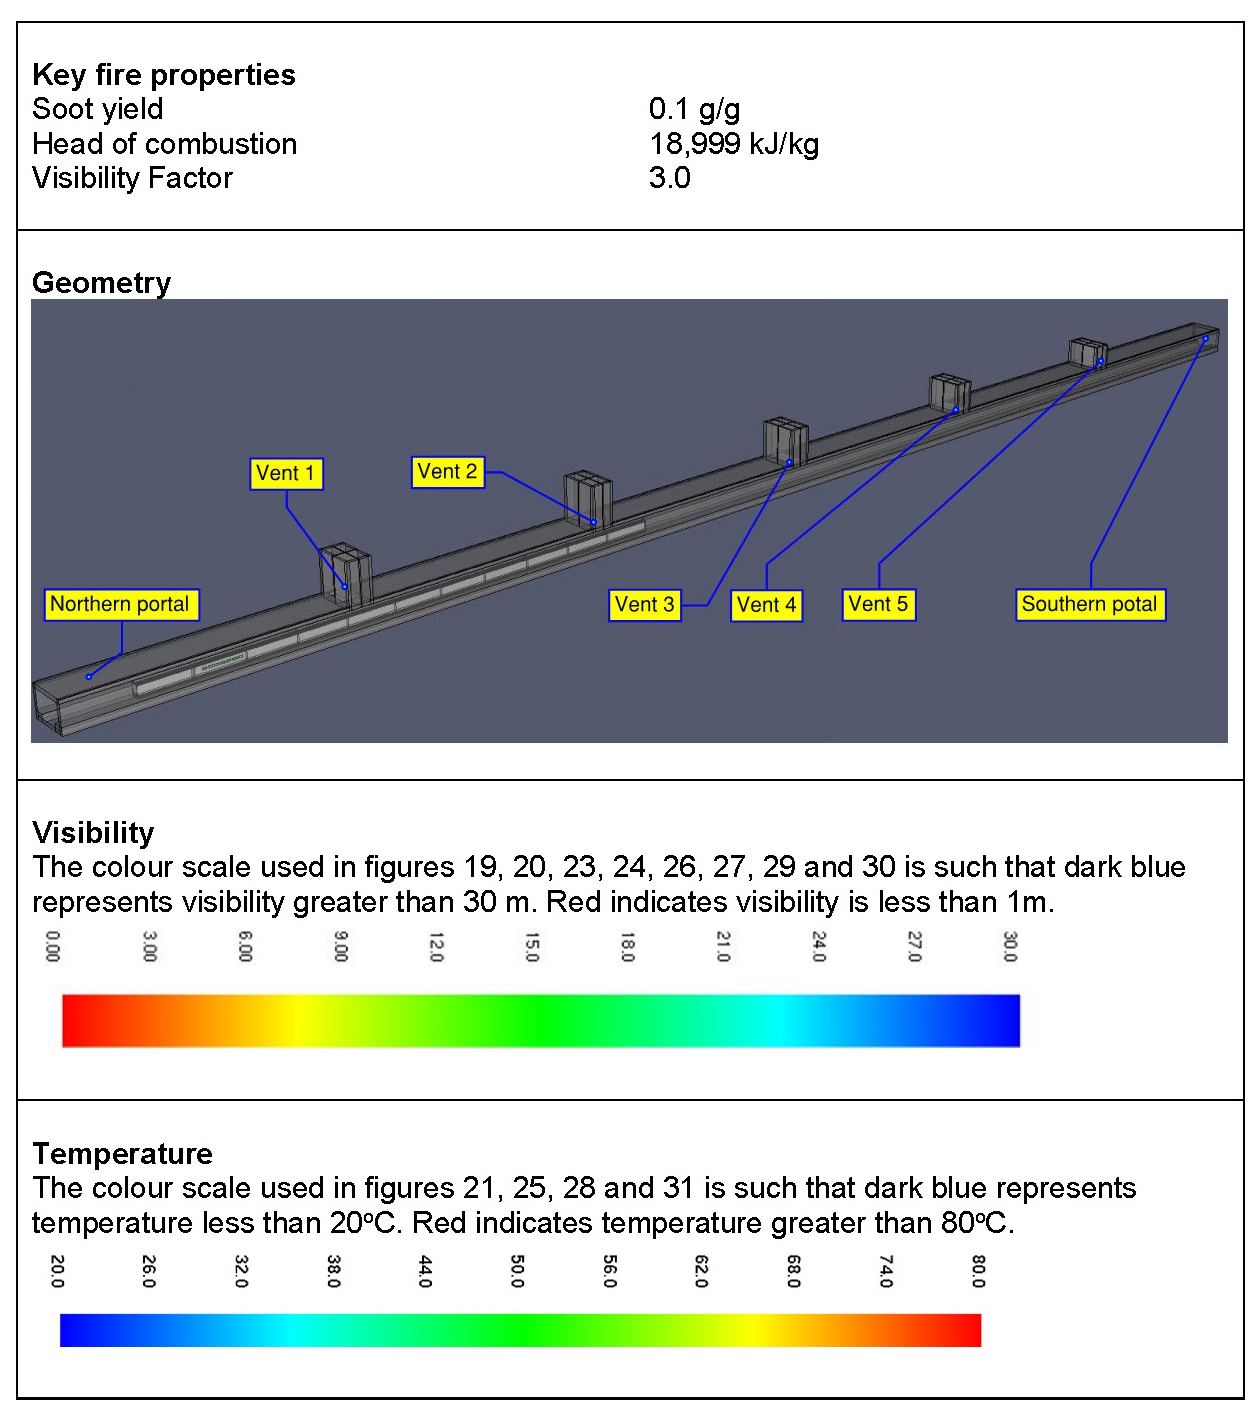
Copthall tunnel is a single cell (twin track) cut and cover tunnel with no central dividing wall, the surrounding environment and visible tunnel features are shown in Figure 1. The tunnel cross section is shown in Figure 2. The tunnel is approximately 600 m long, with the Northern portal and headhouse located at the relocated Harvil Road. Northwest of Harvil Road the tracks are on a viaduct above the Colne Valley.
In the event of a train fire in the tunnel, escape walkways at both sides of the tracks facilitate passenger evacuation to an ultimate place of safety in the hardstanding area adjacent to the headhouse. Smoke control is needed to ensure escape routes remain sufficiently clear of smoke to be usable in the event of a passenger evacuation. In this paper this is referred to as providing a ‘tenable’ environment.
A 600 m long rail tunnel would normally require the provision of mechanical ventilation systems for smoke control, of which the associated plant and equipment would have visual impact and would add to both capital and operational cost to HS2. The natural ventilation approach proposed does not require mechanical plant and takes up much less space and uses no energy.
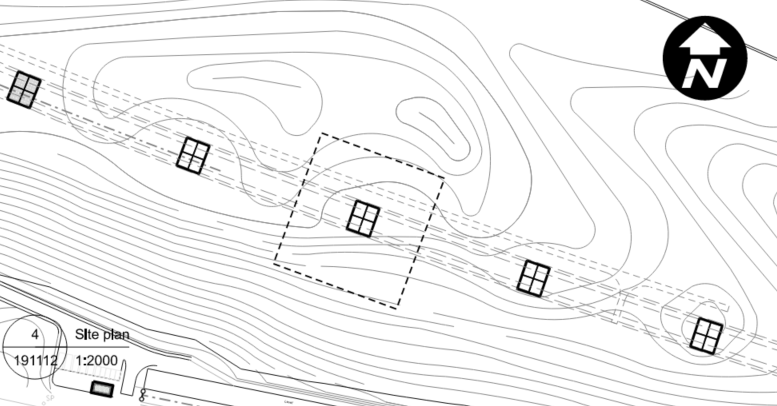
The passive smoke control concept for Copthall tunnel is based on ventilation openings in the tunnel soffit and through the earthworks above that allow smoke to disperse to atmosphere. Five openings are spaced at regular intervals along the length of the tunnel. Figure 3 shows a plan view of a single ventilation opening.
Such natural ventilation systems can work very well on a still day where the hot smoke can form a hot layer at the soffit of the tunnel, travel along the tunnel ceiling and into the ventilation openings. Make-up air would naturally flow into the tunnel from the portals and passengers would be able to evacuate below the smoke layer that would be above their heads. This ventilation concept has been used for millennia prior to the advent of powered ventilation fans. On windy days, however, the wind can enter from the tunnel portals and de-stratify the smoke that would be at ceiling level and cause it to drop and make the evacuation more difficult. However, that same wind would also be passing over the top of the chimneys, and by careful design and location of the chimneys the wind can create a suction effect that helps draw the smoke out of the ventilation openings. Such concepts, however, require a very detailed analysis of flows and pressures using state of the art modelling techniques.
To understand the effectiveness of the proposed smoke control system, 3D modelling of smoke movement in the tunnel, accounting for the complex effect of the wind field over the ventilation openings and at the tunnel portals, has been undertaken. This article describes the methodology and findings from this modelling and the next steps planned for the detailed design stage.
Methodology
Computational Fluid Dynamics (CFD) is used to model smoke movement in this naturally ventilated tunnel. Air movement in this tunnel is sensitive to wind conditions, hence the effect of wind on smoke movement needs to be captured in the CFD modelling.
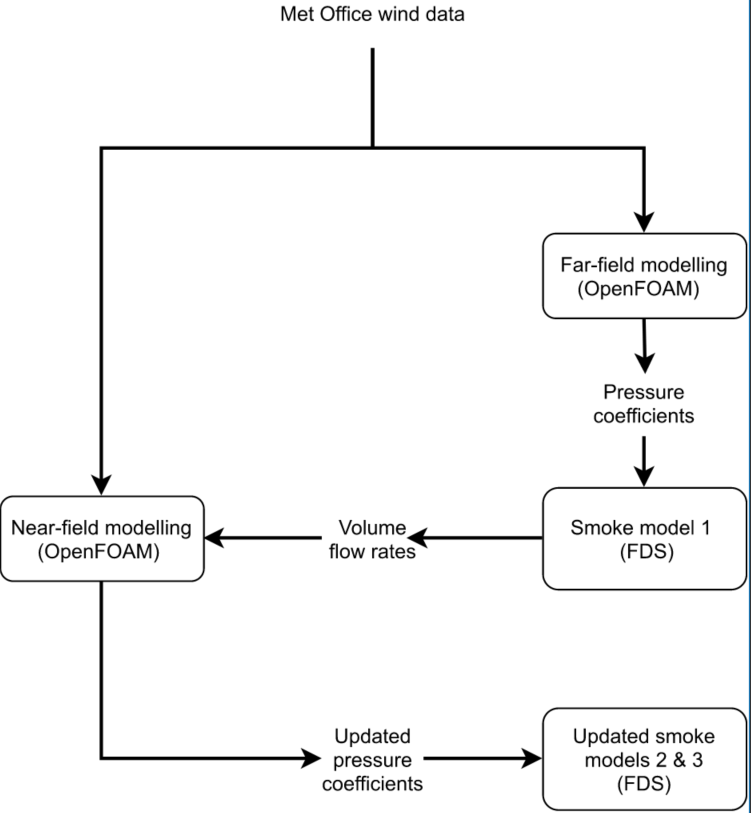
Dedicated CFD models have been built, using the open FOAM CFD code [1], to quantify the following:
- the wind induced pressures acting on the vertical tunnel openings
- the impact of surrounding topography and planting on localised wind speeds.
The outputs of the above models are used to determine boundary conditions (pressure coefficients at the tunnel portals and ventilation openings) for a model of combustion and smoke dispersion within the tunnel, using is the Fire Dynamics Simulator CFD code [2]. This methodology is summarised in Figure 4 below.
Wind conditions and pressure coefficients
Wind and wind-induced pressures, around the tunnels, on the portals and on the ventilation openings have the potential to significantly affect the transport of smoke in the tunnel.
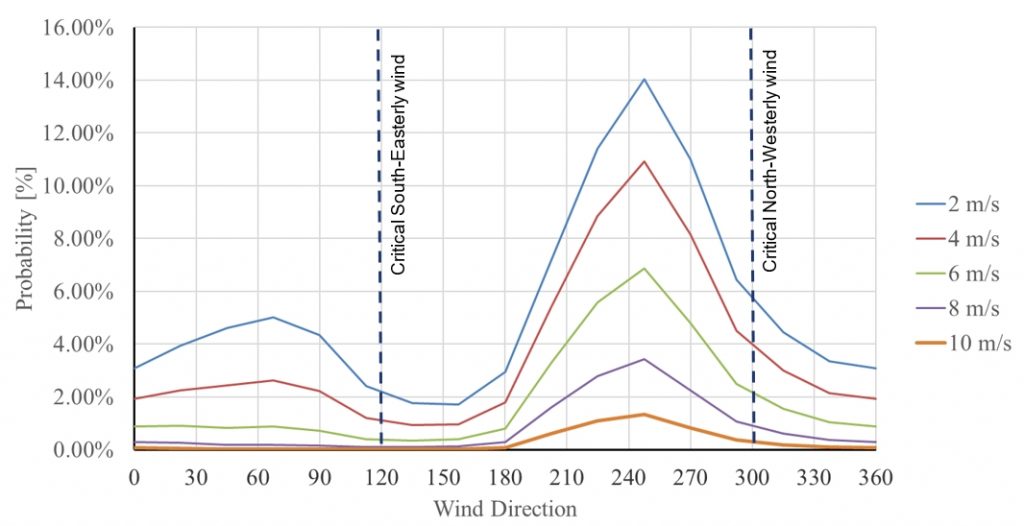
The critical wind direction is when the wind is blowing along the tunnel orientation – North West/or South East. Under these conditions, the windward portal is likely to experience a positive pressure, while the vents shafts and leeward portal are likely to experience a negative pressure. Smoke flow through the tunnel will be driven by these pressure differences and the buoyancy of the hot smoke. Given the alignment of the tunnel, from North-West to South-East, the critical directions, which have the potential to drive flow longitudinally through the tunnel, are those in which the wind is aligned with the tunnel portals (i.e. 120o and 300o).
A likely wind directions and magnitudes are a key input to these types of analyses. Probabilistic wind data for this area are shown in Figure 5. These data show that the wind from the North West occurs approximately 6-7% of the time, and wind from the South East occurs approximately 3% of the time. Thus, 90% of the time, the wind is not aligned with the tunnel orientation.
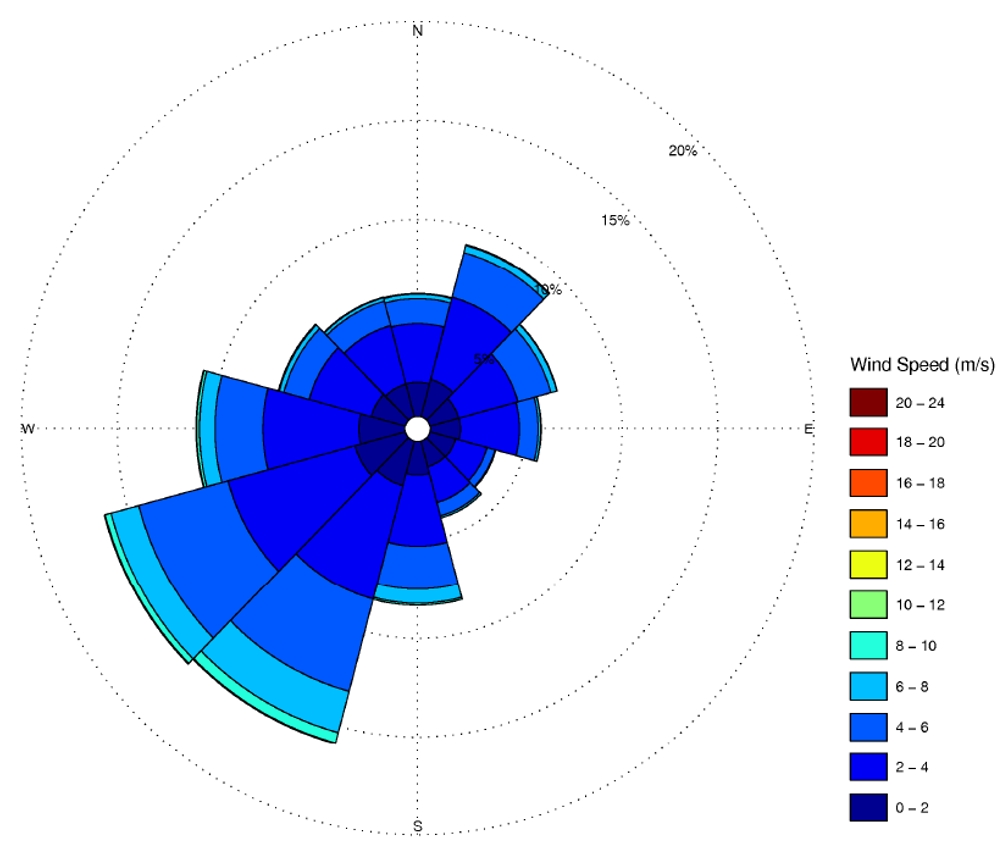
Figure 6 plots the probability of exceedance against wind direction, for a variety of windspeeds. From this figure, the total probability of exceedance of a 2 m/s windspeed, when the wind is aligned the tunnel direction, is approximately 9%.
Near-field modelling of natural ventilation opening and portals
CFD models require the area under consideration (referred to as the domain) to be divided into a number of small cells. The CFD solves physical equations in each of these small cells to provide an overall prediction of the flow characteristics. Whilst it is possible to build a CFD model of the surrounding topography, the inside of the tunnel, the vents and any fire, this would have required tens of millions of cells. Such large models can take weeks for even modern computers to solve. It was therefore necessary to make initial predictions based on several smaller models that could be coupled together to give an indication of the outcome. At the very end a single large model can then be built to confirm that the learning and design that emerged from the smaller models provided for a robust outcome.
A key design feature was the ability of the large ventilation openings to form a suction force when wind passed over them. Near-field modelling of wind induced pressures on tunnel openings was carried out to allow for detailed resolution of separated flow features and interaction of the ambient wind field with flow in/out of the openings.
Simulations were run for a nominally high wind speed on the assumption that results are Reynolds number independent (i.e. flow characteristics not sensitive to wind speed). For more information on modelling of atmospheric boundary layers, refer to [3].
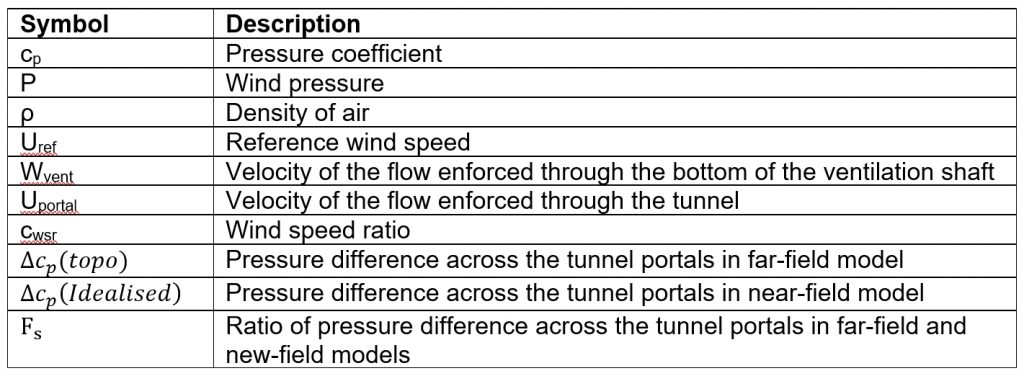
Simulating the near field of the tunnel openings at a nominal wind speed allows us to express a wind pressure on these structures as a dimensionless pressure coefficient cp:
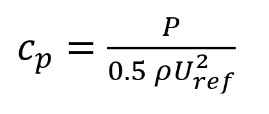
where P is the wind pressure, ρ is the density of air, and Uref is the reference wind speed, taken at a height of 10m above the ground.
The majority of the CFD simulations were steady state Reynolds Averaged Navier-Stokes (RANS) simulations using the k-Omega SST turbulence model [4] for 1500 iterations, using OpenFOAM version 1706 (ESI release). For more information on the numerical methods used in OpenFOAM, refer to [5]. Such a RANS approach can provide for slightly less realistic predictions that other techniques but can be carried out very quickly. Given the inherently transient nature of the flow, a Large Eddy Simulation (LES) was used to confirm the reliability of the steady state RANS approach. Results from the RANS model were found to be slightly more conservative than those obtained from LES simulations. For the critical wind direction, the difference between the results of the simulations differs by less than 4%, therefore the use of RANS simulations is appropriate.
The near field models consider a simplified geometry around the feature of interest. See Figure 7 for an example of vent and portal geometry and domain. These features terminate at a boundary located some distance within the tunnel/vent (referred to herein as the interface boundary).
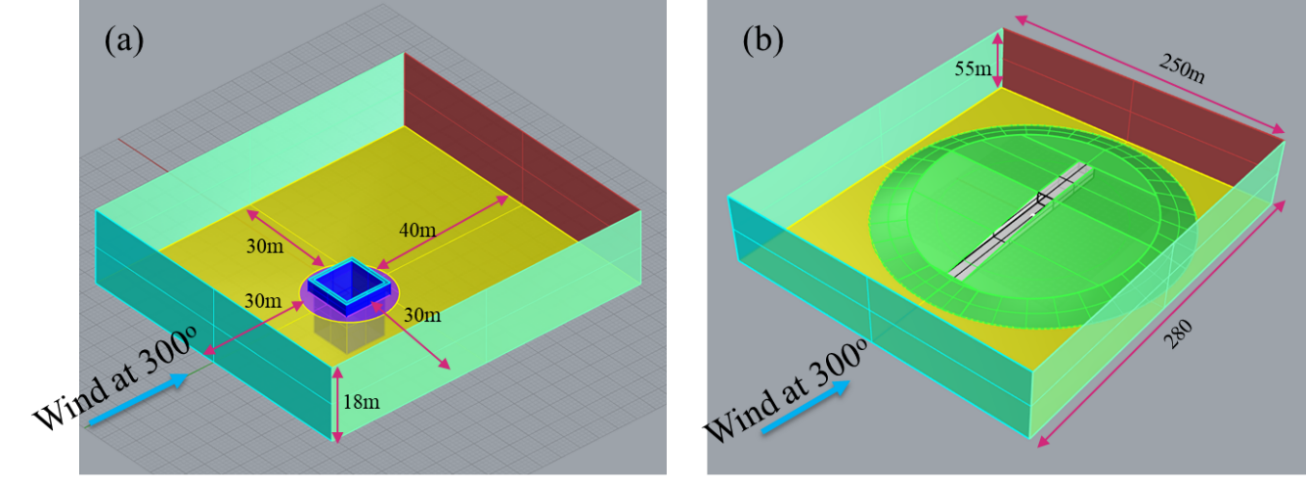
The ventilation openings as modelled have dimensions of 13 m x 7.6 m x 3 m (where the longer dimension was perpendicular to the tunnel direction) and a wall thickness of 0.8 m. These dimensions were chosen to maximise suction while maintaining the 100 m2 cross section required by the Aerodynamic assessment.
The size of the domain was sized based on the guidance of Blocken (2015) [6]. The near field models had 5 million and 10 million cells, for the ventilation shaft and tunnel portal, respectively.
Flow through the portal and ventilation shafts may modify the wind pressures. To obtain the variation of the pressure coefficient with through flow, a variety of flow rates have been imposed on the interface boundary.
Ventilation openings
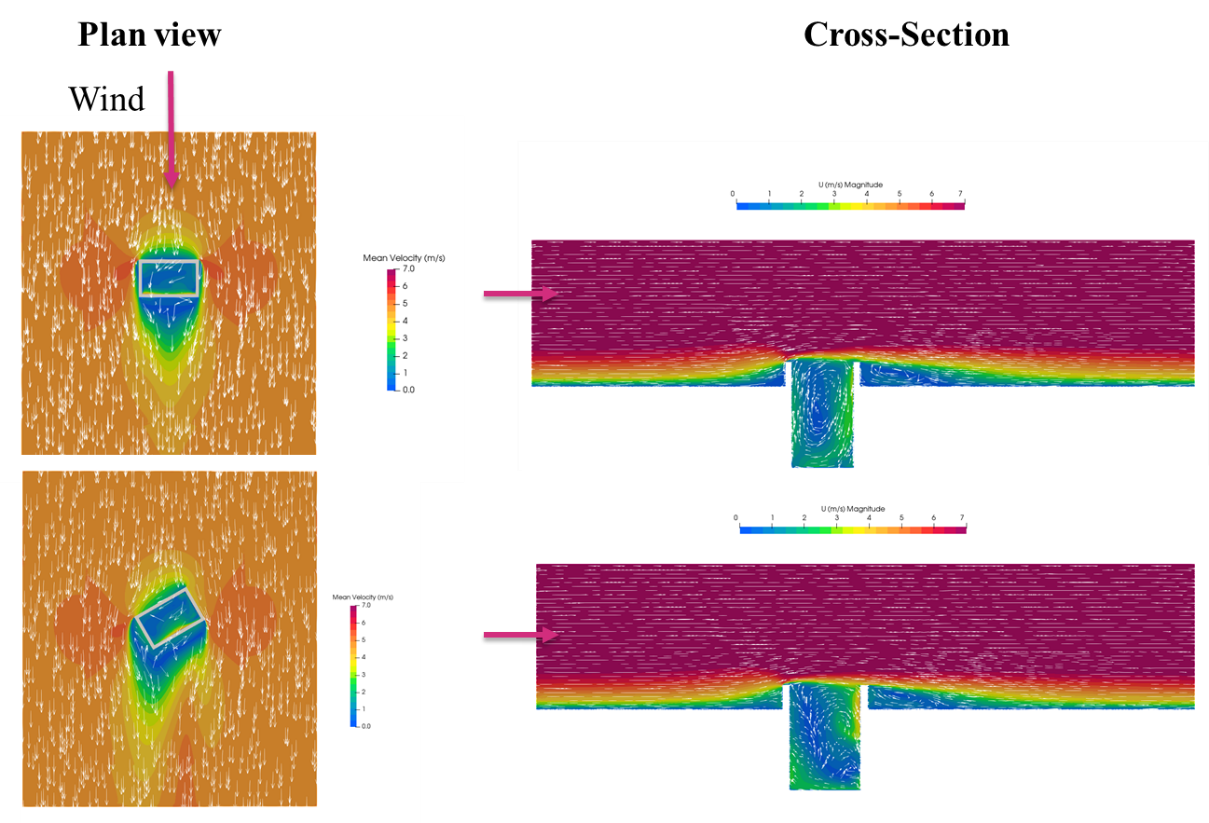
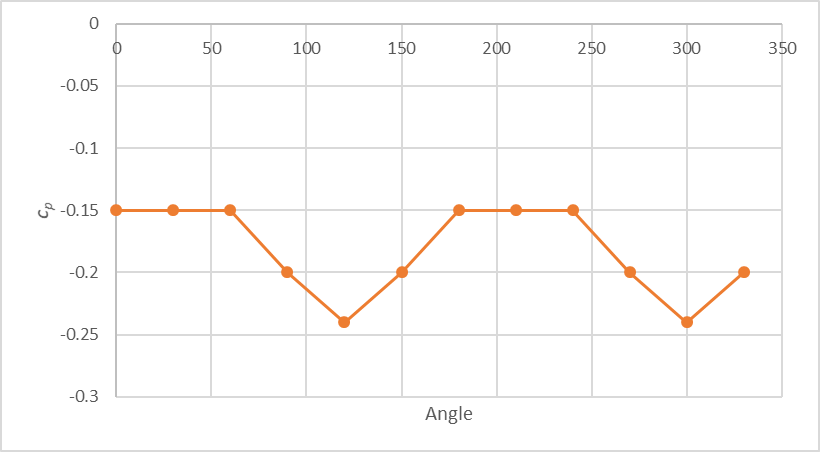
Simulations were carried out for 12 wind directions (see Figure 8 for examples of flow behaviours within and around the shaft), confirming that the wind induced suction was maximised when the long edges were perpendicular to the wind direction, see Figure 9. In Figure 9 a negative pressure denotes a suction force and hence a desired outcome. The more negative the coefficient, the more suction force that would result. These runs were carried out assuming no up flow through the vents. Thus, aligning the vent long edge of the vent shaft perpendicular to the tunnel would maximise the suction in the case where the wind was aligned with the tunnel (highly challenging case). Therefore, wind from 120o and 300o can be considered to be perpendicular to the long edge of the vent shaft.
The near constant pressure coefficient between angles where the wind is almost perpendicular to the short edge of the ventilation shaft (0o-60o, 180o-210o) is due to the inability of the model to resolve the relatively small differences in the pressure coefficient for these non-critical wind angles.
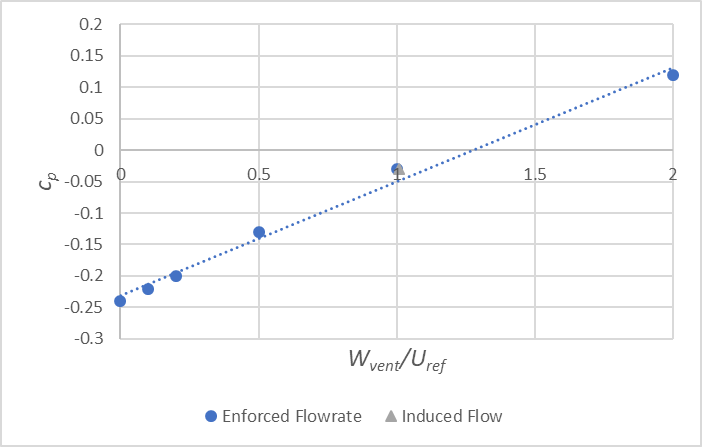
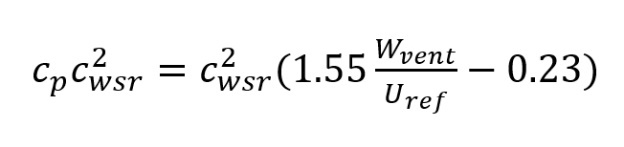
As flow rates through the bottom of the ventilation shaft are enforced with velocity Wvent (see Figure 10 for examples of flow behaviours in and around the shaft), an approximately linear variation of the pressure with flow rate is observed as shown in Figure 12. As the upward flow through the ventilation shaft increases, the amount of suction generated is reduced until, at around 1.2 m/s, positive pressures are required to eject the flow from the vent (i.e. the vent flow is now doing work on the wind as opposed to the other way around).
For wind from the critical wind directions (120o and 300o), the linear best fit is described by:
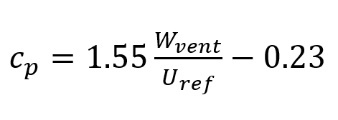 (2)
(2)
To check that this approach did not artificially constrain the development of flow within the vent that some part of the upflow is induced by the low pressure caused by wind flowing over the top of the ventilation shaft, an alternative model was created to simulate the induction of flow from a constant pressure reservoir connected to a short section of tunnel under the vent – see Figure 11.
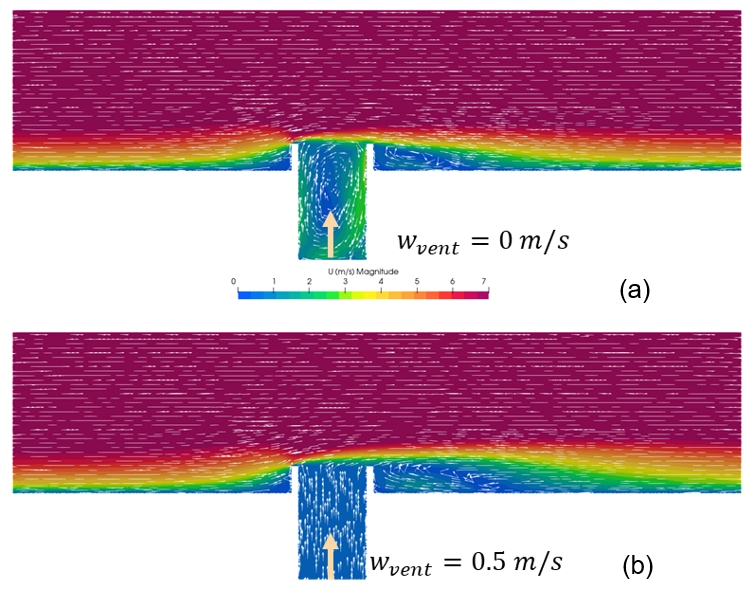
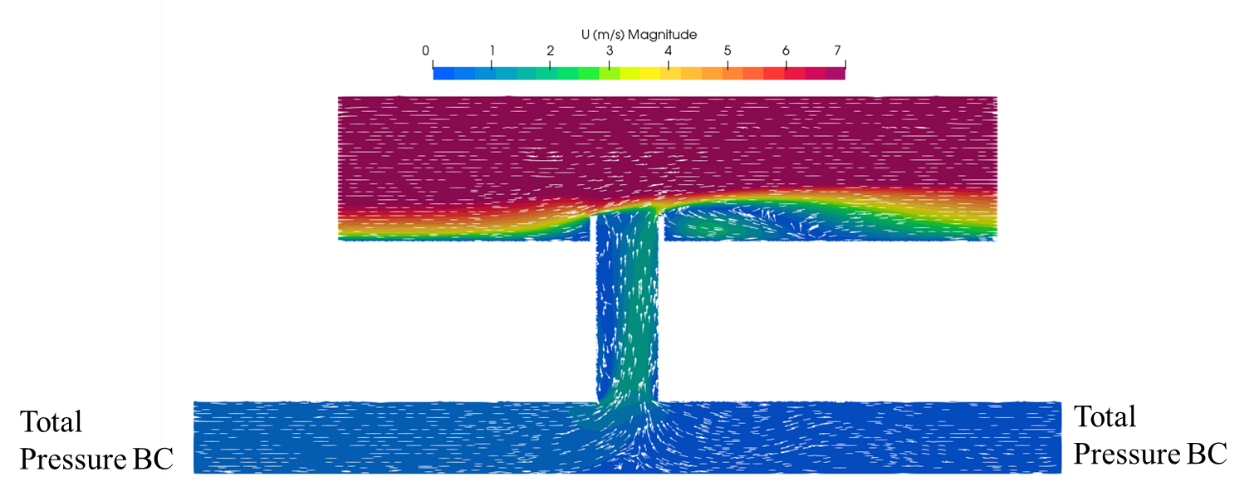
Results from the induced flow scenario are also plotted in Figure 12, and are well predicted by a linear best fit.
Portals
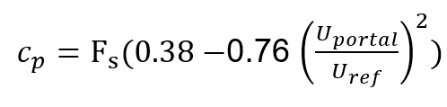
The variation of portal pressure with wind angle for the no through flow scenario are shown in Figure 13 with the portal axis aligned with the 300o wind direction. In this scenario a positive coefficient means a pressure rise at the tunnel portal that would force more wind to flow down the tunnel and upset the smoke layer. The simulated pressures match well with the empirical expression developed by Blendermann (1975) [7] using an equivalent experimental set up. The maximum and minimum pressure coefficients, of 0.39 and -0.38 respectively, occur on the windward and leeward portal respectively, when the wind is aligned with the tunnel axis. These pressure differences will drive a flow thought the tunnel, which tends to impair the functioning of the vents.
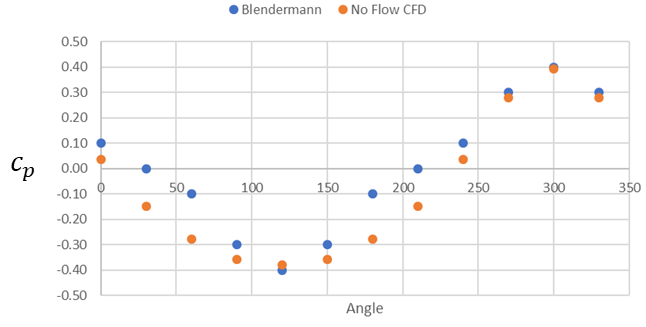
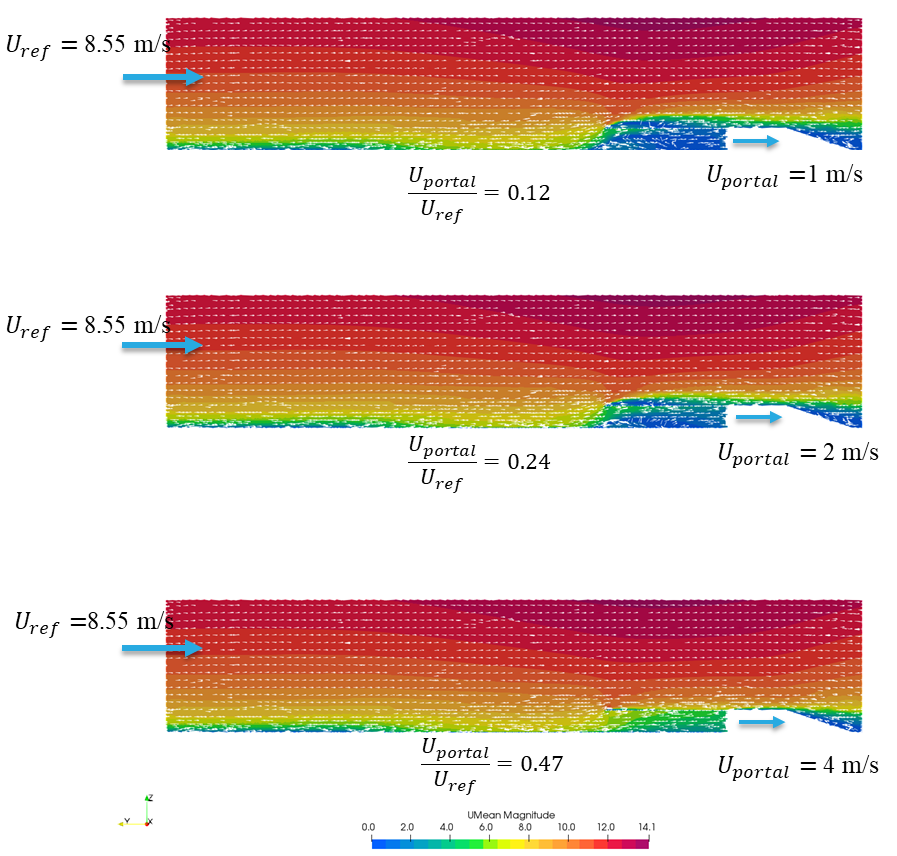
Figure 14 shows a snapshot of a windwards portal, with different amounts of flow exiting the domain through the interface boundary (and thus, entering the tunnel). In this scenario, positive values of Uportal represent flow into the tunnel.
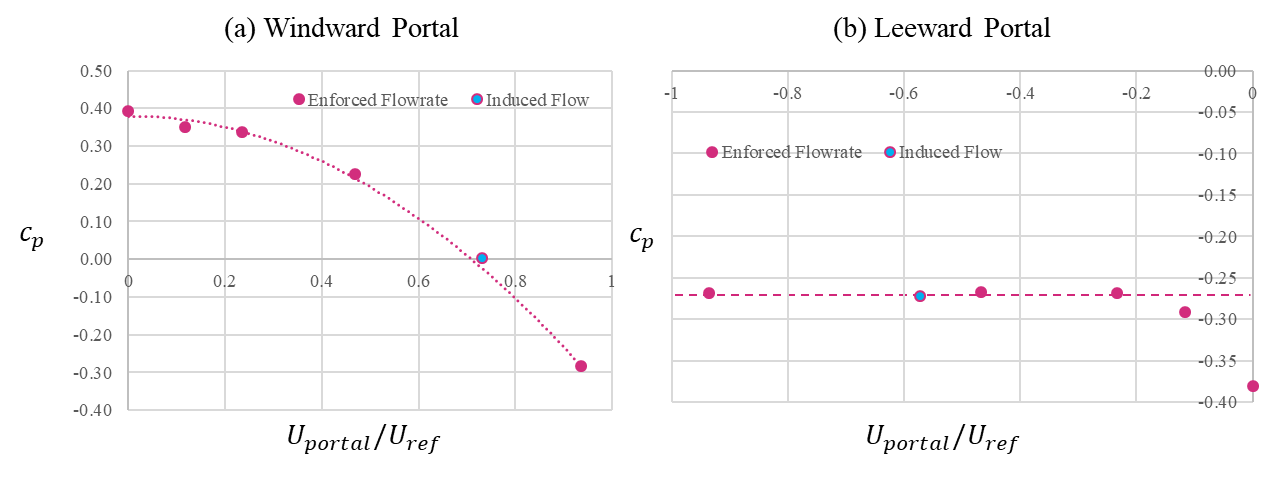
For a windward portal, when flow is entering the tunnel (with velocity Uportal), the positive pressure reduces (Figure 15a). For wind aligned with the tunnel axis (and towards the portal), the relationship between the pressure coefficient and flow into the tunnel is described by
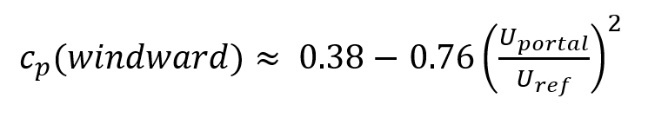 (3)
(3)
For a leeward portal, when the wind is aligned with and flow is exiting the tunnel (see Figure 15b), it is observed that the pressure coefficient remains constant at approximately -0.27. Results from the induced flow scenario agree with those on enforcing a flow.
Far-field modelling
Extending the near field model to include more of the surrounding terrain allows for an assessment of the effect of topography and landscaping on the pressure coefficients obtained from the near field model.
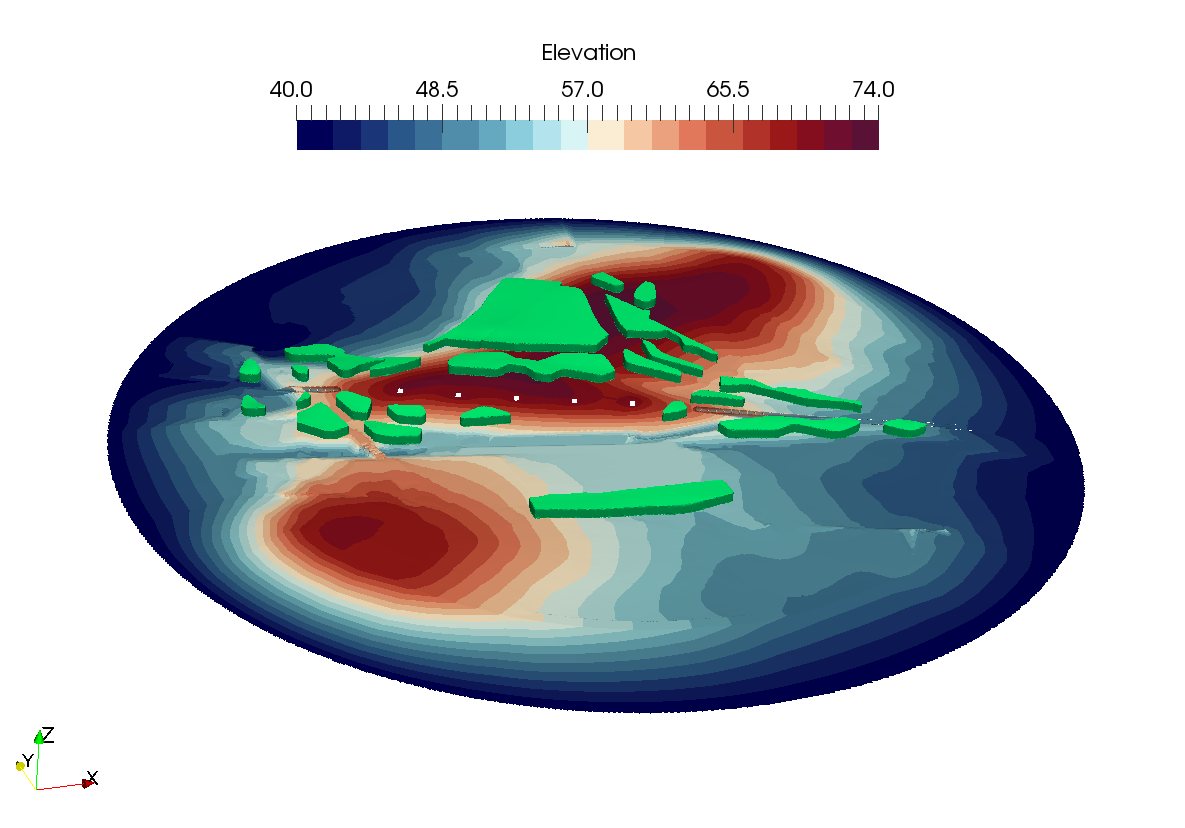
The far field geometry has been constructed from the proposed contours, existing contours, geometry for the Northern and Southern portals, and the proposed and existing landscaping. The extent of the modelled area encompasses a circle with a diameter of 1.2 km. The geometry includes an explicit representation of the tunnel portals and large landscaping features, such as woodland and forest, at their fully grown height (15 m) – these have been conservatively included as solid blocks. The topography and landscaping features which were included in the model are shown in Figure 16.
The far field model had a size of approximately 15 million cells. A mesh sensitivity study with a 34 million cell mesh showed a 1% average difference of the wind speed ratios above the vent shafts – confirming that the 15 million cell mesh was acceptable.
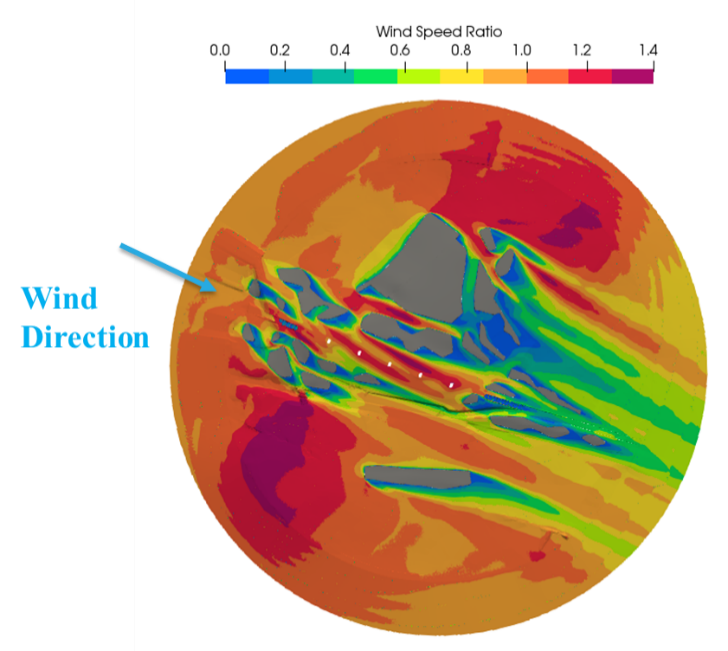
Variation of the wind speed ratio cwsr, the ratio of the wind speed U and reference wind speed Uref 10m above the ground, for wind from 300o, is shown in Figure 17.
Ventilation openings
As the vent shafts are relatively small compared to the size of the domain, the pressure coefficients can be corrected for topographical effects by scaling the nominal sitewide wind speed by the wind speed ratio when converting the pressure coefficients to a pressure. The wind speed ratio for each vent was taken as the average of value within a 20 m radius and 10 m above the ground. The wind speed corrected pressure coefficient becomes  where values of cwsr for each wind direction can be found in Table 1. Including the correction for flow up the vent, the pressure coefficients for the vents becomes:
 (4)
(4)
and the wind speed corrected pressure coefficients for each ventilation shafts with no upflow for each wind direction can be found in Table 2.


Portals
As the tunnel portal and tunnel portal approach is relatively large compared to the size of the domain, the same approach is not valid. This is for two reasons: firstly, the variation of the wind speed ratio around the tunnel portal approach is large, and secondly, the tunnel portal and approach are large enough to influence the flow itself.
Therefore, in the far field model, the tunnel portal itself has been included. However, as the reference pressure is set at the inlet of the far field model, and the flow accelerates over the hill, obtaining the portal pressures directly from the far field model is difficult.
Instead, the driving pressure difference across the tunnel portals is obtained from the far field model. This is combined with the expressions developed from the near field portal model to split the pressure difference and to consider the effect of flow into (and out of) the portals.
The pressure difference from the far field model is denoted ![]() (see Table 3) and from the idealised model
(see Table 3) and from the idealised model ![]() . The ratios of these
. The ratios of these  , see Table 4, is used to scale the flow rate dependant portal pressure expressions.
The pressure difference from the far field model is denoted ![]() (see Table 3) and from the idealised model
(see Table 3) and from the idealised model ![]() . The ratios of these , see Table 4, is used to scale the flow rate dependant portal pressure expressions.
. The ratios of these , see Table 4, is used to scale the flow rate dependant portal pressure expressions.

 for each wind direction.
 For the wind aligned with the tunnel direction, once flow begins to exit the tunnel on the leeward side, the expressions developed in near-field model indicate ![]() = 0.65.
= 0.65.
For the windward portal:
 Equation 5
And leeward portal:
 (6)
(6)
| 120 | 300 | |
|---|---|---|
|
Fs |
0.49 |
0.66 |
Smoke movement
The assessment of critical wind conditions for the variation of pressure coefficient was used to establish boundary conditions for modelling train scenarios in the tunnel. The Fire Dynamics Simulator (FDS version 6) CFD code [2] was used to model combustion and smoke movement within the tunnel. The software solves a form of the Navier-Stokes equations appropriate for low-speed, thermally-driven flow. Large Eddy Simulation (LES) is used to model effects of turbulence, since the improved accuracy of this technique compared with RANS is more significant for fire-driven flows.
Fire scenarios
The following two fire scenarios were modelled to demonstrate the feasibility of adopting natural ventilation. Both scenarios are based on the HS2 design fire heat release rate of 7MW with sensitivity to effect of reduced buoyancy from a 1MW also being considered.
Scenario A: one train carriage on fire and the train stops in the middle of the tunnel. Calm wind conditions or wind directions not aligned with the tunnel. This scenario is representative of approximately 92% of winds on smoke movement in the tunnel.
Scenario B: one train carriage on fire and the train stops at the Northern portal. The wind direction is from the north west (aligned with the tunnel) and the wind speed is 6 m/s at a height of 10 m above open ground. This highly challenging scenario is based on one of the most challenging wind directions during a fire with the train at the worst location in the tunnel.
Scenario B has been considered using the following three models to account for the effect of topography on wind conditions local to each portal and each ventilation opening, and the effect of flow driven through the tunnel by the wind:
Model 1: Flows through the tunnel and across the top of each vent opening due to wind. The flows applied include topography correction from far-field model.
Model 2: As per Model 1 with the induced flow pressure coefficients from near-field modelling included.
Model 3: As per Model 2 with the induced flow pressure coefficients further modified using near-field modelling results.
All results are shown after 1200s of simulation time, at which point steady state conditions have been reached. Tenable conditions in the tunnel are based on the following criteria, based on guidance in Section 10 of PD 7974-6 [8]
- Visibility to a light reflecting sign greater than 10 m at 2 m above the escape walkways
- Temperature less than 68oC and radiant head flux less than 1 kW/m2
Table 5 summarises key model inputs, model geometry and how results are post-processed.
Results
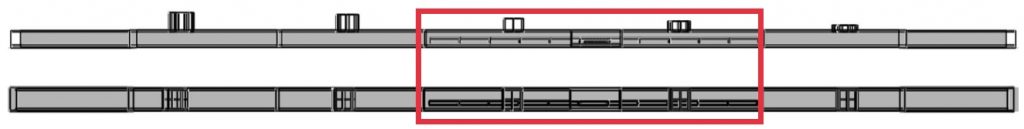
The results for Scenario A (calm wind conditions or wind directions not aligned with the tunnel) are presented in Figure 19 to Figure 21. Hot smoke is naturally vented out via the two natural vent openings adjacent to the fire. The steady state results predict that tenable conditions are maintained along the tunnel at 2m above the escape walkways, thereby meeting the performance criteria.
Figure 18 shows the area of interest for smoke movement within the full model domain for Scenario A results that are presented in Figure 19 to Figure 21.


The results for Scenario B (high challenging scenario based on a challenging wind direction and a fire at a highly challenging location in the tunnel) are discussed in detail below.
Prior to the start of the fire and whilst the fire is small, a north-westerly wind leads to flow through the tunnel, with the suction generated from wind flowing over the natural ventilation openings draws out some of this air. As the fire increases in size buoyancy effects become more significant. The results are assessed once the fire has reached its maximum size and steady state conditions have been reached.
Model 1 includes the impact of wind on the performance of the natural ventilation including topography correction but does not account for the effect of induced flow on pressure coefficients. The pressure coefficients shown in Table 6 were derived assuming no flow speed, using the results from the far-field modelling.
Northern portal | 1 | 2 | 3 | 4 | 5 | Southern portal | |
|---|---|---|---|---|---|---|---|
|
Pressure coefficient |
0.25 |
-0.24 |
-0.32 |
-0.27 |
-0.3 |
-0.33 |
-0.18 |
|
Dynamic pressure (Pa) |
5.43 |
-5.18 |
-6.91 |
-5.83 |
-6.48 |
-7.13 |
-3.86 |
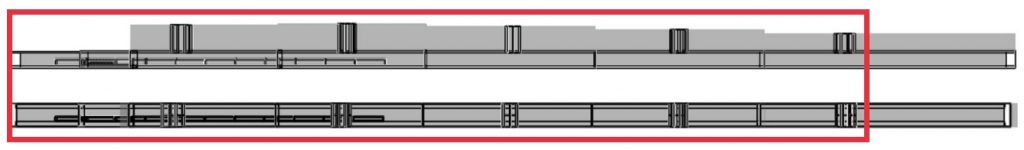
The predicted visibility and temperature for Model 1 are presented in Figure 23 to Figure 25. These steady state results show that tenable conditions are predicted to be maintained in the tunnel.
Figure 23 shows the area of interest for smoke movement within the full model domain for the Scenario B results that are presented in Figure 24 to Figure 31.


The flow through the tunnel forces the smoke to move along the tunnel and increases mixing with tunnel fresh air. Buoyancy from the fire and hot smoke dominates the flow behaviour and fresh air flows into the tunnel from the Southern portal as per the results shown in Table 7. The smoke is vented via three natural ventilation openings adjacent to the fire.
| Northern portal | 1 | 2 | 3 | 4 | 5 | Southern portal | |
|---|---|---|---|---|---|---|---|
|
Flow rate (m3/s) |
410 |
106 |
63 |
115 |
150 |
125 |
-134 |
A simulation without a fire present using the pressure coefficients from Table 5 was also undertaken; the induced volumetric flow rates through the portals and each vent openings along with the associated flow speeds are shown in Table 8.
| Northern portal | 1 | 2 | 3 | 4 | 5 | Southern portal | |
|---|---|---|---|---|---|---|---|
|
Flow rate (m3/s) |
325 |
-3 |
4 |
5.5 |
30 |
74 |
216 |
|
Flow speed (m/s) |
2.5 |
-0.03 |
0.04 |
0.055 |
0.3 |
0.74 |
1.66 |
This data was used together with the near-field modelling results to establish the pressured coefficients for Model 2, shown in Table 9.
| Northern portal | 1 | 2 | 3a | 4 | 5 | Southern portal | |
|---|---|---|---|---|---|---|---|
|
Pressure coefficient |
0.16 |
-0.24 |
-0.31 |
-0.26 |
-0.22 |
-0.14 |
-0.18 |
|
Dynamic pressure (Pa) |
3.54 |
-5.18 |
-6.69 |
-5.53 |
-4.81 |
-3.00 |
-3.89 |
The predicted visibility and temperature for Model 2 are presented in Figure 27 to Figure 29. These steady state results show that tenable conditions are maintained in the tunnel.


Results for Model 2 are similar to Model 1; buoyancy from the fire and hot smoke dominates the flow behaviour and the flow through the tunnel is reduced. Relatively strong suction pressures induced at each ventilation opening, and the pressure inside the tunnel is balanced thereby fresh air flows into the tunnel via ventilation opening 5 as per the results shown in Table 10. Smoke is therefore effectively vented out via two ventilation openings adjacent to the fire.
| Northern portal | 1 | 2 | 3 | 4 | 5 | Southern portal | |
|---|---|---|---|---|---|---|---|
|
Flow rate (m3/s) |
382 |
180 |
135 |
110 |
55 |
-120 |
38 |
A cold flow test using the pressure coefficients from Table 8 was also undertaken; the induced volumetric flow rates through the portals and each vent openings along with the associated flow speeds were used to modify the pressure coefficients at portals and each vent opening for Model 3, shown in Table 11.
| Northern portal | 1 | 2 | 3 | 4 | 5 | Southern portal | |
|---|---|---|---|---|---|---|---|
|
Pressure coefficient |
0.18 |
-0.24 |
-0.26 |
-0.14 |
-0.16 |
-0.33 |
-0.18 |
|
Dynamic pressure (Pa) |
3.88 |
-5.18 |
-5.57 |
-2.99 |
-3.36 |
-7.13 |
-3.89 |
The predicted visibility and temperature for Model 3 are presented in Figure 30 to Figure 32. These steady state results show that tenable conditions are maintained in the tunnel.


Results for Model 3 show improved ventilation of smoke when compared with Model 1 or Model 2. As per the results shown in Table 11, the suction pressures generated at ventilation openings 1 and 2 are further improved, with the ventilation openings 3, 4 and the Southern portal allowing make-up air to be supplied to the tunnel. This result suggests natural ventilation is more efficient compared with Model 1 or Model 2.
| Northern portal | 1 | 2 | 3 | 4 | 5 | Southern portal | |
|---|---|---|---|---|---|---|---|
|
Flow rate (m3/s) |
370 |
210 |
140 |
-44 |
-41 |
150 |
-30 |
Next Steps
The analysis in this paper relies on the use of discrete models that are coupled together to derive an overall prediction of the outcome. Additional modelling is being undertaken at the start of detailed design stage using a single coupled model that includes for near-field, far-field wind and buoyancy driven flows. Confirmation of satisfactory performance using this coupled modelling will allow detailed design to proceed with a cost-effective and sustainable natural ventilation solution for Copthall tunnel.
Conclusions
The analysis in this paper shows the buoyant flow due to fire and hot smoke dominates the flow behaviour inside the tunnel and smoke is efficiently vented out through the vent openings close to the fire even during highly challenging wind conditions.
The natural ventilation openings allow smoke to disperse directly to atmosphere when wind speeds are low, or the wind direction is not along the length of the tunnel (at least 97% of wind conditions). For moderate or strong winds directed along the length of the tunnel (less than 3% of wind conditions) the induced flow through the tunnel will tend to move smoke along the tunnel and increase mixing with the tunnel air. The action of wind flowing over the natural ventilation openings generates negative pressures, drawing air out of the tunnel. This effect is increased by buoyancy forces generated by a large fire. Even in these worst-case conditions, natural smoke ventilation is effective and tenable escape routes are maintained.
This study concludes that the proposed natural ventilation approach is viable to achieve the life safety requirements, The study also demonstrates how state of the art computer modelling can be used to provide confidence to allow for more sustainable and cost-effective design of natural ventilation systems for tunnels.
References
| Reference Title | |
|---|---|
|
[1] | “Unofficial OpenFOAM wiki,” [Online] |
|
[2] |
K. McGrattan, S. Hostikka, R. McDermott, J. Floyd and M. Vanella, Fire Dynamics Simulator User’s Guide, National Institute of Standards and Technology, 2019. |
|
[3] |
W. H. Snyder, “Guideline for Fluid Modeling of Atmospheric Diffusion,” Environmental Sciences Research Laboratory , North Carolina, 1981. |
|
[4] |
F. Menter, “Two-Equation Eddy-Viscosity Turbulence Models for Engineering Applications,” AIAA Journal , vol. 32, pp. 1598-1605, 1994. |
|
[5] |
H. Weller and G. Tabor, “A tensorial approach to computational continuum mechanics using object-oriented techniques,” Computers in Physics, vol. 12, pp. 620-631, 1998. |
|
[6] |
B. Blocken, “Computational Fluid Dynamics for urban physics: Importance, scales, possibilities, limitations and ten tips and tricks towards accurate and reliable simulations,” Building and Environment, vol. 91, pp. 219-245, 2015. |
|
[7] |
W. Blendermann, On a Probabilistic Approach to the Influence of Wind on the Longitudinal Ventilation of Road Tunnels, Technische Universität Hamburg-Harburg, 1975. |
|
[8] |
PD7974 – Part 6: Occupant evacuation, behaviour and condition, BSI, 2019. |
Notation
Peer review
- Colin Rawlings, Lead Tunnel EngineerHS2 Ltd
