High Speed Rail 2 ( HS2) G2S green tunnels fire design assessment review
This paper presents the design methodology adopted to evaluate the response of a pre-cast reinforced concrete cut-and-cover tunnel subjected to an accidental fire load. The design methodology adopted a simplified fire assessment with an advanced thermal-mechanical numerical analysis completed in parallel. The advanced numerical analysis adopts a transient semi-coupled thermal-mechanical numerical analysis with temperature dependant thermal and structural properties. The results of the two approaches are presented and compared. Finally, the fire test results which consisted of two full scale segments, conducted at CERIB, France, are presented and validated against the design assumptions.
The learning legacy presented in this paper is relevant to practicing engineers who are designing tunnels for an accidental fire load. The presented paper provides clear explanations for the design requirements, criteria and references to relevant papers and guides which could be used either directly or as a basis for further development of fire design methodologies.
Introduction
The Main Works Civils Contract (MWCC) for the central section of High Speed Two (HS2) Phase One which includes the North Portal Chiltern Tunnels to Brackley and Brackley to South Portal of Long Itchington Wood Green Tunnel, is being delivered by the EFKB Integrated Project Team.
The Area Central (C2 C3) of the Phase One works of High Speed 2 (HS2) will be constructed by the Main Contractor consortium between Eiffage Genie Civil SA, Kier Infrastructure and Overseas Ltd (EKFB) with detailed design delivered by the joint venture between Arcadis, COWI and Setec (ASC). Area Central, includes the construction of three cut-and-cover tunnels, referred to as Green Tunnels, which total 6.5km of the alignment and are located at Chipping Warden, Greatworth and Wendover (Central England).
Greatworth (2.7km) and Chipping Warden (2.5km) ‘Green Tunnels’ are located to the north of Greatworth chipping Warden villages respectively and will be constructed as part of the HS2 Phase Two network. To avoid visual and noise impacts to the villages the at grade rail shall be lowered and pass into in both cases – a tunnel, termed a ‘Green Tunnel’, emerging to the north of both villages.
The Employers works specification[1] requires all areas exposed to a train fire to be designed for the EUREKA time – temperature curve, also known as the RABT ZTV German requirement for train tunnels. This paper presents the structural fire design of the tunnel including the design methodology, calculations and a summary of the fire testing and verification. Two methods have been adopted, a simplified approach and advanced method.
Approach
Greatworth Tunnel and design overview
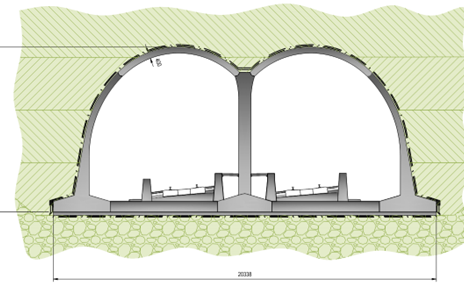
The Greatworth Green tunnel is to be constructed using the cut-and-cover method with a combination of pre-cast concrete elements for the central pier and roof elements and cast in-situ reinforced concrete for the base slab. The depth of each element varies from 400mm, 700mm and 650mm thick for the roof, central pier and base slab respectively. Further details of this innovative approach can be found in the Learning Legacy published by Euan and Sotiris(2023).[2].
The pre-cast concrete roof elements are connected to the central pier and external walls with pinned joints formed with concave to convex faces. All other joints are formed with construction joints i.e. full moment connections.
Design requirements
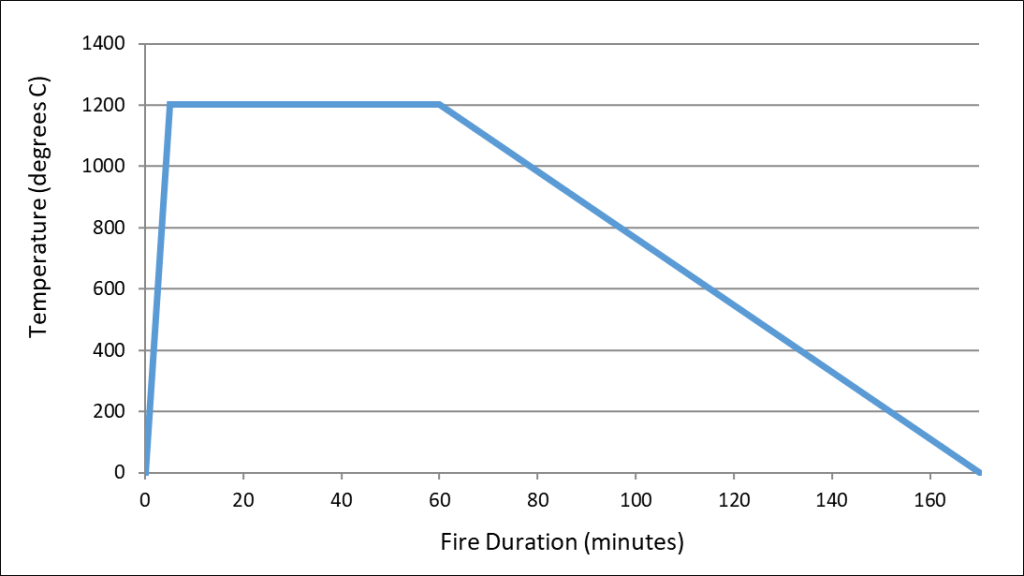
The design requirements specified by the HS2 contract documents require tunnels to withstand the EUREKA fire load as an Accidental Design Situation. The load is a parametric fire curve that represents heating and cooling phases of a train fire. The fire reaches its maximum temperature after 5 minutes and begins to cool after 60 minutes, refer to Figure 2. The temperature propagation into the concrete shall be calculated in accordance with BS EN 1991-1-2[3] and BS EN 1992-1-2[4].
According to the HS2 contract documents[1] states the following requirements must be considered when assessing the tunnel lining,
1) Material degradation,
2) Thermal expansion, and
3) Spalling depth, as obtained from panel tests.
All three requirements have been adopted into the design with the material degradation and thermal expansion in accordance with the Eurocodes[3,4]. The spalling depth was assumed to be limited to 20mm at the start of the design programme and validated with two full scale fire tests. It is logical to ensure the tunnel does not fail during or after the fire, with the short-term load and safety factors of 1. Calculations shall be non-linear and shall consider the decrease in stiffness. The analysed structural system must reach a state of equilibrium.
Tunnel fire design methodology
Tunnels which adopt a protective lining are relatively simple to design where the interface temperature between the protective lining and tunnel surface are restricted to 380°C in accordance with Efectis (2020)[5]. This approach will avoid damage to the lining (Khoury (2002))[6] resulting in faster re-opened times (ITA (2004))[7] and reducing costs associated with rectification works and reduced non-operational times. Tunnels without a protective lining, such as Greatworth Tunnel, require a more complex analysis to assess the lining for stability during and after the fire event to consider the thermal load and the effects of spalling and material degradation.
There is no single or codified approach for assessing tunnels for accidental fire loads which has been widely accepted or adopted in practice (FHWA (2020))[8]. To date, many different methods have been used, for example, Caner (2009)[9], Cucino, P et al (2010)[10], Diaz J S. (2018)[11], ITA (2004)[7], Maraveas (2014)[12] and Monckton (2018)[13].
The design methodology adopted here is a similar approach to that presented by Monckton (2018)[13]. A simplified assessment was completed at the start of the design programme which ran in parallel to a more time consuming advanced thermal-mechanical numerical model. Two full scale fire tests were conducted at an external testing facility at CERIB, France, to validate the design assumptions and numerical modelling. Full details are provided in the following sections.
Simplified design approach
A simplified approach was performed at the start of the design programme to assess the performance of the tunnel lining subjected to the accidental fire load by adopting a 2D beam-spring model with an equivalent temperature load applied to the internal face. The tunnel joints are modelled with axial-force dependant rotational springs and the soil-structure interaction is modelled with radial compression only springs.
The first stage of the assessment requires a thermal analysis to derive the temperature gradients across the tunnel liner. A temperature envelope is abstracted from the results and adopted as the final temperature profile. By considering the temperature dependent properties of concrete, the resultant stresses across the liner can be calculated considering a “clamped” section. The primary stresses are then conveniently converted to a temperature load and applied to the beam-spring model to calculate the final combined primary and secondary stresses on the tunnel lining.
The commercially available finite element software package LUSAS (FEA Ltd.) [14] has been adopted to calculate the temperature distribution through the tunnel segments and for all remaining numerical models. The temperature dependent properties are in accordance with BS EN 2004-1-2:2004[4], see Figure 3.
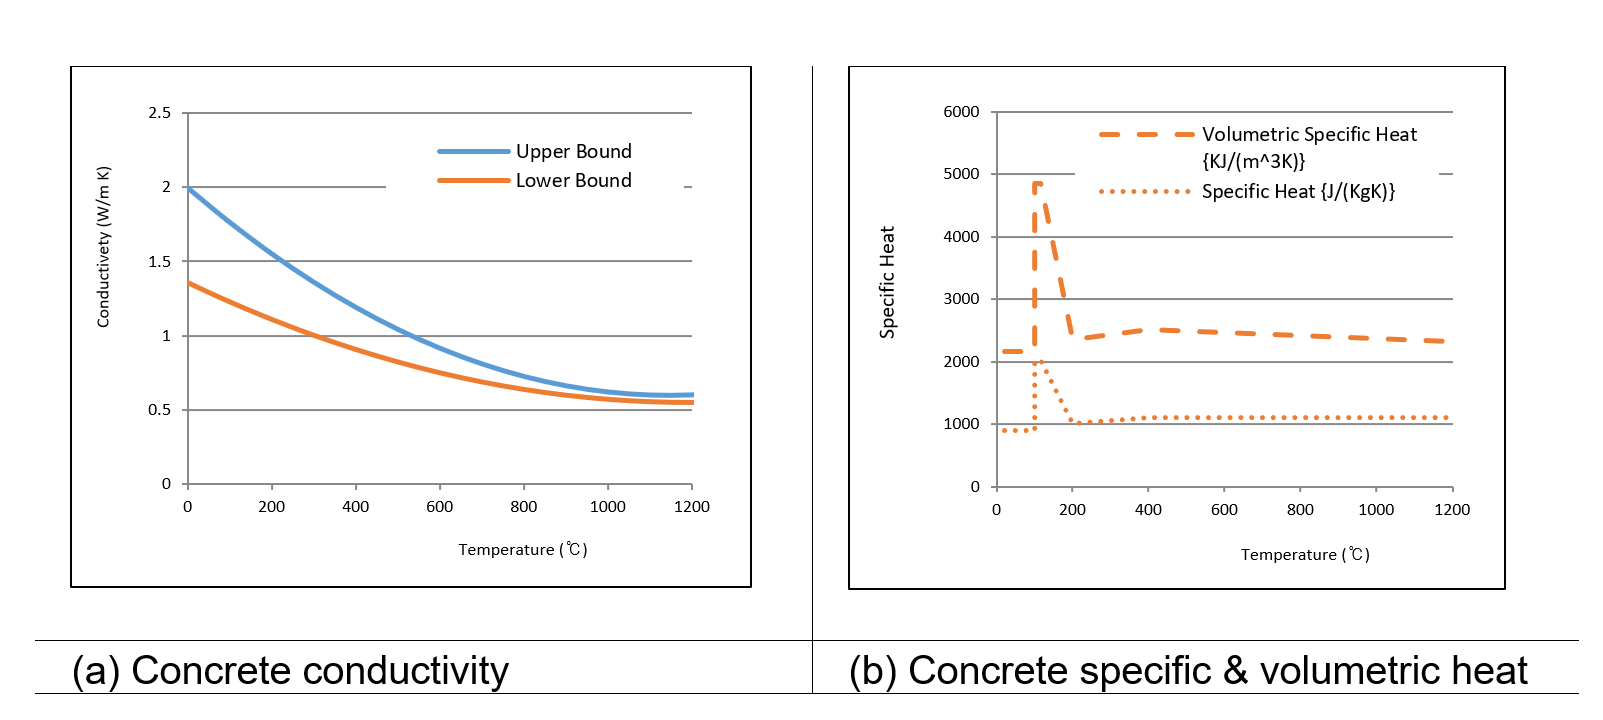
Note – the lower bound concrete conductivity in accordance with the UK National Annex has been adopted.
The boundary conditions model both convection and radiation with Stefan-Boltzmann combined with Kirchhoff law of emissivity and Newton’s law of cooling is as follows,
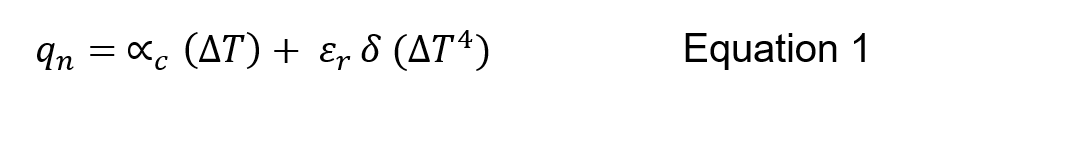
Where αc is the convection factor equal to 25W/m2K, ε is the emissivity of the surface equal to 0.7, σ is the Stefan-Boltzmann constant equating to 5.67E-8W/(m2K4) and ΔT is the difference between the reference temperature. Note, there are some simplifications with the emissivity of the fire, εf = 1 and the configuration factor, Φ = 1.
The temperature profile results are presented in Figure 4.
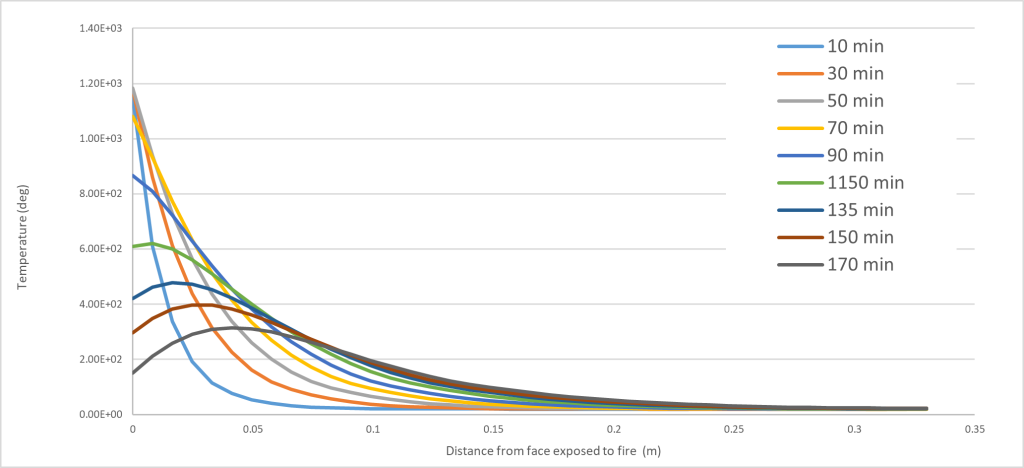
A temperature envelope encompassing all the thermal gradients was adopted as the final temperature profile and was deemed to be a conservative approach.
It is not possible to input a nonlinear temperature profile into beam-spring models, therefore an equivalent load must be calculated and converted to a uniform temperature (ΔT) and a temperature difference across the section depth (ΔΔT).
In accordance with Grunicke and Walter (2007)[15] the tunnel lining was divided into zones with the material properties in accordance with BS EN 1992-1-2:2004[4]. The equations ensure that the allowable concrete stress and Young’s modulus at the reference temperature within each zone are not exceeded, which would otherwise result in excessive stresses. With the section divided it is possible to sum the total normal force, Nθ, and moment, Mθ . This procedure is completed over a section reduced by the spalling depth.
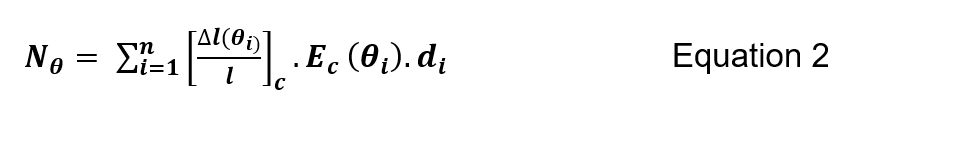
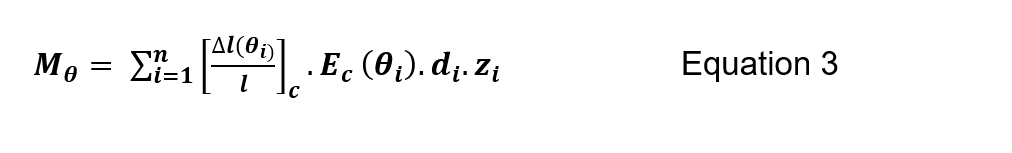
Where n is the number of zones,[(∆l(θ_(i)))/l]_ci] is the thermal expansion at the reference temperature, E_c 〖(θ〗_i) is the Young’s modulus at the reference temperature, d_i is the zone depth and z_i the lever arm to the center of the zone to the centroid of the section.
With the section divided into zones the equivalent linear temperatures to be applied in the beam-spring model are calculated from the following.
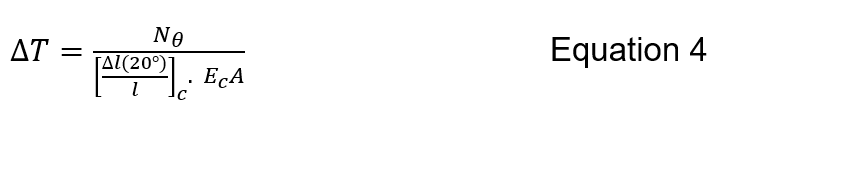
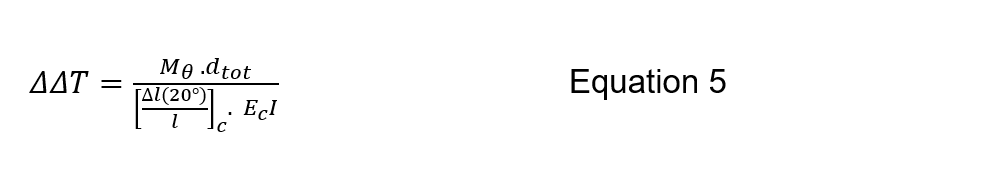
Where [∆l(20°)/l]c is the coefficient of thermal expansion at 20°, Ec is the Young’s modulus at 20°, A is the area, 〖 d〗_tot is the total depth and I is the second moment of area.
The tunnel lining thickness is reduced to accommodate both the effects of spalling and concrete degradation at elevated temperatures. Spalling is assumed to occur instantaneously at the start of the fire event and thus the lining is reduced by 20mm. The damage to the remaining section and decline in stiffness and bearing capacity is considered by means of a reduction in member cross section, Ac, by the damage factor Kc,m, in accordance with BS EN 1992-1-2: 2004[4] as follows,
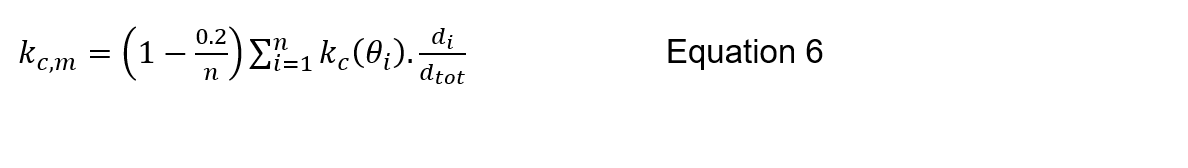
Where n is the number of zones, is the concrete strength reduction at reference temperature, is the zone thickness and is the total depth.
The reduction factors and final lining depths are presented in Table 1.
| Property | Original Depth | Reduction Factor | Final Depth |
|---|---|---|---|
|
Depth of Section |
400mm / 550mm / 895 mm | Spalling = 20mmDamage factor = 0.9162 / 0.9700 / 0.9799 |
352mm / 505mm / 857 mm |
The reduction in thickness is applied to both during and after the fire event.
The material properties and factors are presented in Table 2.
| Concrete | Units | During Fire Event (ACC) | After Fire Event (ULS) |
|---|---|---|---|
|
Young’s Modulus, Ec |
GPa |
37 |
37 |
|
Concrete Strength, fcd |
MPa |
50 |
50 |
|
Poisson’s Ratio, ν |
– |
0.2 |
0.2 |
|
Material Factor, γc |
– |
1.0 |
1.5 |
|
Steel | |||
|
Youngs Modulus, Es |
GPa |
73.6 |
200 |
|
Yield Strength, fy |
MPa |
22.7 |
435 |
|
Material Factor, γs |
– |
1.0 |
1.15 |
|
Load Factors | |||
|
Permanent Load |
– |
1.0* |
1.35* |
|
Variable Load |
– |
1.0* |
1.5* |
|
Fire Load |
– |
1.0* |
NA |
Load factors after and during the fire event are subject to client requirements.
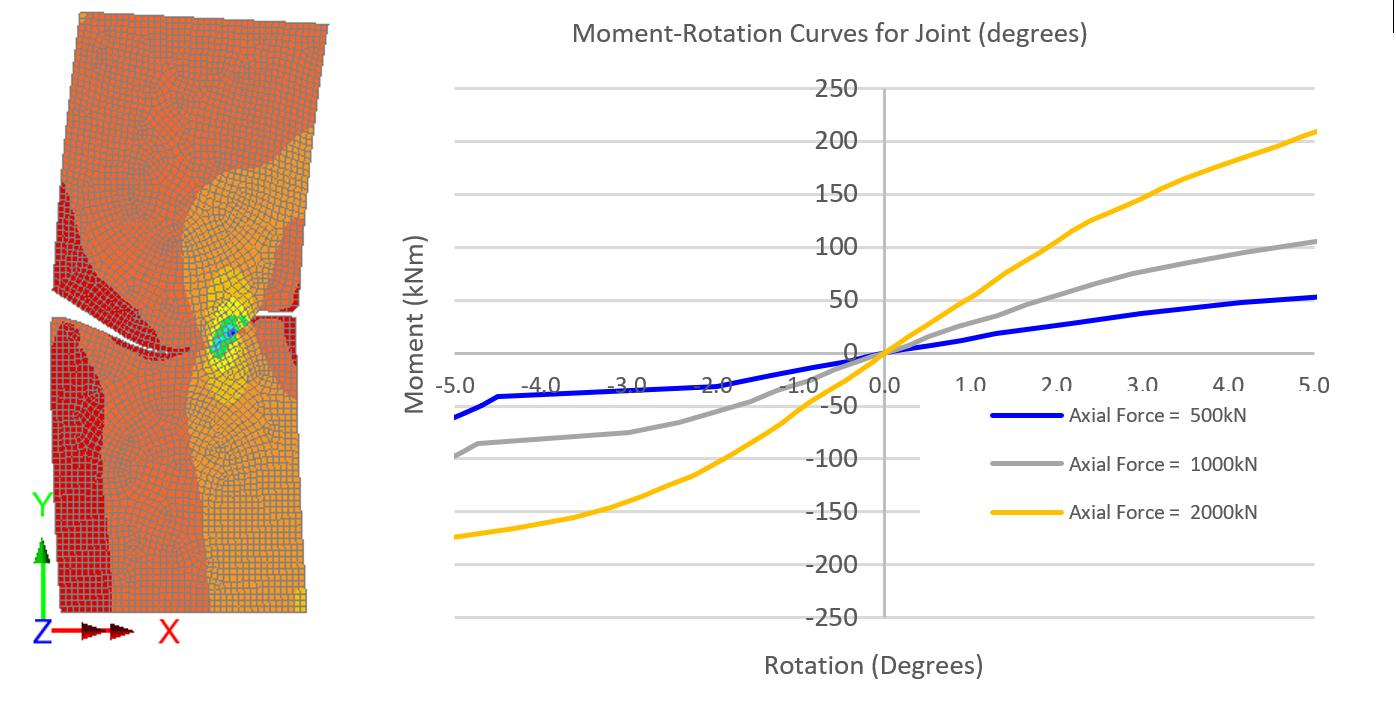
The simplified beam spring model adopts rotational springs to model the segment joints. The stiffness is dependent on the axial force and typically closed form equations such as Janβen[16] are adopted. However, as the joints are concave to convex this method is not applicable. Therefore, the stiffness was derived from a series of numerical models by applying a constant axial force and varying the moment for a range of axial forces, see Figure 5.These were then added to the joint spring material properties of the beam-spring model.
The final 2D beam-spring model adopted for the simplified method was analysed in the finite element programme, LUSAS (FEA Ltd.) as presented in Figure 6.
Fire load capacity
The Eurocode 2[4] provides two simplified calculation methods to evaluate the structural capacity. Each of these is discussed in the following sections.
The 500°C Isotherm Method was developed in the 1970’s by Anderberg (1978)[[17] and has been incorporated into Eurocode 2 (Kodur and Naser, 2020)[18] . The method was originally developed for pure bending (fib Model Code 2010)[19] and assumes that the compressive strength of concrete which reaches temperatures over 500°C does not contribute to the section capacity. The method is only applicable to the standard fire curve since it is not well validated for other fire scenarios (fib Model Code 2010[19], Bamonte P., Meda A (2006))[20] and therefore cannot be adopted for the EUREKA fire curve. Furthermore, the method has also been shown to overestimate the capacity when members which are subjected to both bending and axial forces, as shown by Bamonte P., Meda A (2006)[20], Law A., Gillie M. (2010)[21] and Seręga S (2008)[22].
The second simplified method is the Zone Method which was developed in the 1980’s by Hertz (1981)[23] and has been incorporated into Eurocode 2 (Kodur and Naser, 2020)[18]. After a thermal analysis the cross section is divided into zones with the reduced strengths for each zone and the capacity can be evaluated and summed up to calculate the sectional capacity. The method is also only suitable for the standard fire case.
The Eurocode 2[4] simplified methods were not adopted due to limitations and potential over estimation of the capacity. Advanced calculations were instead adopted to calculate the resistance of the tunnel lining exposed to the EUREKA fire curve by adopting the iterative-increment method to develop a moment-curvature plot. Assuming plain cross-sections principle and appropriate physical laws of concrete and reinforcing steel, for each curvature (κ) there should be found such cross-section strain (εc) for which the resultant of normal stresses is equal to force, Nu. Such an approach leads to a solution of the equation, with regard to εc, in the following form as presented by Chudyba, K. and Serega, S. (2013))[24]:
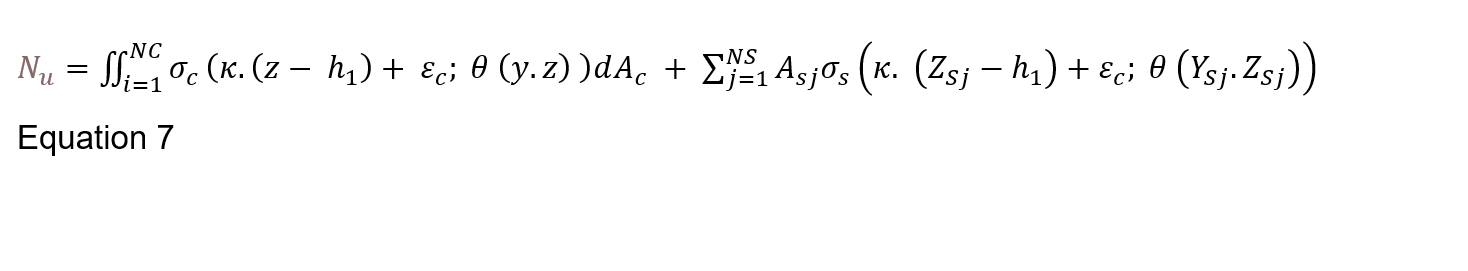
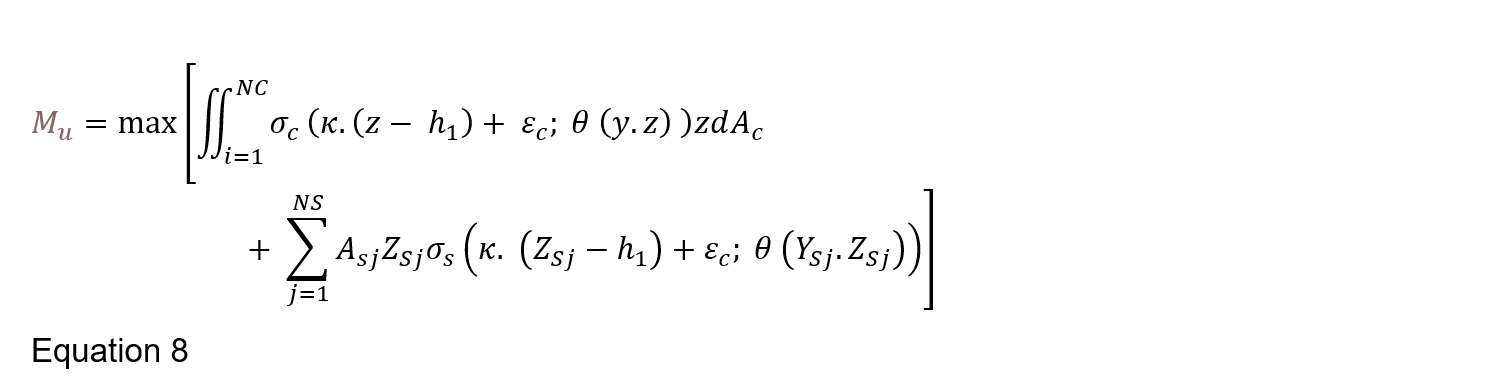
Where, NC is the number of concrete zones, σ_c is concrete stress in accordance with the stress-strain relationship σ_c= σ_c (ε,θ), κ, is the curvature, z is the distance from centroid to mid-point of zone, h_1 is half the section height, A_c is the area of concrete, NS is the number of steel layers θ (y.z) is the temperature at the time (t), Y_Sj.Z_Sj are the coordinates of the reinforcing steel, σ_s is the steel stress in accordance with the stress-strain relationship σ_s= σ_s (ε,θ).
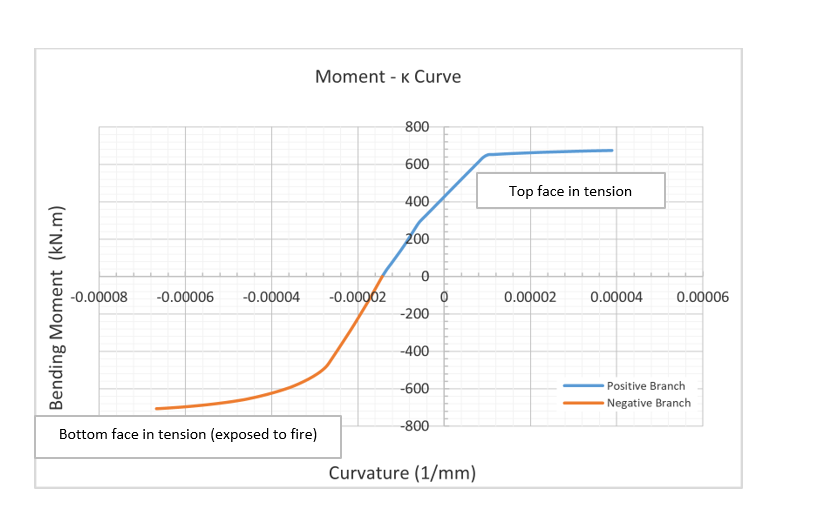
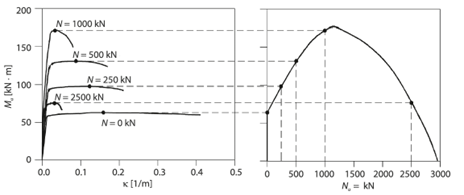
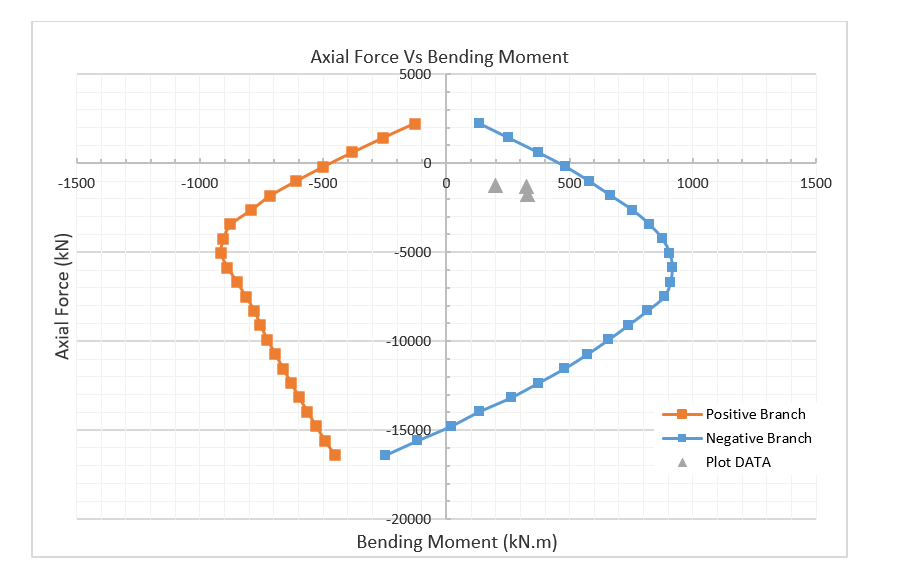
The highest temperature recorded in each depth was used so that a conservative thermal envelope of the section was adopted. Using the method proposed by Chudyba, K. and Serega, S(2013) [24] a moment curvature diagram can be constructed for the required axial force, Figure 7. It is then possible to automate the generation of several moment-curvature diagrams for varying axial forces to construct a full axial – moment (N-M) envelope, refer to Figure 8 & Figure 9. This was completed in Excel with a VBA code to automate the process.
Advanced calculation method
Once the simplified design approach had been completed an advanced analysis adopting a semi-coupled thermal-mechanical analysis was solved to support and verify the simplified approach. A semi–coupled analysis is deemed suitable as the thermal analysis is independent of the structural analysis but the structural analysis is dependent on the thermal analysis. The numerical solution firstly solves the thermal analysis at pre-defined times steps and subsequently solves the structural analysis in time steps whilst adding the temperature gradients from the prior thermal analysis. The advanced model includes the effects of concrete spalling, temperature dependant properties, thermal expansion and cracking and crushing of concrete.
Description of numerical model
Plain strain elements, sometimes referred to as area elements, have been utilised to model the ground and the tunnel lining. The adoption of area elements for the tunnel lining was chosen specifically to capture the non-linear stress behaviour expected through the liner during the fire event. This cannot be captured with beam elements adopted in the simplified method.
To reduce the computational effort, the ground and the tunnel lining adopted linear elements rather than quadratic elements. Although there is a reduction in accuracy with lower order elements, this has been offset by significantly increasing the mesh density in the areas subjected to the thermal loading. To further reduce the computational effort, modelling of the full embankment has been avoided by adopting suitable boundary conditions.
The LUSAS concrete model simulates directional cracking, crack closure and shear contact, (or aggregate interlock), behaviour in an integrated manner, while accounting for the type of damage and triaxial frictional response that characterises the behaviour of concrete in compression. For further information refer to Jefferson(2003)[25]. The smoothed multi crack concrete model solution was invoked in the finite element code.
Spalling
Spalling was modelled by deactivating two 10 mm thick elements at pre-described time intervals and reapplying the EUREKA fire load each time to the newly exposed surface. Explosive spalling can typically occur at the start of the fire event (Shuttleworth, P, (2001)) [26] and as such the chosen time intervals were at 4 and 6 minutes.
Modelling of concave to convex joints
The concave to convex joints were modelled explicitly following the actual geometry. The contact between the two faces must transfer shear and axial forces, have zero tension i.e. allow free rotation and include the effects of friction. This is particularly challenging because the geometry of each face has a different radius. LUSAS offers contact elements that meet the aforementioned objectives with elements called slidelines. The slidelines were assigned to all the concave and convex faces with a frictional coefficient of 0.5 assuming a smooth interface between the pre-cast concrete elements.
Reinforcement
The steel reinforcement is modelled with linear-elastic material properties and assigned as plate elements with an equivalent thickness. The plates are modelled within the tunnel lining with a 50mm cover. The elements carry only axial forces and no moments or shear forces.
Material properties
Linear concrete properties, defined in Table 3, are assigned to the right cell of the tunnel where the fire load is not applied.
| Property | Value |
|---|---|
|
Concrete Grade |
C50/60 |
|
Concrete Young’s Modulus (GPa) |
37 |
|
Concrete Poisson’s Ratio |
0.2 |
|
Concrete Mass Density (tonnes/m³) |
2.5 |
|
Steel Young’s Modulus (GPa) |
200 |
|
Steel Poisson’s Ratio |
0.3 |
|
Steel Mass Density (tonnes/m³) |
7.85 |
|
Steel Coefficient of thermal expansion (deg-1) |
1.20E-05 |
The material parameters for both concrete and steel are temperature dependant. Typically, these parameters will experience reductions, for example, the compressive strength and Young’s modulus. By contrast, the coefficient of expansion and fracture energy increase prior to decreasing at higher temperatures. The thermal conductivity and specific heat capacities of concrete are also temperature dependant. The temperature dependent mechanical properties for concrete are in accordance with BS EN 1992-1-2[4] and the fracture energy in accordance with Matesová, D. & Vořechovský (2005) [27]. The mechanical properties are shown in the following figures below. Refer to Section 4.5.1 below for modifications to the Young’s Modulus and strain at peak stress.
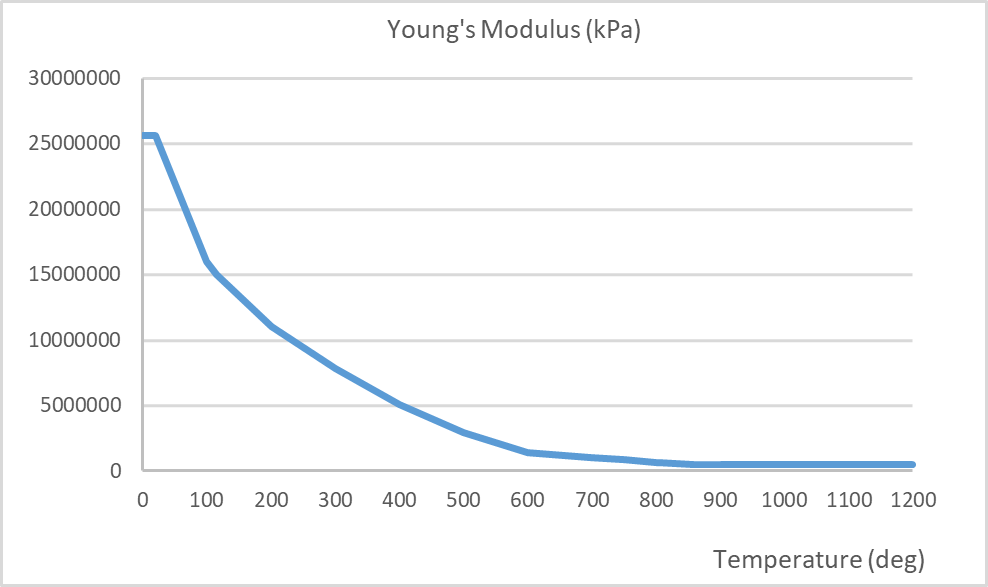
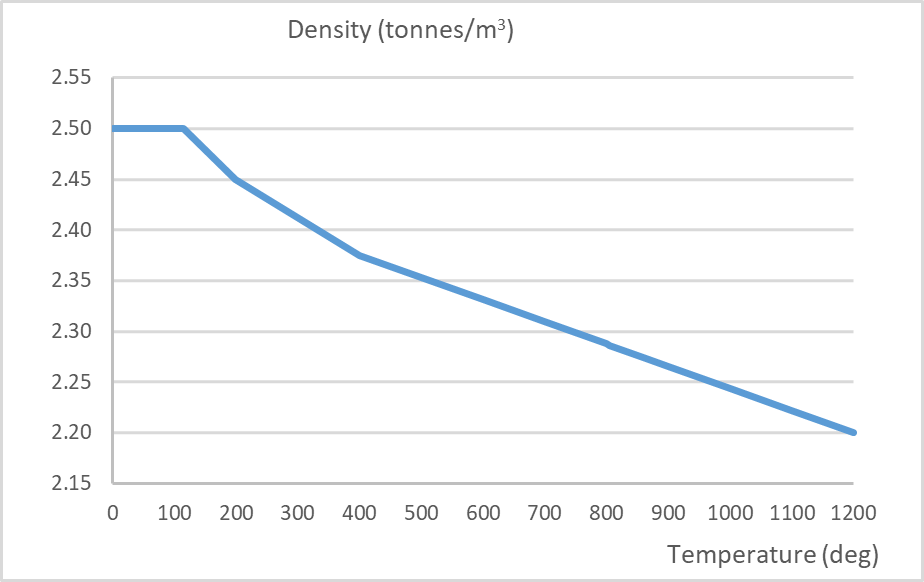
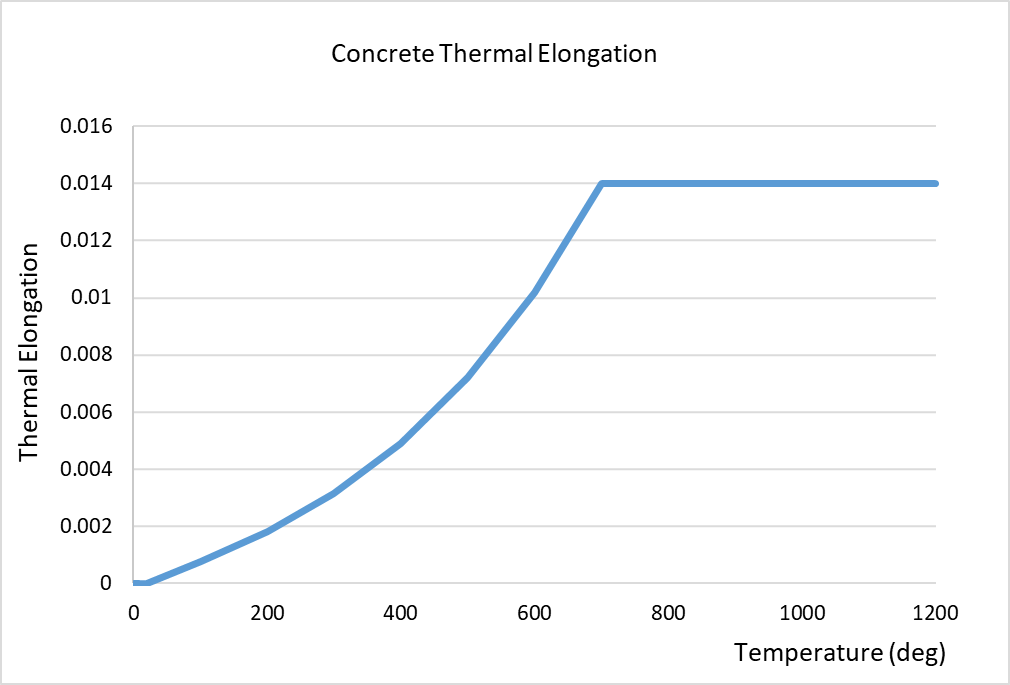
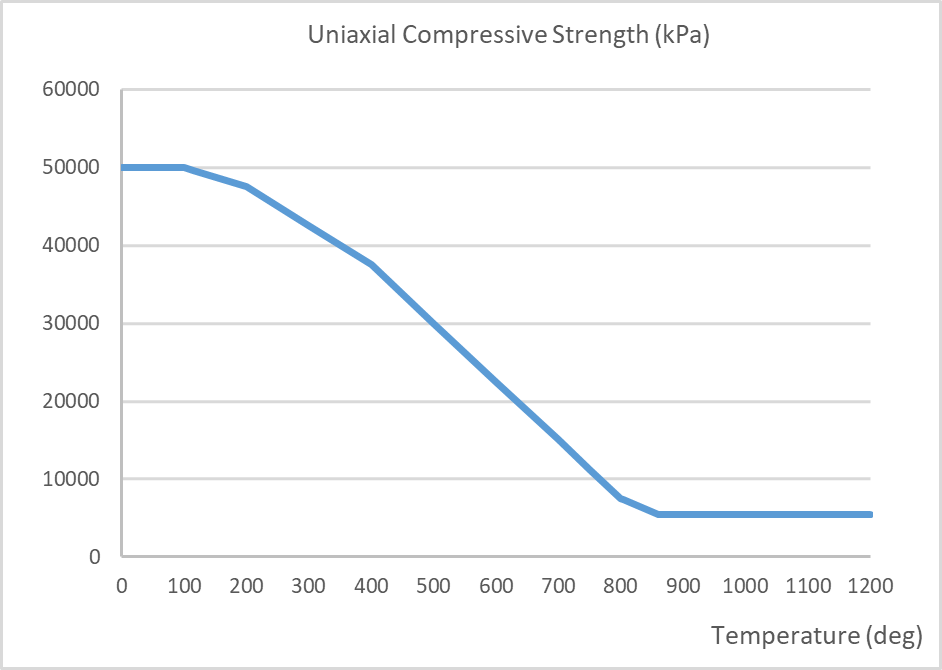
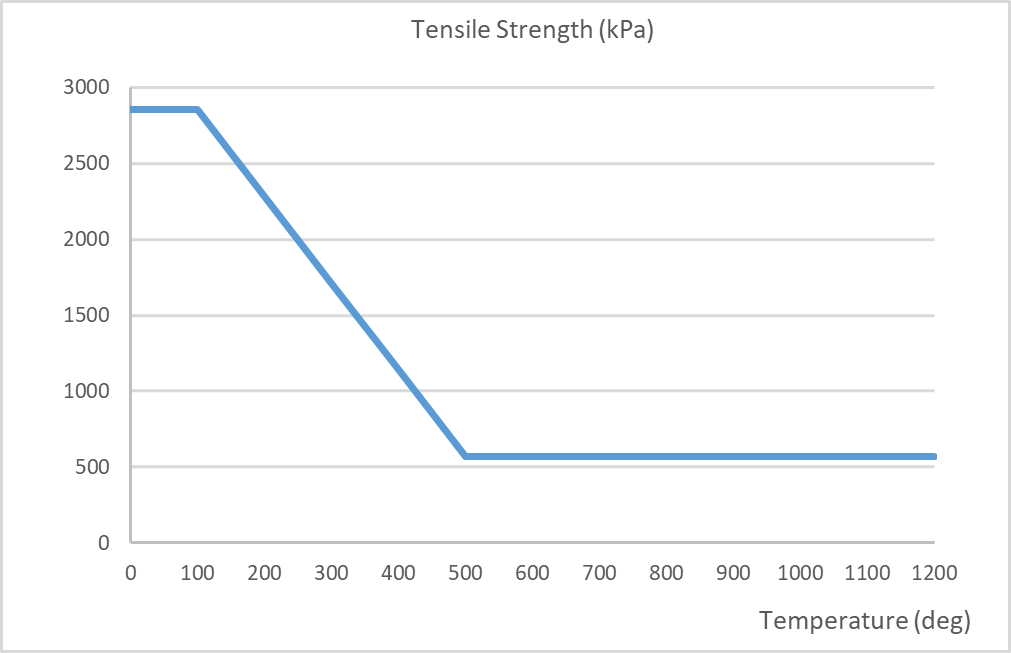
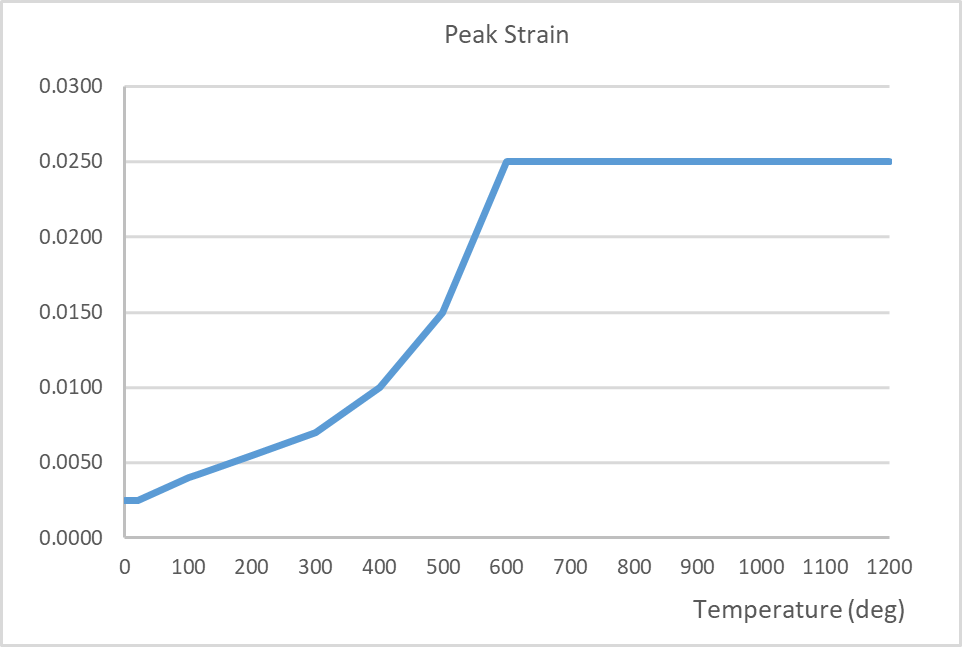
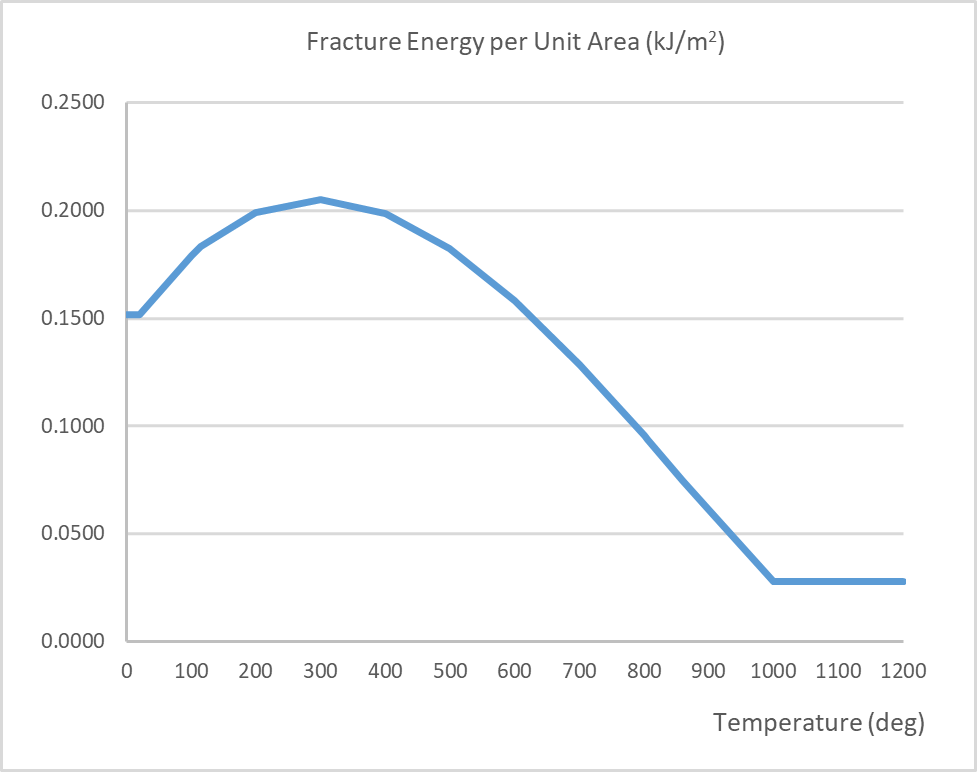
Figure 16 – Fracture energy per unit area vs. temperature
Note – some properties have not been given zero values to avoid numerical difficulties. Instead very low values that would not impact the results have been adopted.
Load induced thermal strain
The total imposed strains are composed of the following
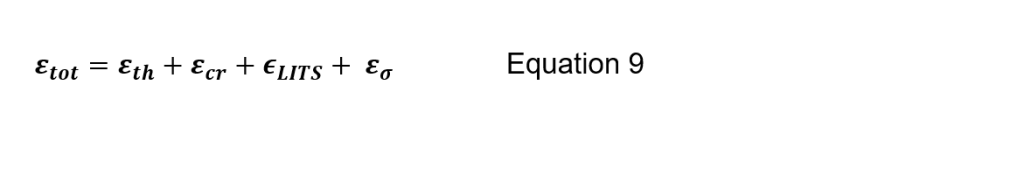
Where εth is thermal strains, ε_cr is the creep strains, ε_LITS is the transient strains and εσ is the stress strains.
Load induced thermal strains (LITS) are not fully understood with researchers adopting different definitions as discussed by Giacomo Torelli et al. (2016))[28]. The authors understand LITS to be the difference between free thermal expansion and net expansion under stress. The importance of LITS was demonstrated by tests undertaken by Smith et al. (2015) [29] which showed that under certain load conditions a concrete structure may contract rather than expand when subjected to fire loads in an unexpected manner. It is worth noting that the effect of LITS can be beneficial by reducing the stresses (Fingerloos, Frank. (2007)[30] and Law and Gillie (2008))[31].
The numerical model adopted the approach presented by Anderberg and Thelandersson (1976)[32] where LITS was presented in the following formula.
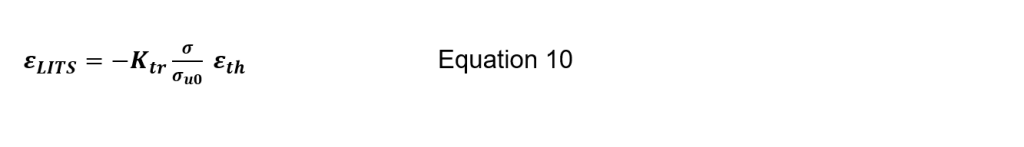
Where K_tr is a constant ranging between 1.85 – 2.35, σ is the stress in the concrete at current temperature, σ_uo is the strength at ambient temperatures and ε_th is the thermal strain.
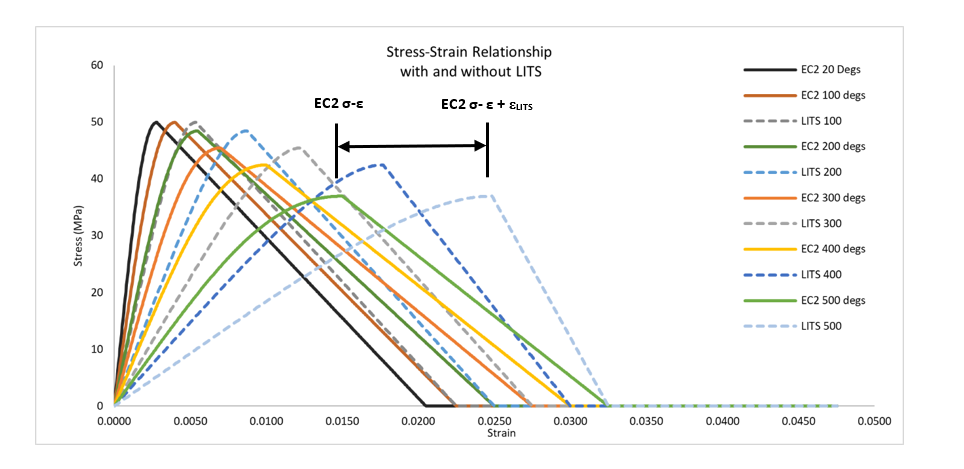
LITS were incorporated by modification of the stress-strain relationship as suggested by Al Hamd et al (2018)[33] and presented in Figure 17 (dashed lines include LITS). A separate finite element test model was used to determine the apparent Young’s Modulus to ensure the correct initial stiffness was obtained.
Backfill properties
The backfill has been modelled as per the construction sequence with a number of lifts to ensure the correct stress history is obtained, refer to Figure 18.
The ground water pressure corresponding to 5m head above the tunnel lining was applied as a distributed line load acting perpendicular to the extrados of the tunnel lining. The ground water pressure was applied to the model once the backfilling stages are completed.
Numerical model
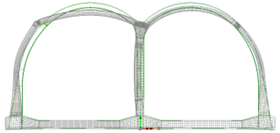
The advanced numerical model is presented in Figure 19.
To reduce the computational time, the size of the model was reduced to only include the tunnel lining and backfill. The base of the tunnel and embankment boundaries were modelled as springs with a stiffness of 50 MPa, which were derived in a separate soil-structure interaction model.
Results
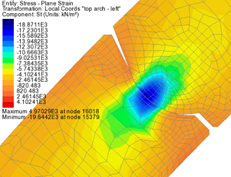
The results of the thermal and structural analysis are presented in Figure 20 and Figure 21.
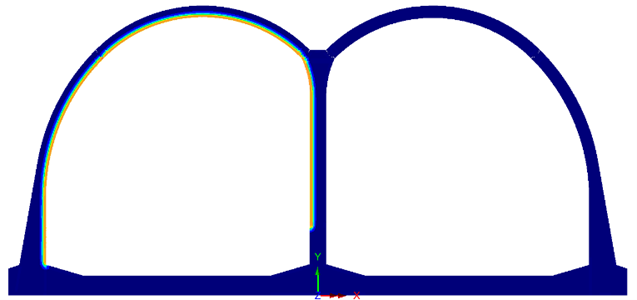
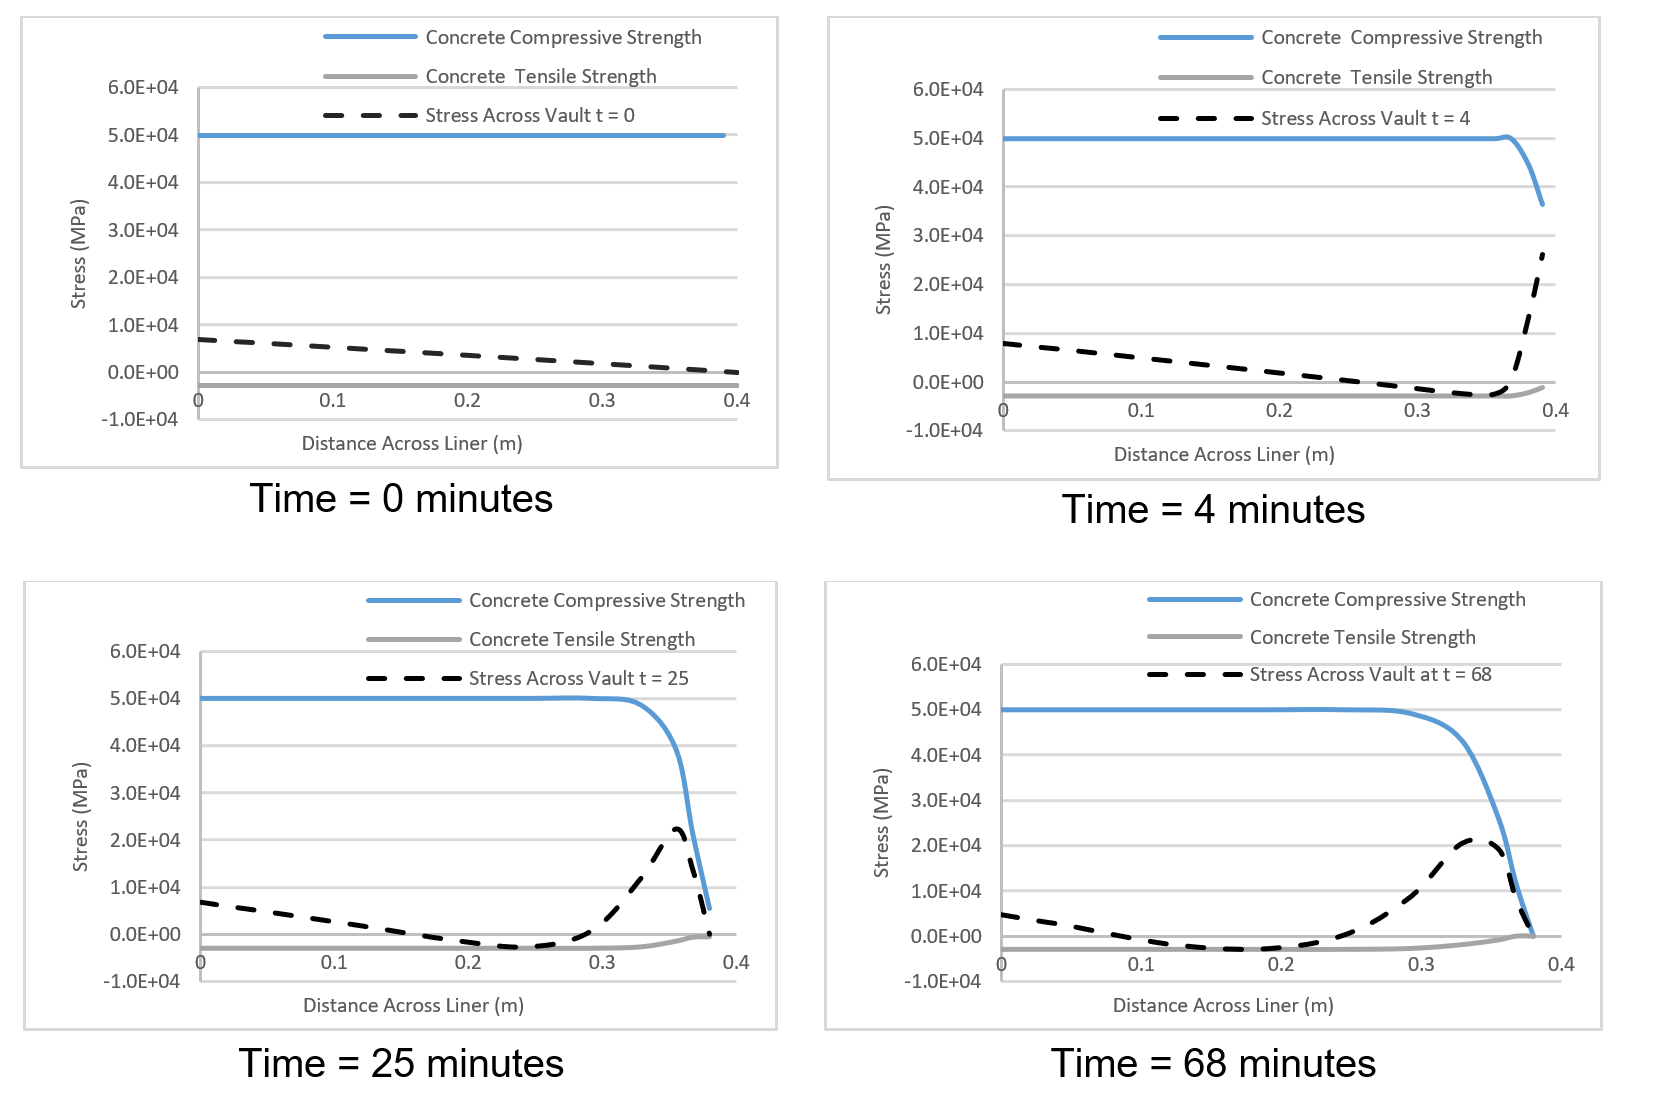
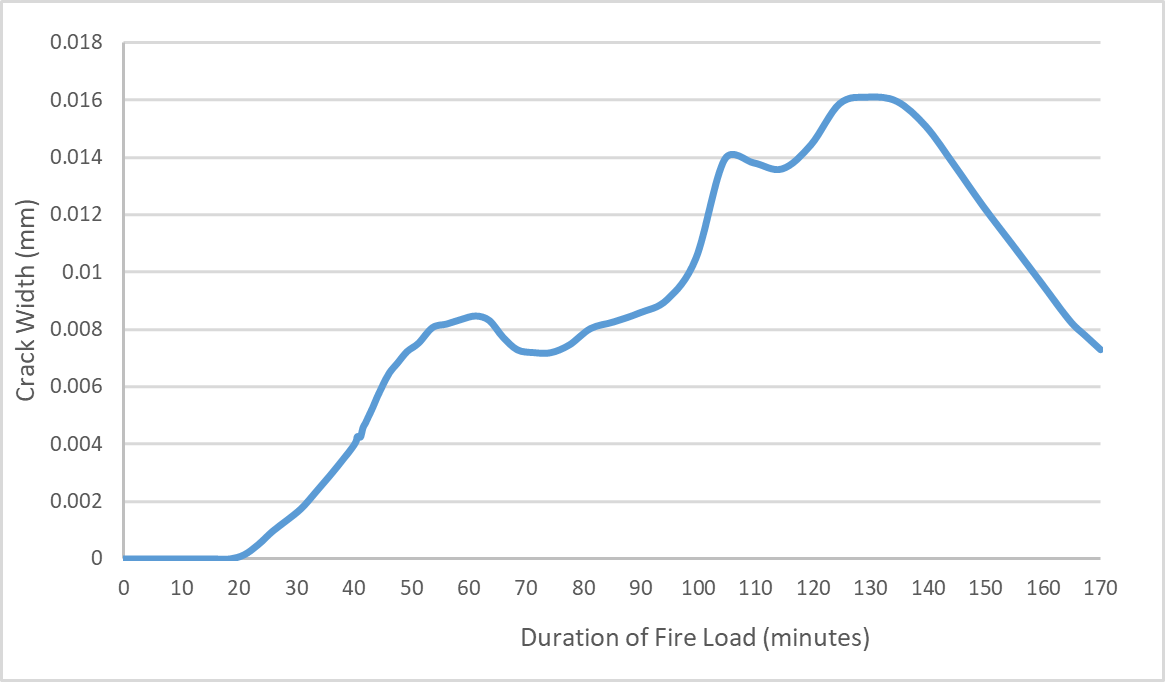
The concrete stress across the lining is presented in Figure 22. A compressive (positive) stress develops on the intrados with equilibrating (negative) tensile stresses advancing in front towards the extrados. Due to the low overburden the initial compressive stress is low which results in tensile equilibrating stresses. In the present analysis the tensile capacity of the concrete is exceeded, resulting in a maximum crack width of 0.016mm, refer to Figure 23. As the temperature reduces these cracks appear to close. Internal cracking in concrete sections during heating has been widely reported (Izabela Hager (2018)[34], Jansson, R. (2013)[35], Jihad Miah (2017)[36]) and is a result of the non-linear temperature gradient and the restraint from the concrete at cooler temperatures. These micro cracks may create a water path and compromise the water tightness over the life of the structure. However, it can be observed that a section of the lining always remains in compression and as such the future operation of the tunnel maybe unaffected. A post fire investigation can be completed to verify this.
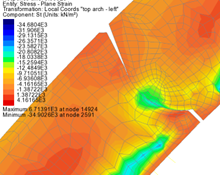
Convex to concave joint behaviour
The rotation of the joint in the numerical model occurred during both construction of the backfill and under the actions of the EUREKA fire load. In general, the stresses at the joint reduce as a result of the rotation, see Figure 24 and Figure 25 which show the stress redistribution at the joint during the analysis.
Comparison between simplified and advanced methods of analysis
The structural forces at two key locations have been abstracted from the simplified and advanced numerical models for comparison and presented in Table 4.
| Location | Method | Axial force (kN) | Bending Moment (kN.m) |
|---|---|---|---|
|
Crown |
Simplified |
1790 |
221 |
|
Crown |
Advanced |
1591 |
170 |
|
Side Walls |
Simplified |
2159 |
1179 |
|
Side Walls |
Advanced |
2370 |
301 |
The stiffness of the lining in the advanced model will be lower due to the cracking.
From the results it is possible to observe several advantages of the advanced calculation. Firstly, the method will result in lower steel quantities as the analysis returns lower structural forces. The advanced method is able to accurately model the stresses across the lining and predict potential non-linear behaviour of the concrete, particularly cracking due to equilibrating stresses which may impact the future operation of the tunnel. Finally, the method can also accurately predict the deformations to ensure the tunnel does not encroach on the kinematic envelope and reduce operational capacity.
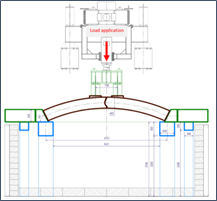
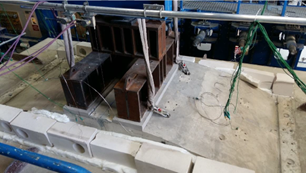
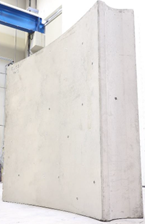
Full scale fire test results
A fire test consisting of two full scale segments were conducted at CERIB, France. The tests assessed the response of the tunnel lining under the EUREKA fire load, see Figure 26 and Figure 27. The test sample dimensions were 1.7m x 1.9m x 0.4m. The concrete mix contains 1.2 kg/m³ of polypropylene fibres 32mm in diameter, 12mm in length. Concrete mix is specified as C50/60-CIIIA+SR with a limestone maximum aggregate size 14mm and a maximum water binder ratio 0.40.
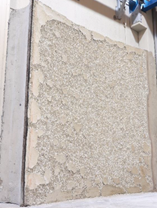
Spalling
Spalling is the violent or non-violent breaking off of layers or pieces of concrete from the surface of a structural element when it is exposed to high and rapidly rising temperatures, as experienced in fires with heating rates typically 20–30 3C/min and can be associated with popping or cracking sounds(Khoury G.A.(2000)) [37]. The cause of spalling is widely attributed to a combination of thermal stresses and the build-up of pore pressures due to moisture clog resulting in which then exceed the tensile capacity of concrete(Kodur and Naser(2020)) [18]. Even if spalling is avoided the concrete surface will show signs of damage after fire tests due to thermal degradation.
Both fire tests exhibited zero concrete spalling. The tests validated the 20mm spalling assumption adopted at the start of the design programme as shown in Figures 28 and 29. The test results did show damage to the concrete due to thermal degradation. The effect of this has been incorporated into the design by using the mechanical material properties of concrete at elevated temperatures.
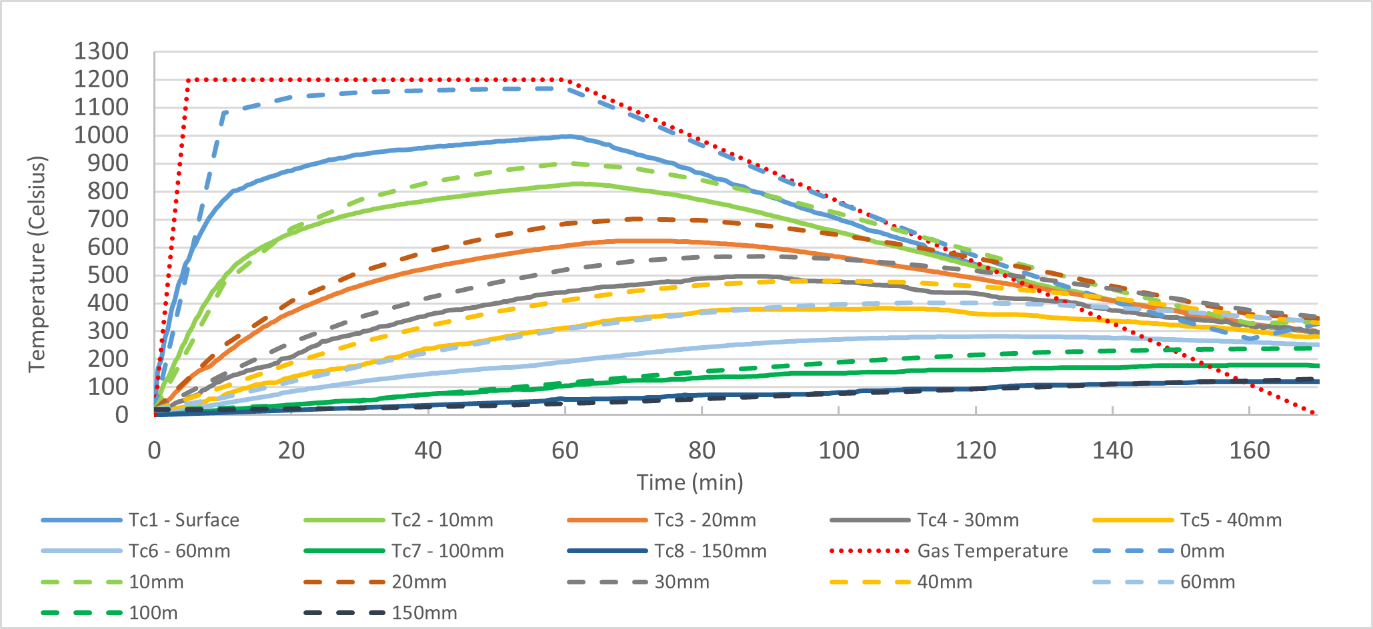
Temperature gradients
Figure 30 below shows a comparison between the temperatures obtained at various depths during the fire test (solid lines) and the concrete thermal model used in the analysis (dashed lines). The analysis results are more conservative, consistently predicting higher temperatures.
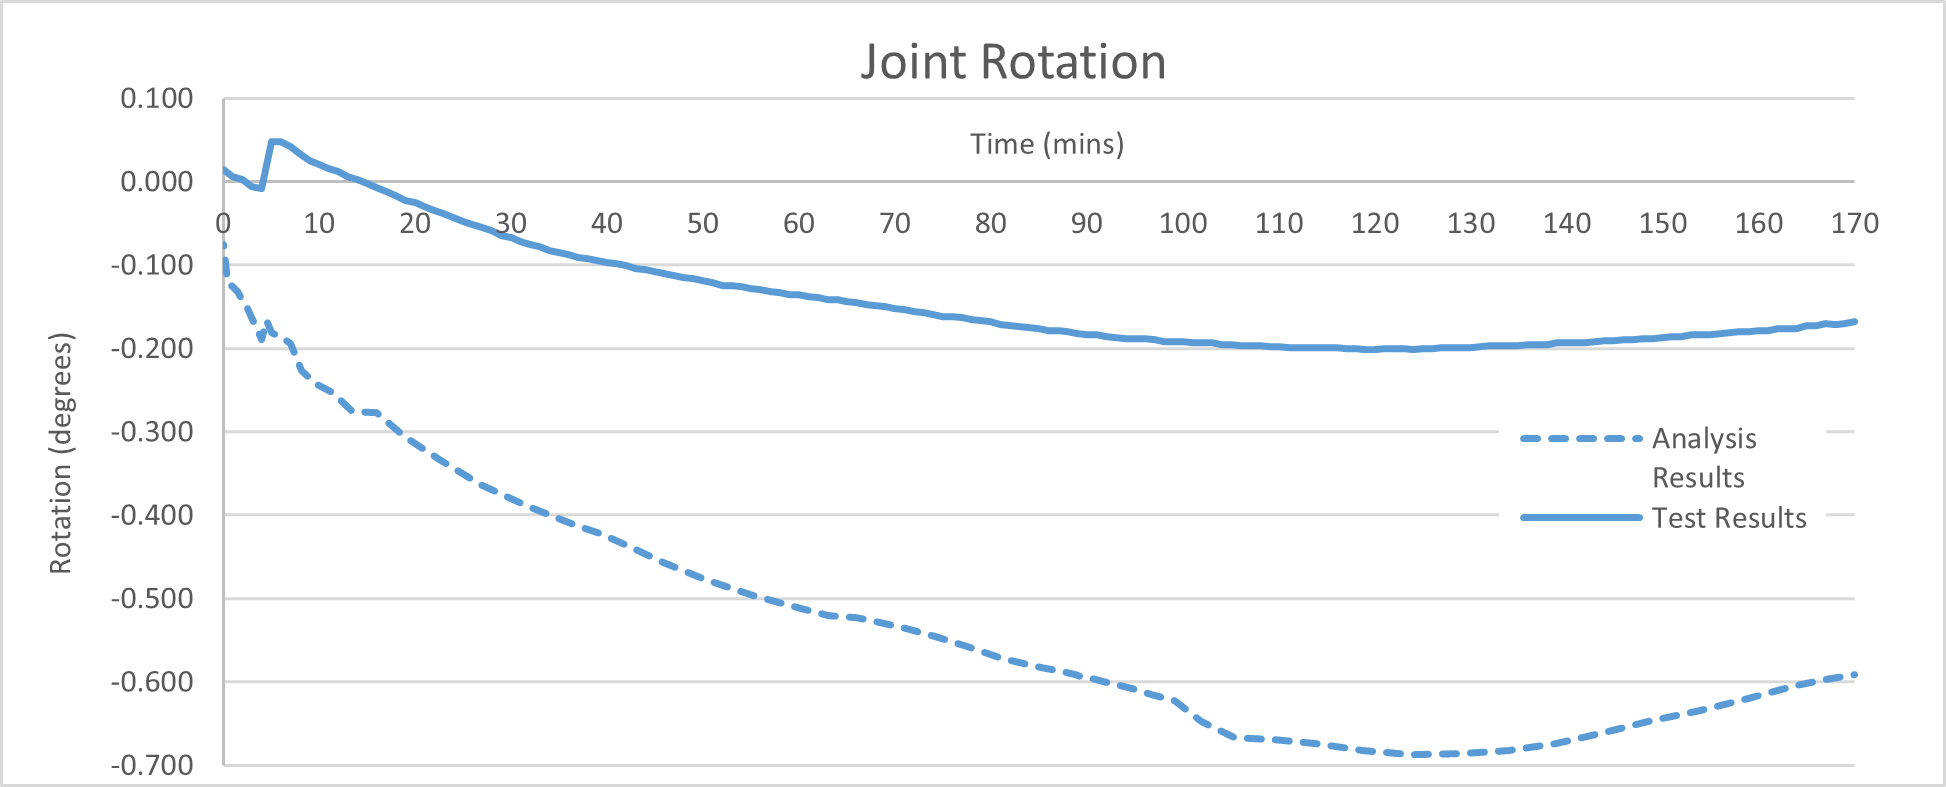
Joint rotation
Comparing the joint rotation between the numerical modelling and laboratory test indicated that the numerical model has captured the same behaviour as the joint rotates to accommodate the vault expansion, see Figure 31. The analysis also captures the reduction in rotation during the cooling period.
Residual concrete strength
Concrete compressive strength tests were carried out on 3 cube samples (150 mm) cast together with the fire test segment. After the fire test 3 190mm long and 90mm diameter core samples were taken from the unexposed surface of the test segments. Compressive tests were then conducted to calculate the residual strength of concrete. Refer to Table 5 where these are presented with equivalent cube strengths calculated in accordance with Concrete Advice No. 47[38].
| Sample | Cube Samples (MPa) | Cylinder Core Samples (MPa) | Equivalent Cube Strength ( MPa) | Strength Loss (%) |
|---|---|---|---|---|
|
1 |
79.0 |
43.4 |
55.0 |
31.5 |
|
2 |
76.4 |
43.2 |
54.7 |
31.8 |
|
3 |
85.2 |
45.1 |
57.1 |
28.8 |
|
Average |
80.2 |
43.9 |
55.6 |
30.7 |
The test results show an average residual compressive strength in the order of 31%. The thermal numerical model was extended from 170min to 1000min to investigate the peak temperatures during the cooling down phase, otherwise missed if the analysis is stopped at the end of the fire load. The time extension identified concrete located 190mm from the unexposed face continued to rise in temperature once the test had been completed, reaching a peak of around 75°C at 350 minutes (Figure 32).
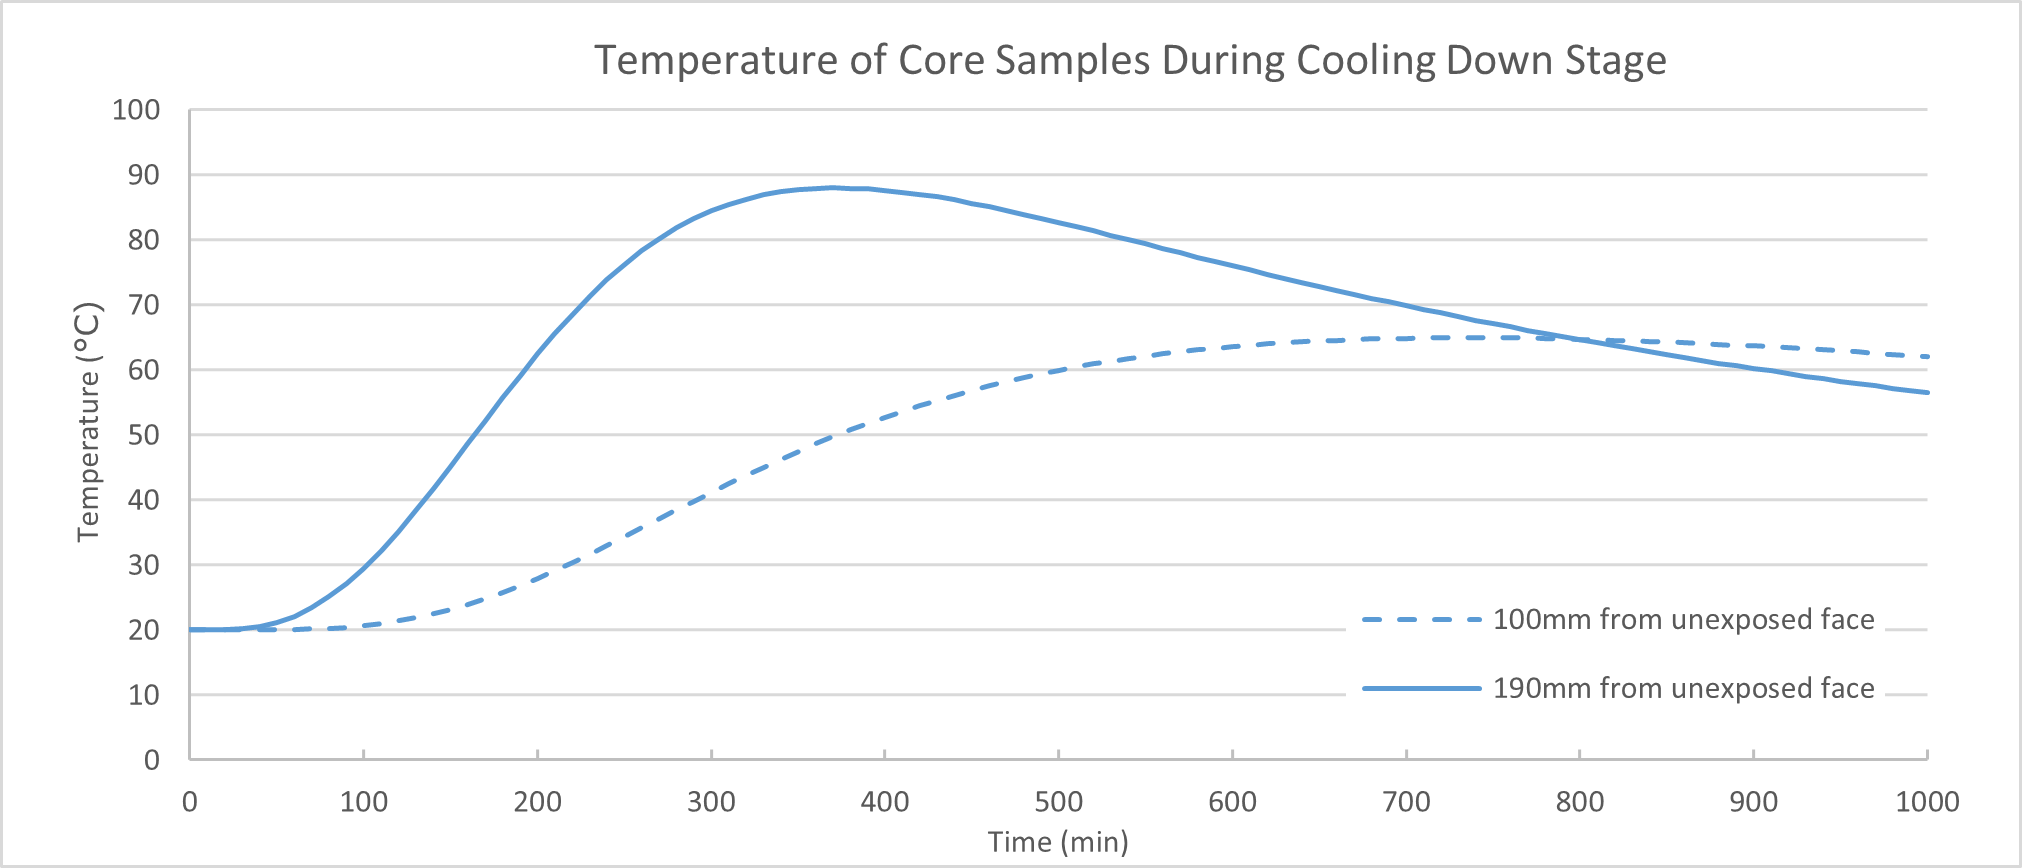
High temperatures are known to reduce the residual strength of concrete. The ACI 2001 has reported test samples exposed to 300°C resulting in a residual strength of 40% less. Moreover, even at relatively low temperatures <100 °C concrete can still experience a loss in strength. By adopting a model proposed by Khoury, G.A. (1992)[39] to predict residual compressive strength, a sample exposed to 75°C results in a 17% loss. This does not fully account for the reduction in strength of the core samples, however, given the design class of C50/60 and actual reported average strength of 80MPa, the residual strength of 40MPa is close to that adopted in the design and is therefore acceptable. It is recommended that a 90-day strength is specified in the design for this reason.
Validation summary
The fire test results generally show good agreement with the design approach and numerical models. Any discrepancies tend to be conservative and are therefore acceptable.
Discussion and conclusion
This paper has presented the HS2 G2S Green Tunnels (Greatworth & Chipping Warden) fire design approach. It has demonstrated with both simplified and advanced methods of analysis that the tunnel lining fire resistance are acceptable when subjected to the EUREKA time – temperature curve.
The advanced methodology adopts the thermal and mechanical dependant properties of concrete at elevated temperatures. The behaviour and results have been compared to fire tests conducted on two full scale test segments. The advanced method of analysis has shown good agreement with the test results, providing confidence in the methodology and confirmation of the structural reliability.
The mechanical properties of concrete and steel will undergo significant and permanent changes when subjected to elevated temperatures. After the fire event it will be likely that rectification works will be required. The lining would have to be reviewed by relevant experts and rectifications works may include the removal of concrete exposed to a temperature which results in significant loss of strength and subsequent reinstatement of high strength concrete will be required.
Full scale tests are required to confirm the fire load capacity of reinforced concrete at elevated temperatures. It was recognised during this fire assessment that when the fire is on the tension side and adequate cover is provided such that steel does not reach high temperatures, then the reduction in load capacity is relatively small compared to ambient temperatures. If the concrete cover of circa 45mm is present after spalling this would be the case. When the fire is located on the compression face then cover to reinforcement is not relevant and instead the reduction in bearing capacity was found to be higher due to the loss of strength from the concrete compression block due to elevated temperatures.
The current version of the Eurocode[4] does not provide guidance on the residual strength of concrete when heated and cooled to ambient temperatures. The compressive strength test results for the present project recorded residual strength of circa 70%, which is in line with many researchers results. Designers should carefully consider the residual strength and how this impacts the tunnel stability post fire to ensure the safety of construction workers during rectification works.
This paper has presented the methodology for the fire design case and provided the criteria, often difficult to define in these cases, to verify the lining against for each load case during and after the fire event. The information presented maybe used both directly or indirectly as a reference to other designs or for further development.
Acknowledgements
The authors would like to thank HS2 C3 Team for the permission to publish this work. EKFB provided support and special thanks goes to Mr Jeremie Martin. The authors wish to thank Jesus Rodriguez at LUSAS Consultancy for his assistance with the advanced numerical modelling. Recognition extends to CERIB for provoking stimulating discussions prior and after the fire tests.
References
- Specification for Civil Engineering Works, Series 4055: Tunnelling – Fire Testing of Concrete for Tunnel Linings and Underground Structures, Document no: HS2-HS2-CV-SPE-000-014055
- Euan, S., & Sotiris P. Innovative and sustainable twin arch solution for High Speed Two Green Tunnels High Speed Two (HS2): Infrastructure Design and Construction (Volume 3). January 2023, 187-202
- British Standards Institution. (2006) BS EN 1991-1: Eurocode 1: Basis of Design and Actions on Structures. Part 1: London, British Standards Institution.
- British Standards Institution. (2005) BS EN 1992-1-2. General rules – Structural Fire Design. London, British Standards Institution.
- Efectis, Test Procedure for Fire-Resistant Tunnel Lining and Other Tunnel Components (2020). Rijkswaterstaat Ministry of Infrastructure and the Environment: The Netherlands. p. 46.
- Khoury, G.A. (2002). Passive protection against fire. Tunnels and Tunnelling International, November, p. 40–42
- International Tunnelling Association (2004), Guidelines for Structural Fire Resistance for Road Tunnels, Working Group No.6 Maintenance and Repair.
- Precast Concrete Segmental Liners for Large Diameter Road Tunnels – Literature Survey and Synthesis, 2020-09-01, FHWA-HIF-20-035, https://rosap.ntl.bts.gov/view/dot/56194
- Caner, A. and A. Böncü, Structural fire safety of circular concrete railroad tunnel linings. Journal of structural engineering, (2009). 135(9): p. 1081-1092
- Cucino, P., & Omizzolo, A. (2010). A finite element insight on reinforced concrete tunnels under fire conditions.
- Diaz Jose Suarez, et al. (2018) Fire design strategy in permanent tunnel linings (secondary linings), in Crossrail Project: Infrastructure design and construction. ICE Publishing. p. 131-152
- Chrysanthos Maraveas (Technical Director) & Apostolos A. Vrakas (Civil Eng.) (2014) Design of Concrete Tunnel Linings for Fire Safety, Structural Engineering International, 24:3, 319-329, DOI:
- Monckton, H. (2018). Practical design, testing & verification guidelines for pre-cast segmental tunnel linings subjected to fire loading. Tunnelling and Underground Space Technology. 77. 237-248. 10.1016/j.tust.2018.04.00410.2749/101686614X13830790993041
- LUSAS., 2016. Modeller Reference Manual, Version 15.2 Issue 1. LUSAS, Kingston upon Thames, UK.
- Grunicke, U.H., Walter, H (2007). Fire safety of the unterinntalstrecke – nonlinear FE analyses as a tool for ultimate limit state design. ECCOMAS thematic conference on computational methods in tunnelling, Vienna.
- Janβen, P., 1983. Tragverhalten von Tunnelausbauten mit Gelenktübbings. PhD thesis Technische Universität Braunschweig.
- Anderberg, Y. & Thelandersson, S. (1976) Stress and Deformation Characteristics of Concrete at High Temperatures – part 2: Experimental Investigation and Material Behaviour Model. Lund, Lund Institute of Technology. Division of Structural Mechanics and Concrete Construction, bulletin 54.
- Venkatesh Kumar R. Kodur, Ph.D., P.Eng.; M. Z. Naser, Ph.D. (2020) P.E. Structural Fire Engineering (McGraw Hill: New York, Chicago, San Francisco, Athens, London, Madrid, Mexico City, Milan, New Delhi, Singapore, Sydney, Toronto. Available at: Access Engineering
- fib Model Code. (2010). fib Model Code for Concrete Structures 2010. International Federation for Structural Concrete (fib).
- Bamonte P., Meda A. (2006), “Towards a Simplified Approach for the Sectional Analysis of R/C Members in Fire”. Proceedings of the 2nd International Congress, Keep Concrete Attractive, Naples, Italy, 5-8.
- Angus Law MG. Load induced thermal strains, implications for structural behaviour. In: Tan KH, Kodur VKR, Tan TH, editors. Fifth Int. Conf. Struct. Fire, Nanyang Technological University, Singapore: SiF 2008 Organising Committee; 2008. p. 488–96
- Seręga S. (2008). A new simplified method for determining fire resistance of reinforced concrete sections, In Proceedings of 6th International Conference Analytical Models and New Concepts in Concrete and Masonry Structures.
- Hertz K.D. (1981) Design of Fire Exposed Concrete Structures. Report no. 160, CIB W15/81/20(DK). Technical University of Denmark, Lyngby.
- Chudyba, K. and Serega, S. (2013) Structural fire design methods for reinforced concrete members. Technical Transactions Civil Engineering, 110(1-B):15-36
- Jefferson, A.D., 2003. “Craft––a plastic-damage-contact model for concrete. I. Model description”. International Journal of Solids and Structures.
- Shuttleworth, P., Fire protection of concrete tunnel linings, Proceedings, 3rd Int. Conf. on Tunnel Fires & Escape From Tunnels, Washington DC, USA, 9-11 October 2001, pp. 157-165
- Matesová, D. & Vořechovský (2005). Reduction functions for mechanical/fracture parameters of concrete at elevated temperatures. Proceeding of the 4th international conference on new trends in statics and dynamics of buildings. Slovakia.
- Giacomo Torelli, Parthasarathi Mandal, Martin Gillie, Van-Xuan Tran. (2016). Concrete strains under transient thermal conditions: A state-of-the-art review, Engineering Structures, Volume 127, Pages 172-188, ISSN 0141-0296.
- H.K.M. Smith, T. Stratford, L. Bisby. (2015) Deflection Response of Reinforced Concrete Slabs Tested in Punching 69 Shear in Fire, in: Applications of Structural Fire Engineering, Dubrovnik, Croatia.
- Fingerloos, Frank. (2007). Buchbesprechung: fib Bulletin 38: Fire design of concrete structures – materials, structures and modelling. Beton- Und Stahlbetonbau – BETON- STAHLBETONBAU. 102. 662-662. 10.1002/best.200790131.
- Angus Law MG. Load induced thermal strains, implications for structural behaviour. In: Tan KH, Kodur VKR, Tan TH, editors. Fifth Int. Conf. Struct. Fire, Nanyang Technological University, Singapore: SiF 2008 Organising Committee; 2008. p. 488–96
- Anderberg, Y. & Thelandersson, S. (1976) Stress and Deformation Characteristics of Concrete at High Temperatures – part 2: Experimental Investigation and Material Behaviour Model. Lund, Lund Institute of Technology. Division of Structural Mechanics and Concrete Construction, bulletin 54.
- Al Hamd, R. K. S., Gillie, M., Warren, H., Torelli, G., Stratford, T., & Wang, Y. (2018). The effect of load-induced thermal strain on flat slab behaviour at elevated temperatures. Fire Safety Journal, 97, 12-18.
- Concrete propensity to fire spalling: testing and observations, Izabela Hager, Katarzyna Mróz and Tomasz Tracz, MATEC Web Conf., 163 (2018) 02004, DOI
- Jansson, R. (2013). Fire spalling of concrete: theoretical and experimental studies (Doctoral dissertation, KTH Royal Institute of Technology).
- Jihad Miah. (2017) The Effect of Compressive Loading and Cement Type on the Fire Spalling Behaviour of Concrete. Risques. Université de Pau et des Pays de l’Adour – Laboratoire SIAME. English.
- Khoury, G.A. (2000). “Effect of fire on concrete and concrete structures”. Prog. Struct. Engng Mater. 2000; 2:429-447
- Concrete Advice 47 Assessment of in-situ concrete strength using data obtained from core testing to BS EN 13791:2007.
- Khoury, G.A. (1992) Compressive Strength of Concrete at High Temperatures: Reassessment. Magazine of Concrete Research, 44, 291.
Peer review
- Martyn Noak